 Open Access Article
Creative Commons Attribution 3.0 Unported Licence
DFT and TD-DFT studies of new triphenylamine-based (D–A–D) donor materials for high-efficiency organic solar cells†
Numbury Surendra
Babu

Computational Quantum Chemistry Lab, Department of Chemistry, College of Natural and Mathematical Science, The University of Dodoma, Dodoma, Tanzania. E-mail: nsbabusk@gmail.com
First published on 3rd March 2022
Abstract
The DFT approach of Becke's three-parameter compound (B3LYP) was employed in all studies of triphenylamine (TPA) molecules as a donor (D) for solar cell applications in this work. We created three donor molecules (D–A–D) with a strong donor moiety of triphenylamine (TPA) connected to three distinct acceptor (A) units, including benzo[c][1,2,5]thiadiazole, [1,2,5]thiadiazolo[3,4-c]pyridine, and [1,2,5]thiadiazolo[3,4-d]pyridazine. DFT and TD-DFT methods were used to examine the photophysical properties, frontier molecular orbitals (FMOs), density of states (DOS), and open-circuit voltages (VOC). The designed molecule D3 has been proven to be the best candidate for solar cell applications over the others due to its promising photovoltaic properties, which include the lowest bandgap (1.53 eV) and excitation energy (1.21 eV), a low binding energy (Eb = 0.31 eV), and the highest max values of 964.01 nm and 1017.00 nm in the gas and solvent phases, respectively. This theoretically developed model indicates that D–A–D unit modifications are a viable alternative to achieve the desired optoelectronic properties. As a result, the developed D1, D2, and D3 molecules are exceptional and strongly suggested to experimentalists for the future creation of highly efficient solar cell systems.
1. Introduction
In recent years, depleting energy resources have necessitated a favourable alternative that might assist us in producing energy at a lower cost and with fewer environmental concerns (i.e. pollution, greenhouse effect, etc.). To safeguard the environment from climate change, efforts are being made to develop environmentally friendly energy options. Renewable energy is also known as fossil fuel recycling, and its sources are expected never to run out, just as sustainable energy sources will never run out.1 Solar energy,2 wind energy,3 hydropower energy,4 biogas energy,5 and tidal energy6 are high-potential renewable sources. Sunlight is a common bestowal that provides inexpensive and environmentally friendly energy. Photovoltaic devices and solar cells that work on the photoemission phenomenon convert sunlight into electricity.7,8 The acceptor sections of a photovoltaic cell capture sunlight and convert it into electricity.9 The donor, acceptor, and bridge are the three essential components of a photovoltaic solar cell. The donor portion sends electrons to the acceptor, which uses electrons to capture sunlight, and the bridge works as a spacer between the acceptor and donor parts.10 Fundamentally, there are three types of photovoltaic solar cells: (1) inorganic solar cells with silicon semiconducting materials, (2) organic solar cells with polymer and tiny acceptor moieties, and (3) hybrid solar cells (combined organic and inorganic materials).11 Photovoltaic devices used silicon as the semiconducting material in early investigations, now accessible on the market. With a maximum power conversion efficiency (PCE), silicon-based photovoltaic solar cells exhibited reduced toxicity, high abundance, high efficiency, and high thermal security,12 but they had certain disadvantages such as rigidity, high price, and non-tunable energy levels. Because of the drawbacks of silicon-based solar cells, they are no longer being considered.A low-cost, lightweight, flexible organic photovoltaic (OPV) cell has the potential to deliver solar energy to a variety of intriguing applications. The introduction of a bulk heterojunction (BHJ) architecture, in which push–pull (or D–A) conjugated copolymer donors (absorbing the solar spectrum in the near-IR region of 680–950 nm) form an interpenetrating network with fullerene-derivative acceptors, improved the power conversion efficiency (PCE) by 12%. For high PCE OPV donors, a narrow bandgap, high charge carrier mobility and efficient charge separation and collection are desirable and are frequently achieved through morphological control.
Because of their homogeneous and well-defined molecular structure, OPV cells with tiny molecular donors have recently gained much attention because they avoid batch-to-batch changes in the molecular weight, polydispersity, and purity of polymeric donors.
Small-molecule donors could provide more consistent morphological control and finer energy-level control through chemical-structure modifications.13
When they were first introduced in 2006, they attracted little attention because of their extremely low PCE (1%), but in 201213 the PCE improved to 6.7 percent with a D1–A–D2–A–D1 type of small-molecule donor, DTS(PTTh2)2, and it has since improved to 8–9 percent with continuous optimization of the molecular structure that modifies or replaces each unit to introduce new A–D–A combinations.14–17
The creation of current donor–acceptor (D–A) small molecules with a reduced energy gap (Eg) between HOMOs and LUMOs18 due to a fast electron transfer between electron-donating and electron-withdrawing moieties19 is an essential strategy for improving the performance of solar systems. Nowadays, DFT-based molecular engineering has allowed us to design new small molecular donor materials and theoretically test their photovoltaic and optoelectronic capabilities, which can then be compared to empirically manufactured molecules. Furthermore, scientists can investigate the many efficiency parameters of photovoltaic materials using computer analysis.20–22
TPA-based materials have excellent electro-optical characteristics and improve the material hole mobility.10 In addition, the terminal groups of TPA are substituted with new highly efficient groups with strong electron-withdrawing properties in these developed structures. Photophysical characteristics, frontier molecular orbitals (FMOs), reorganization energies, density of states (DOS) and overlap population density of states (OPDOS), open-circuit voltages (VOC), transition density matrix (TDMs), and surface and charge transfer analysis were all assessed using the DFT and TD-DFT approaches. The results indicated that DFT-based small-molecule donors (D1–D4) are superior for high-efficiency solar cells.
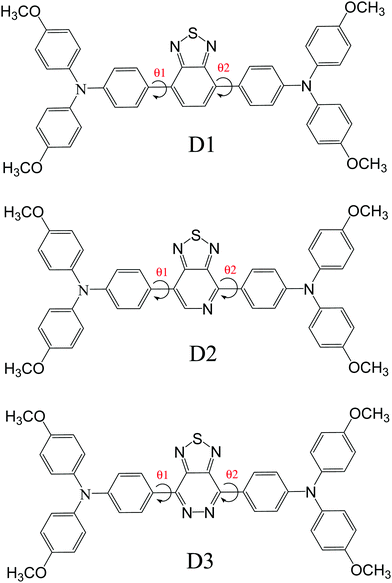
We created three donor molecules (D–A–D) with a strong triphenylamine (TPA) donor moiety coupled to three distinct acceptor (A) units, including benzo[c][1,2,5]thiadiazole, [1,2,5]thiadiazolo[3,4-c]pyridine and [1,2,5]thiadiazolo[3,4-d]pyridazine (Scheme 1).
2. Computational details
The goal of this study is to improve the optoelectronic capabilities of triphenylamine based donor molecules using specific acceptor units benzo[c][1,2,5]thiadiazole (D1), [1,2,5]thiadiazolo[3,4-c]pyridine (D2), and [1,2,5]thiadiazolo[3,4-d]pyridazine(D3); the structural modification of the donor molecules is done by keeping the acceptors (central units) (Scheme 1). The Gaussian 09 suite23 was used for all the calculations. The GaussView 5.0.8 program24 was used to visualize the results and draw the structures. The geometries and electronic characteristics of the molecules were investigated using density functional theory (DFT) methods.25–27 The B3LYP28 method of DFT with the 6-31G29 basis set was used to optimize the geometries of all molecules (neutral, anionic, and cationic states). In the gas phase, the excited state geometries were computed using TD-DFT at the TD-B3LYP/6-31G20–32 level of theories. The polarization continuum model (PCM)33 was used to investigate the solvent effect. The density of states (DOS) spectra were depicted using Gauss Sum 2.2.0.343. Results and discussion
3.1. Optimized geometries
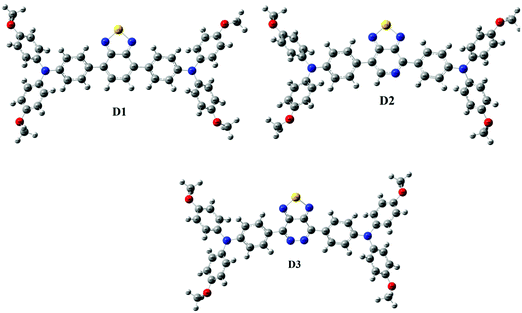
In the visible light absorption of a chemical substance, planarity in molecular geometry and the related-electron conjugation over the backbone are crucial. Fig. 1 (Fig. S1, ESI† – in chlorobenzene) shows the optimized molecular structures of D1, D2, and D3. The D–A–D has planarized the geometry of the resultant polymer by producing a delocalized-electronic cloud density across the backbone, as shown by a perfect 180° dihedral (Table 1) of the D–A–D. The low cost and uncomplicated synthesis technique of D–A–D can be attributed to its intra-chain dihedral angle (180°). This claim also contradicts the current research.35–37 Donor dihedral angles are also close to planarity in intramolecular rings. The internal steric hindrance of the N atoms of adjacent rings of benzothiadiazole caused them to fall out of the plane as well, causing A to deviate from 180°.| Donor | Gas | Chlorobenzene | Gas | Chlorobenzene | ||
|---|---|---|---|---|---|---|
| θ1 | θ2 | θ1 | θ2 | μ e (Debye) | μ e (Debye) | |
| D1 | 148.96 | 148.91 | 147.39 | 147.33 | 4.3873 | 5.5353 |
| D2 | 150.03 | 177.42 | 148.25 | 178.29 | 4.5499 | 5.6140 |
| D3 | 178.12 | 177.17 | 178.26 | 177.01 | 3.0075 | 3.9134 |
3.2. Frontier molecular orbitals and electronic properties
Studies of frontier molecular orbitals are used to determine the excited-state features of computationally created molecules for organic solar cells (OSCs) (FMOs). The charge transport mechanism was better understood because of the excited-state features of organic solar cells. By generating effective OSC devices, the photovoltaic efficiency of OSCs is increased through alteration of the charge transfer mechanism within molecules. Changing the charge transfer mechanism in OSCs made with a tiny molecule necessitates energy. The energy gap (Eg) becomes minimal when manufacturing tiny molecule-based OSCs. The photovoltaic performance of OSCs will be better if the Eg value is lower and vice versa.20The HOMO and LUMO describe the bonding and antibonding properties of designer molecules in their excited and ground states, respectively. The charge transfer in OSCs is accomplished from the donor HOMO to the acceptor LUMO and vice versa for the current generation. The efficiency of cells, the amount of current, and the voltages are all directly related to electron transfer. As a result, the phenomenon of electron excitation is improved, which improves the electron transport.38 The stability and testability of HOMO–LUMO energy orbitals also play a role in electronic excitation. More significant electronic excitation follows more de-stable filled highest occupied molecular orbitals (HOMOs) and vice versa.39 However, to capture more sunlight and ensure good device performance, the energy of LUMOs should be increased.40 Highly stable LUMOs can keep the maximum number of electrons in the acceptor region of the cell for extended periods, allowing more sunlight to be absorbed and converted into electricity, boosting the device performance.
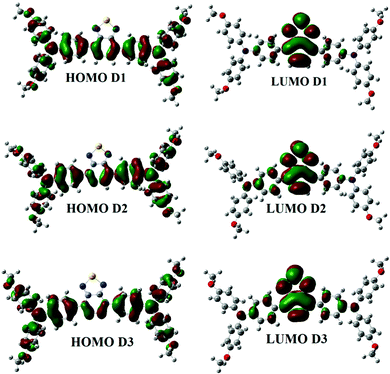
Fig. 2 shows the FMO distribution patterns for D1, D2, and D3 at B3LYP/6-31G. For donor molecules, the HOMO–LUMO distribution is nearly identical. The HOMO is found on the TPA moiety in all compounds, but the LUMO is distributed throughout the molecule with the highest density on the central acceptor unit. The methoxy group enhances the energies of the HOMO and LUMO in D2 and D3, but the effect is more potent in D1. Therefore, an increase in the energy level is expected for electron-donating methoxy groups. The methoxy groups in D3 have a similar impact on the HOMO but have the opposite effect on the LUMO (which is more stabilized than D1).
We see a relatively uniform electron distribution for D3 in the HOMO (Fig. S2, ESI† – in chlorobenzene), implying that the hole density will be evenly distributed in the electronically excited molecule and the charge-separated hole carrier. The LUMO is found on the BT and CMA moieties of the molecules, which is consistent with the projected internal acceptor capability of this unit. Due to the total delocalization of donor moieties like TPA and methoxy (OCH3) groups, the charge density for HOMO 1 in D1–D3 is dispersed over the entire molecule, while for LUMO+1, the density (in all compounds) is directed towards the acceptor unit of the molecule (away from the donor side). The electron density shifts towards TPA rings in the case of the HOMO. There is a variation in all compounds for HOMO 3. The electron density in HOMO 3 is pushed towards the TPA ring in M1, while it is distributed across the entire molecule in D2 and D3. In LUMO+2, the electron density is distributed across the whole molecule (in all the compounds), whereas, in LUMO+3, the electron density moves towards acceptor units (M1 and M3). The electron density in LUMO+3 is concentrated on the TPA portion for D2 (Fig. S3, ESI†).
At the B3LYP/6-31G level of DFT, the HOMO and LUMO energy values for D1, D2, and D3 molecules are −4.53591 eV, −4.5691 eV and −4.63631, and −2.49488 eV, −2.80127 eV, and −3.08235 eV, respectively, as illustrated in Fig. 3 and Table 2. All the developed molecules D1, D2, and D3 had Eg values of 2.0410 eV, 1.7678 eV, and 1.5539 eV, respectively. Compared to D1 and D2, the D3 molecule has a lower HOMO value (−4.636 eV). The inclusion of the [1,2,5]thiadiazolo[3,4-d]pyridazine acceptor group gives molecule D3 a higher HOMO value. Because of its lower HOMO value (4.535 eV), the D1 molecule is more stable than the others. The LUMO values of the D1 and D2 molecules are −2.49488 eV and −2.80127 eV, respectively. D1 > D2 > D3 is the decreasing order of Eg (HOMO–LUMO energy gap) of D1–D3 molecules. The most significant charge transfer phenomena are indicated by a small range of Eg in all molecules (D1–D3). The D3 molecule has the lowest Eg value (1.553 eV) compared to the others (D1 and D2), indicating that electrons are transferred from the donor HOMO (D3) to the acceptor LUMO (D2) and vice versa. Fig. 1 depicts the comparison of the HOMO–LUMO energies and Eg. The higher the open-circuit voltage (VOC) of the OSCs, the lower the HOMO values of the molecules.41
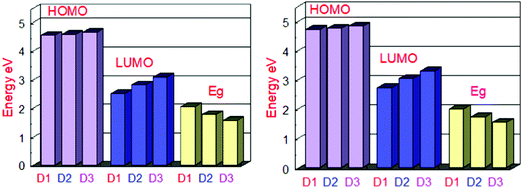 | ||
| Fig. 3 Orbital energy representation of the designed molecules D1–D3 and their energy band gaps in the gas phase (left) and the solvent (right). | ||
| Donor | HOMO | LUMO | E g (eV) | E opt (eV) | E b (eV) | V OC |
|---|---|---|---|---|---|---|
| Gas | ||||||
| D1 | −4.5359 | −2.4948 | 2.0410 | 1.6792 | 0.3618 | 0.5359 |
| D2 | −4.5691 | −2.8012 | 1.7678 | 1.4550 | 0.3128 | 0.5691 |
| D3 | −4.6363 | −3.0823 | 1.5539 | 1.2863 | 0.2676 | 0.6363 |
| Chlorobenzene | ||||||
| D1 | −2.7155 | 1.9895 | 1.9895 | 1.5947 | 0.3948 | 0.7051 |
| D2 | −3.0301 | 1.7169 | 1.7169 | 1.3656 | 0.3513 | 0.7470 |
| D3 | −3.2915 | 1.5321 | 1.5321 | 1.2193 | 0.3128 | 0.8237 |
3.3. Optical properties
The UV/visible absorption spectra of the suggested photovoltaic materials are simulated using the TD-DFT/B3LYP/6-31G method in both the gas (vacuum) and solvent (chloroform) phases (D1–D3). In both gas and solvent phases, Table 3 shows the values for the maximum absorption wavelength (max), excitation energy (Ex), oscillator strength (fos), and significant MO assignments. Because of the replacement of different acceptors, the absorption spectra of D1–D3 molecules have been red-shifted. As a result, the developed compounds (D1–D3) have max values ranging from 738.46 to 1017.00 nm.| Molecules | State | λ max (nm) | f os (a.u.) | E x (eV) | Major MO assignments |
|---|---|---|---|---|---|
| Gas | |||||
| D1 | S1 | 738.46 | 0.4019 | 1.6790 | HOMO → LUMO(99%) |
| S2 | 622.19 | 0.0057 | 1.9928 | HOMO−1 → LUMO(99%) | |
| S3 | 431.49 | 0.0171 | 2.8734 | HOMO−2 → LUMO(99%) | |
| D2 | S1 | 852.24 | 0.4632 | 1.4548 | HOMO → LUMO(97%) |
| D3 | 674.15 | 0.0600 | 1.8391 | HOMO−1 → LUMO(100%) | |
| 460.50 | 0.0110 | 2.6924 | HOMO−2 → LUMO(99%) | ||
| D3 | S1 | 964.01 | 0.5398 | 1.2861 | HOMO → LUMO(99%) |
| S2 | 731.76 | 0.0266 | 1.6943 | HOMO−1 → LUMO(99%) | |
| S3 | 632.10 | 0.0014 | 1.9615 | HOMO−2 → LUMO(99%) | |
| Chlorobenzene | |||||
| D1 | S1 | 777.58 | 0.4314 | 1.5945 | HOMO → LUMO(98%) |
| S2 | 649.19 | 0.0062 | 1.9098 | HOMO−1 → LUMO(99%) | |
| S3 | 444.25 | 0.0196 | 2.8162 | HOMO−2 → LUMO(%)(99%) | |
| D2 | S1 | 908.01 | 0.5414 | 1.3655 | HOMO → LUMO(98%) |
| D3 | S2 | 705.78 | 0.0139 | 1.7567 | HOMO−1 → LUMO(100%) |
| S3 | 469.97 | 0.0139 | 2.6382 | HOMO−2 → LUMO(100%) | |
| D3 | S1 | 1017.00 | 0.6657 | 1.2191 | HOMO → LUMO(13%) |
| S2 | 756.31 | 0.0379 | 1.6393 | HOMO−1 → LUMO(13%) | |
| S3 | 580.43 | 0.0010 | 2.1361 | HOMO−5 → LUMO(15%) | |
| HOMO−4 → LUMO(70%) | |||||
| HOMO−3 LUMO(99%) | |||||
The computed maximum values of D1–D3 molecules with the acceptor benzo[c][1,2,5]thiadiazole in D1, [1,2,5]thiadiazolo[3,4-c]pyridine in D2, and [1,2,5]thiadiazolo[3,4-d]pyridazine in D3 display high, sharp, and broad absorption peaks in the spectra. The quality of creating photovoltaic materials is improved by the broad and intense adsorption characteristics of the molecules.42 In a vacuum, the λmax values for D1, D2, and D3 are 738.46 nm, 852.24 nm, and 964.01 nm, and in the chloroform solvent they are 777.58 nm, 908.01 nm, and 1017.00 nm, respectively. The efficiency of acceptor units for the designed D1–D3 molecules is described by these near-infrared (NIR) absorption peaks. The D3 molecule has the highest near infrared (NIR) max value in a vacuum and in the chloroform solvent. D3 exhibits a redshift at its maximum due to protracted conjugation and the high charge transfer capacity of the acceptor unit ([1,2,5]thiadiazolo[3,4-d]pyridazine). D3 > D2 > D1 is the decreasing order of all molecules’ maximum values. This order corresponds to the reverse order of the HOMO–LUMO energy gap: D1 > D2 > D3, implying that designing and developing high-performance molecules for solar cells is exciting and appealing.
Changing the acceptor unit in the designed molecules is a great way to tune the photophysical properties and improve the photovoltaic properties. As a result, the newly developed molecules D1–D3 exhibit enhanced optoelectronic or photovoltaic properties. The excitation energy is vital for OSCs to improve the photovoltaic or optoelectronic properties. Our developed molecules have low excitation energy, making them ideal for photovoltaic or optoelectronic applications. Better charge transfer and a higher power conversion efficiency (PCE) in OSCs are observed in the designed molecules with a lower excitation energy and vice versa. The decreasing orders of excitation energy for all the proposed molecules in the gas and solvent phases are D1 > D2 > D3 and D1 > D2 > D3, respectively. Tables 2 and 3 show the computed max values, excitation energies (Ex), oscillator strengths (fos), and significant molecular orbital assignments in the solvent and gas phases. Table 3 shows the important molecular orbital assignments or transitions that arose from HOMO–LUMO (99%) across all the compounds D1–D3 in both gas and solvent phases. This is also a property of the designed molecules with enhanced optoelectronic capabilities. The simulated absorption spectra of molecules D1–D3 produced in gas and chloroform solvent phases are shown in Fig. 4 and 5, which indicate the more prominent and more intense secondary absorption peak for each molecule. It is evident from the results in Tables 2 and 3 that end-capped unit modification has a significant impact on the max values of the designed molecules (D1–D3), resulting in a redshift in the UV/visible spectrum with a lower excitation energy and a 99 percent transition from the HOMO to the LUMO. As a result, the molecules (D1–D3) have exceptional optoelectronic capabilities.
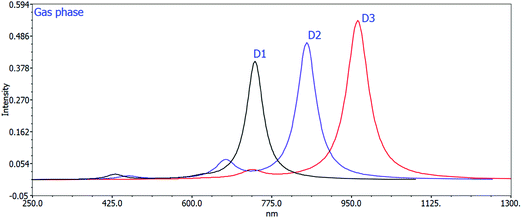 | ||
| Fig. 4 Calculated UV spectra of D1, D2, and D3 using the TD-DFT/B3LYP/6-31G method in the gas phase. | ||
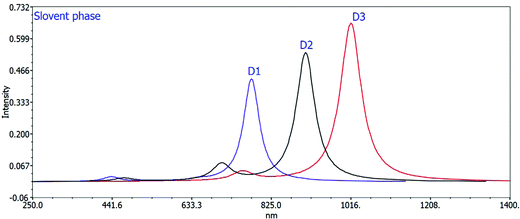 | ||
| Fig. 5 Calculated UV spectra of D1, D2, and D3 using the TD-DFT/B3LYP/6-31G method in the solvent phase. | ||
3.4. Open circuit voltage (VOC)
The open-circuit voltage (VOC) is also used to estimate organic solar cell performance. The efficiency of solar devices is proportional to the amount of VOC produced. The VOC measures the highest quantity of voltages or currents attained by photovoltaic devices in the zero current stage. VOC with a high value improves the fill factor (FF) of OSC devices, a significant factor in their efficiency.43 In photovoltaic devices, the open circuit voltage is influenced by photo-generated current and saturation voltage, favouring recombination. The LUMO energy of the acceptor and the HOMO energy of the donor molecules are directly related to the open-circuit voltage VOC. We calculated the VOC of reference R and built molecules using Scharber and his coworkers’ algorithm.44 | (1) |
The HOMO of donor molecules (D1–D3) and the LUMO of the standard acceptor polymeric material PC71BM ([6,6]-phenyl-C71-butyric acid methyl ester) display energy values of 6.1 eV and 3.7 eV, respectively.43 Concerning LUMO values of of PC71BM–HOMO, the VOC values obtained from Eqn (1). The energy gaps between donors are depicted in Fig. 6 and Table 4. In the gas and solvent phases, the open-circuit voltages (VOC) are 0.53 V, 0.56 V, 0.63 V and 0.70, 0.74, 0.82 V for D1, D2, and D3, respectively. The VOC value of the D3 donor molecule is the highest of all. The decreasing order of VOC for the designed molecules in both stages is D3 > D2 > D1.
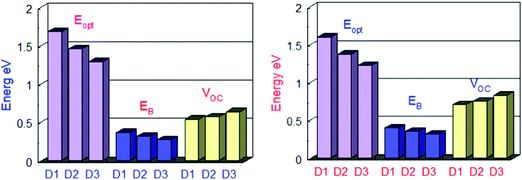 | ||
| Fig. 6 Comparison between Eg, Eopt and Eb of all the designed molecules in the gas phase (left) and in solvent (right). | ||
| Donor | HOMO | LUMO | E g (eV) | E opt (eV) | E b (eV) | V OC |
|---|---|---|---|---|---|---|
| Gas | ||||||
| D1 | −4.5359 | −2.4948 | 2.0410 | 1.6792 | 0.3618 | 0.5359 |
| D2 | −4.5691 | −2.8012 | 1.7678 | 1.4550 | 0.3128 | 0.5691 |
| D3 | −4.6363 | −3.0823 | 1.5539 | 1.2863 | 0.2676 | 0.6363 |
| PC71BM | −6.1 | −3.7 | — | — | — | — |
| Chlorobenzene | ||||||
| D1 | −2.7155 | 1.9895 | 1.9895 | 1.5947 | 0.3948 | 0.7051 |
| D2 | −3.0301 | 1.7169 | 1.7169 | 1.3656 | 0.3513 | 0.7470 |
| D3 | −3.2915 | 1.5321 | 1.5321 | 1.2193 | 0.3128 | 0.8237 |
The VOC is usually determined by the HOMO and LUMO levels of the donor and acceptor. The lower LUMO value of the PC71BM acceptor creates a higher open-circuit voltage, which improves the photovoltaic characteristics of OSCs. The lower LUMO of the PC71BM acceptor causes an increase in electron transport from the HOMO of the donor to the LUMO of the PC71BM acceptor, improving the photovoltaic characteristics of OSCs. Furthermore, the Eg of the proposed donor and PC71BM acceptor molecules boosts the OSC PCE values. The orbital energies of D1–D3 donors concerning the PC71BM acceptor is shown. Table 4 shows that the LUMO of PC71BM is lower than that of donor molecules (D1, D2 and D3). Therefore, the designed donor molecules (D1, D2, and D3) are shifted to the acceptor PC71BM, which improves the photovoltaic characteristics of all these molecules.
3.5. Exciton binding energies (Eb)
The exciton binding energy determines the charge separation rate and efficiency of OSCs. The exciton binding energy measures the interaction of coulombic forces between electrons and holes. If the exciton binding energy is larger, the electron–hole coulombic interaction will be higher, and vice versa. The exciton binding energy is calculated using the Eg value and the initial singlet excitation energy (Eopt).45 The exciton binding energy is computed theoretically using eqn (2):| EB = Eg − Epot | (2) |
Table 4 shows the exciton binding energies for the developed and reference molecules. More significant charge separation is observed if the exciton binding energy is lower. As a result, the D3 molecule has a more considerable charge dissociation than the D1, D2, and D3 molecules. The results in Table 4 reveal that the designed molecules have lower exciton binding energies and display more charge separation than the other donors. For all the proposed molecules D1–D3, the lower the exciton binding energy, the higher the current charge density (Jsc). The exciton binding energy decreases in the order of D3 > D2 > D1. Fig. 6 shows a detailed comparison of Eg, Eopt, and Eb.
3.6. Dipole moment
The polarity of the designed molecules (D1–D3) in the chlorobenzene solvent is determined by measuring their dipole moments. The solubility of OSC materials is directly proportional to the dipole moment. The solubility of OSC materials increases as the dipole moment increases.46 OSC materials have a reduced dipole moment due to their symmetry, diminishing their solubility in polar liquids (chlorobenzene). Because of the increase in the dipole moment, increasing the number of polar atoms in the designed molecules will enhance their solubility. The charge transport phenomenon of OSC molecules is also influenced by the dipole moment; the more extensive the dipole moment, the greater the flow of electrons between the ground and excited states. Therefore, the polarity of the designed molecules may rise in excited states. However, this is just for nanoseconds until de-excitation occurs. Table 1 shows the computed dipole moment strength of all the molecules in the chloroform solvent (CPCM model), both designed and reference. In the chloroform solvent, the predicted dipole moment strength is more significant, whereas it is lower in the gaseous phase. Because of the polar atoms in their architectures, the proposed compounds D1–D3 have a higher solubility in the chloroform solvent. In the gas and solvent phases, the dipole moments of the proposed molecules are 4.3873, 4.5499, 3.0075 Debye and 5.5353, 5.6140, 3.9134 Debye, respectively. In both the gas and solvent phases, the solubility order of all the designed molecules in the ground state is D2 > D1 > D3.3.7. Molecular electrostatic potential map analysis
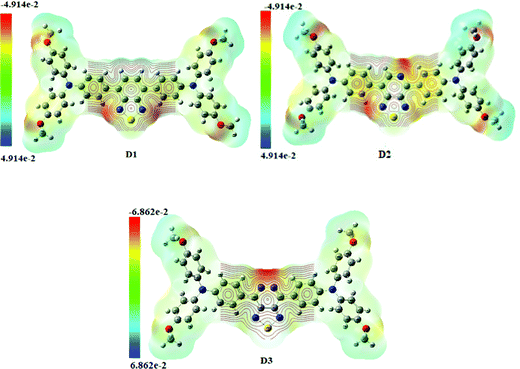
The molecular electrostatic potential surface map (MEP) depicts three-dimensional molecular charge patterns. These maps show the variable charged areas and the deficient and rich electron sites of the D1–D3 molecules. Charge distribution data can be used to determine how the molecules interact with one another. The positive and negative electrostatic potential in molecules D1–D3 is located using MEP map surfaces. A distinct colour scale shows the negative and positive electrostatic potential of each MEP map surface. The negative extreme in Fig. 7 (Fig. S4, ESI† – in chlorobenzene) is red, while the positive extreme is blue. The red colour indicates the minimum electrostatic potential (rich electron density) with a negative electrostatic potential, which acts as an electrophilic assault area. The blue colour shows the highest electrostatic potential (a lower electron density) and functions as a nucleophilic attack area.42 It is fascinating to note that all the developed (D1–D3) molecules have the same molecular electrostatic potential (MEP) distribution pattern, indicating that new molecules for solar cells can be designed efficiently and effectively. The centre acceptor and bridge units of D1–D3 molecules have a negative electrostatic potential (blue colour), but the end-capped donor units have a positive electrostatic potential (green colour) (red colour). The D3 molecule has a more excellent negative charge distribution (negative electrostatic potential) than the other donors, as shown in Fig. 7.3.8. Density of states and overlap population density of states
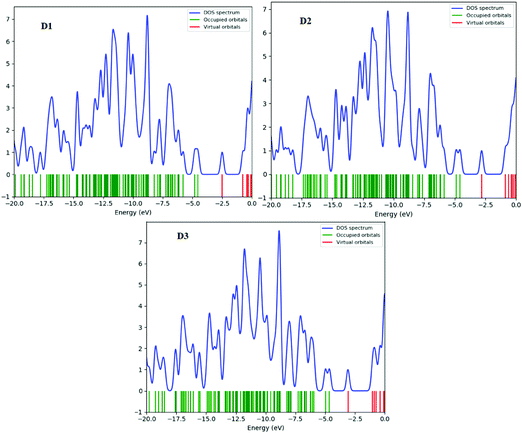
The density of states (DOS) is the number of various states that electrons will occupy at a given energy level, i.e. the number of electron states per unit volume per unit energy. A high DOS value indicates numerous forms accessible for energy levels. The DOS value of zero indicates that there are no states accessible for energy level occupation. Calculating the DOS allows one to identify the gap between energy bands and the general distribution of states as a function of energy.47 In the boundary region, neighbouring orbitals may have quasi-degenerate energy levels. The HOMO and LUMO alone cannot offer a meaningful representation of frontier molecular orbitals. The density of states (DOS) is estimated for this purpose. Fig. 8 and (Fig. S5, ESI† – in chlorobenzene) show the DOS plots of D1–D3 molecules at the B3LYP/6-31G level of theory, respectively. Determining molecular orbital (MO) configurations is the most important use of density of states (DOS) charts.Red, green, and blue lines represent the electronic distribution of donor and acceptor bridge groups in the DOS plots of the designed D1–D3 molecules, respectively. The DOS plot presents the orbital properties at various energy levels. In the DOS plots, the effect of the bridge group on the distribution patterns of all the proposed molecules can be seen (Fig. 8). The donor groups contribute around 20 to –0.0 eV energy to the frontier molecular orbitals in the planned molecules D1, D3, and D4. The negative and positive energies represent the HOMO and LUMO orbital energies along the x-axis, respectively; the HOMO–LUMO energy gap represents the distance between positive and negative energies.
4. Conclusion
State-of-the-art quantum chemical approaches were employed to investigate the effect of end-capped unit modifications of the designed TPA (triphenylamine) based materials (D1–D3) on the structure–activity, charge transfer and optoelectronic properties. These molecules have shown red-shifted and broader absorption spectra in the range of 738.46–964.01 nm in the gas phase and in the range of 777.58–1017.00 nm in chlorobenzene; the lower binding energies (Eb) of D1–D3 result from higher exciton dissociation at excited states. The optoelectronic properties of D3 are superior to those of D1 and D2 due to better charge transfer and extended conjugation of the [1,2,5]thiadiazolo[3,4-d]pyridazine acceptor. The D3 molecule with higher charge transferability is the highly recommended material for OSC applications, bearing the lowest Eg (1.5321 eV), excitation energy (1.2193 eV), and Eb (0.3128 eV), highest λmax values of 964.01 nm (in gas) and 1017.00 nm (in chlorobenzene), and a higher VOC (0.8237 V) regarding LUMOPC71BM–HOMODonor. Thus, these acceptor unit modification is an effective strategy to design efficient and effective next-generation OSC devices. Therefore, D1–D3 molecules are highly recommended to experimentalists to develop highly efficient solar cell devices.Conflicts of interest
There are no conflicts to declare.References
- L. Duan, et al., Dopant-free X-shaped D–A type hole-transporting materials for p–i–n perovskite solar cells, Dyes Pigm., 2020, 178, 108334 CrossRef CAS.
- G. E. Alvarez, M. G. Marcovecchio and P. A. Aguirre, Optimization of the integration among traditional fossil fuels, clean energies, renewable sources, and energy storages: An MILP model for the coupled electric power, hydraulic, and natural gas systems, Comput. Ind. Eng., 2020, 139, 106141 CrossRef.
- M. Shoaib, et al., Assessment of wind energy potential using wind energy conversion system, J. Cleaner Prod., 2019, 216, 346–360 CrossRef.
- U. K. Pata and M. Aydin, Testing the EKC hypothesis for the top six hydropower energy-consuming countries: Evidence from Fourier bootstrap ARDL procedure, J. Cleaner Prod., 2020, 264, 121699 CrossRef.
- S. N. B. Villadsen, et al., The potential of biogas; the solution to energy storage, ChemSusChem, 2019, 12(10), 2147–2153 CrossRef CAS PubMed.
- C. Scherelis, et al., Dataset for concurrent echo sounder and ADCP measurements at a tidal energy candidate site in Australia, Data. Br., 2020, 31, 105873 CrossRef PubMed.
- M. Adnan and J. K. Lee, Highly efficient planar heterojunction perovskite solar cells with sequentially dip-coated deposited perovskite layers from a non-halide aqueous lead precursor, RSC Adv., 2020, 10(9), 5454–5461 RSC.
- M. Adnan, Z. Irshad and J. K. Lee, Facile all-dip-coating deposition of highly efficient (CH 3) 3 NPbI 3–x Cl x perovskite materials from aqueous non-halide lead precursor, RSC Adv., 2020, 10(48), 29010–29017 RSC.
- Z. Irshad, M. Adnan and J. K. Lee, Efficient planar heterojunction inverted perovskite solar cells with perovskite materials deposited using an aqueous non-halide lead precursor, Bull. Korean Chem. Soc., 2020, 41(9), 937–942 CrossRef CAS.
- M. Adnan and J. K. Lee, All sequential dip-coating processed perovskite layers from an aqueous lead precursor for high efficiency perovskite solar cells, Sci. Rep., 2018, 8(1), 2168 CrossRef PubMed.
- M. Naeem, et al., Tuning of optoelectronic properties of triphenylamines-based donor materials for organic solar cells, J. Theor. Comput. Chem., 2019, 18(7), 1950036 CrossRef CAS.
- M. Adnan, et al., Fine tuning the optoelectronic properties of triphenylamine based donor molecules for organic solar cells, Z. Phys. Chem., 2017, 231(6), 1127–1139 CrossRef CAS.
- Y. Sun, et al., Solution-processed small-molecule solar cells with 6.7% efficiency, Nat. Mater., 2012, 11(1), 44–48 CrossRef CAS PubMed.
- J. Roncali, et al., Molecular and supramolecular engineering of π-conjugated systems for photovoltaic conversion, Thin Solid Films, 2006, 511-512, 567–575 CrossRef CAS.
- X. Sun, et al., X-shaped oligothiophenes as a new class of electron donors for bulk-heterojunction solar cells, J. Phys. Chem. B, 2006, 110(15), 7702–7707 CrossRef CAS PubMed.
- J. Zhou, et al., Solution-processed and high-performance organic solar cells using small molecules with a benzodithiophene unit, J. Am. Chem. Soc., 2013, 135(23), 8484–8487 CrossRef CAS PubMed.
- Q. Zhang, et al., Small-molecule solar cells with efficiency over 9%, Nat. Photonics, 2015, 9(1), 35–41 CrossRef CAS.
- T. Jadoon, et al., Silver clusters tune up electronic properties of graphene nanoflakes: A comprehensive theoretical study, J. Mol. Liq., 2020, 297, 111902 CrossRef CAS.
- R. Hussain, et al., Molecular engineering of A–D–C–D–A configured small molecular acceptors (SMAs) with promising photovoltaic properties for high-efficiency fullerene-free organic solar cells, Opt. Quantum Electron., 2020, 52(8), 1–20 CrossRef.
- M. Bilal Ahmed Siddique, et al., Designing triphenylamine-configured donor materials with promising photovoltaic properties for highly efficient organic solar cells, ChemistrySelect, 2020, 5(25), 7358–7369 CrossRef CAS.
- M. Y. Mehboob, et al., Designing N-phenylaniline-triazol configured donor materials with promising optoelectronic properties for high-efficiency solar cells, Comput. Theor. Chem., 2020, 1186, 112908 CrossRef CAS.
- Z. Afzal, et al., Designing indenothiophene-based acceptor materials with efficient photovoltaic parameters for fullerene-free organic solar cells, J. Mol. Model., 2020, 26(6), 137 CrossRef CAS PubMed.
- M. J. Frisch, et al., Gaussian 09, Revision A.02, Gaussian, Inc., Wallingford, CT, 2009 Search PubMed.
- E. Frisch, et al., GaussView, Version 5.0.8, Gaussian, Inc., Wallingford, 2009 Search PubMed.
- A. Savin, in Density Functional Methods in Chemistry, ed. J. K. lLabanowski, J. W. Andzelm, Springer-Velrag, New York, 1991, pp. 213–230 Search PubMed.
- P. M. W. Gill, B. G. Johnson, J. A. Pople and M. Frisch, J. Chem. Phys. Lett., 1992, 197, 499 CrossRef CAS.
- R. G. Parr and W. Yang, Density-Functional Theory of Atoms and Molecules, Oxford University Press, Oxford, 1989 Search PubMed.
- A. D. Becke, Density-functional thermochemistry. III. The role of exact exchange, J. Chem. Phys., 1993, 98(7), 5648–5652 CrossRef CAS.
- M. J. Frisch, J. A. Pople and J. S. Binkley, Self-consistent molecular orbital methods 25. Supplementary functions for Gaussian basis sets, J. Chem. Phys., 1984, 80(7), 3265–3269 CrossRef CAS.
- R. Reslan, et al. , J. Chem. Phys., 2012, 137, 22 CrossRef PubMed.
- R. Bauernschmitt and R. Ahlrichs, Treatment of electronic excitations within the adiabatic approximation of time dependent density functional theory, Chem. Phys. Lett., 1996, 256(4-5), 454–464 CrossRef CAS.
- F. Furche and R. Ahlrichs, Adiabatic time-dependent density functional methods for excited state properties, J. Chem. Phys., 2002, 117(16), 7433–7447 CrossRef CAS.
- P. Su and H. Li, Continuous and smooth potential energy surface for conductorlike screening solvation model using fixed points with variable areas, J. Chem. Phys., 2009, 130(7), 074109 CrossRef PubMed.
- N. M. O’Boyle, A. L. Tenderholt and K. M. Langner, cclib: A library for package-independent computational chemistry algorithms, J. Comput. Chem., 2008, 29(5), 839–845 CrossRef PubMed.
- H. Tan, et al., Highly efficient hybrid polymer and amorphous silicon multijunction solar cells with effective optical management, Adv. Mater., 2016, 28(11), 2170–2177 CrossRef CAS PubMed.
- A. Patra, et al., Metal free conducting pedos, Pedot, and their analogues via an unusual bromine-catalyzed polymerization, Macromolecules, 2015, 48(24), 8760–8764 CrossRef CAS.
- A. Patra, M. Bendikov and S. Chand, Poly(3,4-Ethylenedioxyselenophene) and its derivatives: Novel organic electronic materials, Acc. Chem. Res., 2014, 47(5), 1465–1474 CrossRef CAS PubMed.
- R. A. Shehzad, et al., Designing of benzothiazole based non-fullerene acceptor (NFA) molecules for highly efficient organic solar cells, Comput. Theor. Chem., 2020, 1181, 112833 CrossRef CAS.
- N. Ohta, K. Yamashita and A. Muraoka, Mechanism of charge transfer and separation in polymer/nonfullerene acceptor organic solar cells, Bull. Am. Phys. Soc., 2020, 65, 7148 Search PubMed.
- G. Deogratias, N. Seriani, T. Pogrebnaya and A. Pogrebnoi, Tuning optoelectronic properties of triphenylamine based dyes through variation of pi-conjugated units and anchoring groups: A DFT/TD-DFT investigation, J. Mol. Graphics Modell., 2020, 94, 107480 CrossRef CAS PubMed.
- J. S. Murray and P. Politzer, Molecular electrostatic potentials and noncovalent interactions, Wiley Interdisciplinary Reviews: Computational Molecular Science, Blackwell Publishing, Inc., 2017, vol. 7 (6), 01-Nov Search PubMed.
- M. Adnan, et al., Efficient synthesis and characterization of solvatochromic fluorophore, Bull. Korean Chem. Soc., 2017, 38(9), 1052–1057 CrossRef CAS.
- J. Zhao, et al., High-efficiency non-fullerene organic solar cells enabled by a difluorobenzothiadiazole-based donor polymer combined with a properly matched small molecule acceptor, Energy Environ. Sci., 2015, 8(2), 520–525 RSC.
- M. C. Scharber, et al., Design rules for donors in bulk-heterojunction solar cells - Towards 10% energy-conversion efficiency, Adv. Mater., 2006, 18(6), 789–794 CrossRef CAS.
- S. Hussain, et al., Zinc-doped boron phosphide nanocluster as efficient sensor for SO2, J. Chem., 2020, 2020, 1–12 Search PubMed.
- N. Qiu, et al., A new nonfullerene electron acceptor with a ladder type backbone for high-performance organic solar cells, Adv. Mater., 2017, 29(6), 1604964 CrossRef PubMed.
- P. Goszczycki, et al., Synthesis, crystal structures, and optical properties of the π–π interacting pyrrolo[2,3-b]quinoxaline derivatives containing 2-thienyl substituent, J. Mol. Struct., 2017, 1146, 337–346 CrossRef CAS.
Footnote |
| † Electronic supplementary information (ESI) available. See DOI: 10.1039/d2ma00048b |
| This journal is © The Royal Society of Chemistry 2022 |

