 Open Access Article
Relating the structure, properties, and activities of nanostructured SrTiO3 and SrO–(SrTiO3)n (n = 1 and 2) for photocatalytic hydrogen evolution†
Aditi
Vijay
,
Kadambari
Bairagi
and
Sonalika
Vaidya
 *
*
Institute of Nano Science and Technology, Knowledge City, Sector 81, Sahibzada Ajit Singh Nagar, Punjab 140306, India. E-mail: svaidya@inst.ac.in
First published on 26th April 2022
Abstract
This study focuses on relating the structure of perovskite oxides with their properties and activities and provides a comparative study of the three members of the Sr–Ti–O system for photocatalytic hydrogen evolution. The three oxides focused on in this study are based on perovskite structure viz. SrTiO3 and SrO–(SrTiO3)n (n = 1 and 2). We have successfully synthesized these three oxides through a methodology that combined the polymeric citrate precursor method with the hydrothermal method. Their crystal structure, morphology, and optical properties (absorption and photoluminescence) were systematically explored. SrTiO3 belonged to a class of cubic perovskite while Sr2TiO4 (n = 1) and Sr3Ti2O7 (n = 2) belonged to layered Ruddlesden–Popper based perovskite oxides. We observed the cube-shaped morphology for nanostructured SrTiO3 and layered morphology for Ruddlesden–Popper based oxides, Sr2TiO4 and Sr3Ti2O7. The photocatalytic hydrogen evolution performance of these nanostructured oxides was investigated. Amongst the three nanostructured oxides, the maximum amount of hydrogen was evolved with Sr3Ti2O7 as the photocatalyst. These results were supported by photoluminescence, time-resolved photoluminescence, and photoelectrochemical studies.
1. Introduction
Production of hydrogen energy via the utilization of solar energy is a sustainable and effective solution to the world's energy crisis and environmental problems. In this regard, photocatalytic splitting of water into H2 and O2 over a semiconducting catalyst has been recognized as an effective strategy to develop a sustainable energy structure.1,2 The efficiency of a photocatalytic reaction can be enhanced by modulating several factors such as crystal structure,3 electronic structure4 (i.e. position of the conduction band and valence band edge), the presence of vacancies (anion or cation)5 and controlling the morphology.6,7Over the past few decades, several semiconductor oxides such as TiO2, ZnO, AgGaO2, and BiVO4 have been discovered as efficient catalysts for photocatalytic hydrogen evolution.8–14 Among all the developed photocatalysts, perovskite structures i.e. ABO3 have gained much popularity because of their composition which can be easily modulated at A and B sites.15–17 Among the various perovskite semiconductor oxides, SrTiO3 is widely studied as a photocatalyst18–20 for its outstanding structural stability and compositional flexibility. Ruddlesden Popper-based layered perovskites, with a general formula of AO–(ABO3)n, (which can be also written as (An+1BO3n+1) or A′2[An−1BnO3n+1]) have attracted much attention in the field of photocatalytic water splitting due to their physical properties which can be modified by intercalation and ion-exchange.21,22 These structures consist of a large number of active sites such as the B site and the AO layer site to facilitate the reaction. Several metal ions can be doped23,24 at the A and B sites in these structures which modulates the bandgap of the oxide towards the visible region thereby enhancing their photocatalytic activity.
Fig. 1 shows the crystal structure of SrTiO3 and SrO–(SrTiO3)n (n = 1 and 2). SrTiO3 belongs to the class of perovskite that has a cubic structure composed of corner shared TiO6 octahedra with Sr, present in the holes formed from the cuboctahedron symmetry. When n = 1 and 2, the structure belongs to a class of oxide known as Ruddlesden–Popper phases. The two-lower symmetry 2D-Ruddlesden–Popper oxides, Sr2TiO4 (n = 1) and Sr3Ti2O7 (n = 2) have body-centered tetragonal symmetry. These structures are composed of stacked nSrTiO3 perovskite layers separated by a SrO rock-salt type layer, as shown in Fig. 1.
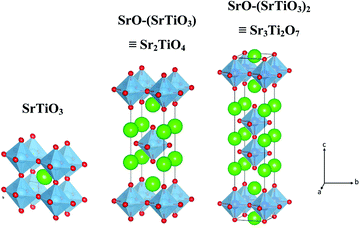 | ||
| Fig. 1 Schematic showcasing the crystal structure of SrTiO3 and SrO–(SrTiO3)n for n = 1 (Sr2TiO4) and n = 2 (Sr3Ti2O7). | ||
Here, we discuss a comparative study of the performance of nanostructured SrTiO3 and SrO–(SrTiO3)nviz. Sr2TiO4 (n = 1) and Sr3Ti2O7 (n = 2) towards photocatalytic hydrogen evolution reactions. Out of these three perovskite oxides, Sr2TiO4 and Sr3Ti2O7 belong to I4/mmm, tetragonal symmetry whereas SrTiO3 belongs to the Pm![[3 with combining macron]](https://www.rsc.org/images/entities/char_0033_0304.gif) m space group. The photocatalytic property of these nanostructured oxides is investigated through hydrogen evolution reactions under UV-visible light irradiation. Photoluminescence, time-resolved photoluminescence, and photoelectrochemical studies have been carried out to see the role of the perovskite structure in influencing photocatalytic activity. To the best of our knowledge, there are no reports on a comparative study of the three kinds of structures on photocatalytic hydrogen evolution performance. However, there is one report25 where the ratio of Sr/Ti in SrTiO3 was varied and their photocatalytic HER was studied for different ratios from 1.00 to 1.25. The photocatalytic hydrogen evolution activity of these three perovskite oxides has been studied separately.26–28 In this study, we have tried to highlight that the choice of structure (crystallographic), amongst the cubic and layered perovskites (showcased here with the Sr–Ti–O system), could be an efficient way for the development of a catalyst for a hydrogen evolution reaction with improved performance.
m space group. The photocatalytic property of these nanostructured oxides is investigated through hydrogen evolution reactions under UV-visible light irradiation. Photoluminescence, time-resolved photoluminescence, and photoelectrochemical studies have been carried out to see the role of the perovskite structure in influencing photocatalytic activity. To the best of our knowledge, there are no reports on a comparative study of the three kinds of structures on photocatalytic hydrogen evolution performance. However, there is one report25 where the ratio of Sr/Ti in SrTiO3 was varied and their photocatalytic HER was studied for different ratios from 1.00 to 1.25. The photocatalytic hydrogen evolution activity of these three perovskite oxides has been studied separately.26–28 In this study, we have tried to highlight that the choice of structure (crystallographic), amongst the cubic and layered perovskites (showcased here with the Sr–Ti–O system), could be an efficient way for the development of a catalyst for a hydrogen evolution reaction with improved performance.
2. Experimental
2.1 Materials and methods
Strontium nitrate [(Sr(NO3)2), 99%], ethylene glycol (EG) (99%), methanol (ACS grade), citric acid anhydrous (98%), and sodium sulfate (99%) were purchased from Merck. Sodium sulfide flakes were purchased from CDH fine chemicals. Titanium tetraisopropoxide (TTIP) (97%) and sodium sulfite (98%) were purchased from Sigma-Aldrich.For the synthesis of SrTiO3, TTIP (12 mmol) was added to a mixture of ethylene glycol (25 mL) and methanol (10 mL). To this aqueous solution of citric acid in 5 mL water and solid Sr(NO3)2 (12 mmol) were added. The amount of citric acid taken was equivalent to that of TTIP. The resultant mixture was heated at 130 °C for 4 hours to form a single-phase transparent solution. Afterward, the pH of this solution was adjusted to 13 by adding 5 M NaOH (5 mL). The resulting solution was transferred into a Teflon vessel followed by hydrothermal treatment at 200 °C for 48 h. After the Teflon vessel was cooled down to room temperature, the obtained gel was vacuum dried at 200 °C for 16 h. The products were washed several times with glacial acetic acid (to remove carbonate present as an impurity in the sample), deionized (DI) water, and ethanol, and then dried overnight at 70 °C. SrTiO3 was finally synthesized by calcining the dried powder at 750 °C for 5 h.
For the synthesis of Sr2TiO4 and Sr3Ti2O7, the exact procedure was followed as for SrTiO3 except for the ratio of Sr and Ti precursor and heating temperature. For Sr2TiO4, the ratio of Sr and Ti precursor was kept at 2![[thin space (1/6-em)]](https://www.rsc.org/images/entities/char_2009.gif) :
:![[thin space (1/6-em)]](https://www.rsc.org/images/entities/char_2009.gif) 1 (12 mmol of Sr(NO3)2 and 6 mmol of TTIP) and calcined first at 650 °C and then at 1000 °C for 12 h, whereas for Sr3Ti2O7 the ratio was kept at 3
1 (12 mmol of Sr(NO3)2 and 6 mmol of TTIP) and calcined first at 650 °C and then at 1000 °C for 12 h, whereas for Sr3Ti2O7 the ratio was kept at 3![[thin space (1/6-em)]](https://www.rsc.org/images/entities/char_2009.gif) :
:![[thin space (1/6-em)]](https://www.rsc.org/images/entities/char_2009.gif) 2 (9 mmol of Sr(NO3)2 and 6 mmol of TTIP) and calcined first at 650 °C and then at 950 °C for 6 h.
2 (9 mmol of Sr(NO3)2 and 6 mmol of TTIP) and calcined first at 650 °C and then at 950 °C for 6 h.
2.2 Characterization
Phase identification and crystal structure of the samples were analyzed using powder X-ray diffraction (PXRD, Bruker D8 Advance Eco) with Cu Kα as an X-ray source (λ = 0.15406 nm). The step size of 0.02 with a time of 0.3 s per step was used for data collection. Crystallite size (Scherrer) was calculated using TOPAS v5 software by using the peak positioned at a two-theta value of 32.5°, 31.4°, and 46.6° for SrTiO3, Sr2TiO4, and Sr3Ti2O7 respectively. To obtain information about the morphology of the sample, transmission electron microscopy studies were carried out on a JEOL, JEM-2100 Transmission Electron Microscope (TEM), used at an operating voltage of 200 kV. The samples for the TEM study were prepared by dispersing the powder samples in ethanol and drop-casting them on a carbon-coated copper grid. Raman study was carried out on a WI Tec's Raman microscope, α 300 R. The studies were carried out on powder samples taken on a glass slide. Diffuse Reflectance Spectra were collected on a UV-visible spectrophotometer, Shimadzu UV-2600, in a wavelength range of 200–800 nm with barium sulfate as the reference material. Kubelka–Munk's (K–M) equation was used to calculate the bandgap of the materials from the reflectance spectra. XPS (X-Ray Photoelectron Spectroscopy) studies were carried out on a Thermo Scientific's K-alpha X-ray Photoelectron Spectrometer (XPS) System with the following settings: 0.05 eV step, 1 s time per step, and 5 cycles, Source Al k-alpha-1486 eV. The surface area of the samples was determined using nitrogen adsorption–desorption isotherms with Quanta Chrome Model Q2. Photoluminescence and time-resolved photoluminescence spectra were obtained from Horiba's TCSPC (Time Correlated Single Photon Counting) at an excitation wavelength of 380 nm and 340 nm respectively. Time-resolved photoluminescence decay curves were fitted by using a double logarithmic decay equation which is given below:| y = A1e(−x/τ1) + A2e(−x/τ2) + y0 | (1) |
 | (2) |
 | (3) |
Photoelectrochemical studies were performed on a PGSTAT-30 (Autolab) electrochemical workstation using a standard three-electrode system consisting of Ag/AgCl (3 M KCl) as the reference electrode, platinum wire as the counter electrode, and Sr–Ti–O samples deposited on a glass substrate coated with fluorine-doped tin oxide (FTO) as the working electrode. For the synthesis of the working electrode, the catalyst was drop cast on a glass substrate coated with FTO with an area of 1 cm × 1 cm. For the preparation of the catalyst ink, 10 mg of the catalyst was dispersed in 200 μL of isopropyl alcohol containing 10 μL of Nafion resin solution through the ultra-sonication method. Here, 0.1 M Na2SO4 (pH = 7) was taken as an electrolyte, and saturated with argon for 30 minutes to remove dissolved oxygen. A 350 W Xe lamp was used as the source of irradiation. LSV (linear sweep voltammetry) curves were obtained in the range from 0 to −1 V vs. Ag/AgCl at a scan rate of 10 mV s−1 under the light. Electrochemical impedance spectroscopy (EIS) was carried out at −0.35 V vs. Ag/AgCl in the frequency range from 0.1 Hz to 100 kHz under light.
3. Results and discussion
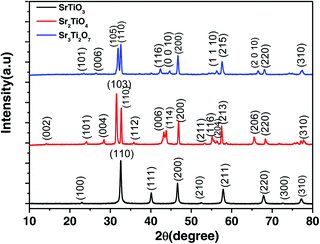
The powder X-ray diffraction (PXRD) pattern of the as-prepared nanostructured oxides is shown in Fig. 2. No impurity peaks were observed in the PXRD pattern indicating the formation of a single phase. The pattern for the perovskite SrTiO3 was indexed based on cubic symmetry (PDF 00-035-0734, space group, Pm![[3 with combining macron]](https://www.rsc.org/images/entities/char_0033_0304.gif) m). The other two Ruddlesden–Popper layered structures, Sr2TiO4 (n = 1) and Sr3Ti2O7 (n = 2) were indexed based on tetragonal symmetry with the space group, I4/mmm (JCPDF 00-039-1471 and JCPDF 01-078-2479 respectively). The crystallite sizes for all three oxides viz. SrTiO3, Sr2TiO4, and Sr3Ti2O7 were found to be 63 nm, 39 nm, and 42 nm respectively.
m). The other two Ruddlesden–Popper layered structures, Sr2TiO4 (n = 1) and Sr3Ti2O7 (n = 2) were indexed based on tetragonal symmetry with the space group, I4/mmm (JCPDF 00-039-1471 and JCPDF 01-078-2479 respectively). The crystallite sizes for all three oxides viz. SrTiO3, Sr2TiO4, and Sr3Ti2O7 were found to be 63 nm, 39 nm, and 42 nm respectively.
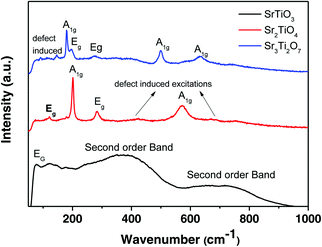
Raman spectra of the three nanostructured oxides i.e. SrTiO3, Sr2TiO4, and Sr3Ti2O7 are shown in Fig. 3. The Raman spectra obtained for the perovskite SrTiO3 matched well with the previous reports.29,30 The spectra consist of a low-frequency band present at 77 cm−1 which was assigned to doubly degenerate modes, Eg. Second order Raman bands were also observed between 200–400 cm−1 and 600–800 cm−1. No first-order bands were observed in the Raman spectra, as expected for the cubic structure. According to the report by Nilsen et al.29 second-order Raman scattering is due to the creation and destruction of two phonons which can originate from anywhere in the Brillouin zone. The authors observed a second-order band or overtone for SrTiO3 at 369 cm−1 which was attributed to the combination of various bands including the TO4–TA, TO4–TOl, and 2TO2 bands whereas the band at 684 cm−1 was assigned to the 2TO3 overtone. It has been previously reported31 that there are four Raman active modes, A1g, and Eg, observed for layered Ruddlesden–Popper oxides with n = 1, Sr2TiO4. The Raman bands present at 121, 203, 182, and 571 cm−1 were assigned to the Eg, A1g, Eg, and A1g modes respectively (Fig. 3). The broader band observed between 400–450 cm−1 and around 700 cm−1 indicates the presence of a second-order band or defect-induced excitations which may originate at the oxygen sublattice. The Raman spectra of Sr3Ti2O7 (Fig. 3) show bands at 178, 198, 274, 500, and 633 cm−1 which can be assigned to the A1g, Eg, Eg, A1g, and A1g modes respectively which is consistent with a previous report.32 A defect-induced excitation was also observed at 92 cm−1. The band corresponding to the A1g mode was observed to be more intense in both Sr2TiO4 and Sr3Ti2O7, which could be due to symmetric stretching of the oxygen lattice.33
The high resolution XPS spectra of strontium (Sr(3d), Fig. S1a–c, ESI†), oxygen (O(1s), Fig. S2a–c, ESI†) and titanium, (Ti(2p), Fig. S3a–c, ESI†), was obtained for SrTiO3 Sr2TiO4 and Sr3Ti2O7. Peaks at binding energies of 133.7 eV (135.5 eV), 133.9 eV (135.5 eV) and 133.6 eV (135.4 eV) were observed in the Sr 3d5/2 (3d3/2) spectra of SrTiO3 (Fig. S1a, ESI†), Sr2TiO4 (Fig. S1b, ESI†) and Sr3Ti2O7 (Fig. S1c, ESI†) respectively. Fig. S2a–c (ESI†) show the high-resolution O 1s spectra for SrTiO3, Sr2TiO4, and Sr3Ti2O7. The peaks were fitted with two Gaussian peaks with binding energies at 529.7 and 531.2 eV for SrTiO3, 529.3 and 531.4 eV for Sr2TiO4 and 529.8 and 531.77 eV for Sr3Ti2O7. The peak at lower energy can be attributed to the metal–oxygen bond i.e. the presence of O2− ions in the crystal structure whereas the peak at higher energy can be related to the oxygen vacancies. Fig. S3a–c (ESI†) shows the high-resolution spectra of Ti(2p) for SrTiO3, Sr2TiO4, and Sr3Ti2O7 respectively. The presence of Ti3+ was observed along with the Ti4+ ion after fitting of the peaks. The peaks centered at 458.3 eV (464.2 eV), 458.1 eV (453.8 eV) and 458.5 eV (464.1 eV) were observed for the Ti4+ 2p3/2 (2p1/2) spectra of SrTiO3, Sr2TiO4 and Sr3Ti2O7 respectively. Ti3+ 2p3/2 (2p1/2) spectra of SrTiO3, Sr2TiO4 and Sr3Ti2O7 were obtained at 456.4 eV (462.8 eV), 456.8 eV (462.1 eV) and 456.6 eV (461.9 eV) respectively. Thus the presence of peaks corresponding to Ti3+ also confirms the presence of an oxygen vacancy in the lattice. Based on the area under the peak, the order for the ratio of oxygen vacancies![[thin space (1/6-em)]](https://www.rsc.org/images/entities/char_2009.gif) :
:![[thin space (1/6-em)]](https://www.rsc.org/images/entities/char_2009.gif) M–O and Ti3+:Ti4+ was found to be Sr2TiO4 > Sr3Ti2O7 > SrTiO3.
M–O and Ti3+:Ti4+ was found to be Sr2TiO4 > Sr3Ti2O7 > SrTiO3.
TEM studies for SrTiO3 showed nanocubes with a size of 80–100 nm (Fig. 4a). The HRTEM image (Fig. 4b) shows lattice fringes with a spacing of 0.281 nm, corresponding to the (110) plane. A rectangular sheet-like morphology was observed for both Ruddlesden–Popper based oxides i.e. Sr2TiO4 (Fig. 4c) and Sr3Ti2O7 (Fig. 4e). The size along one dimension of these sheets was observed to be ∼250 nm and ∼350 nm for Sr2TiO4 and Sr3Ti2O7 respectively. The lattice fringes corresponding to a spacing of 0.276 nm for Sr2TiO4 (Fig. 4d) and 0.273 nm for Sr3Ti2O7 (Fig. 4f) were observed which corresponded to the (110) plane. The BET surface area of all the samples viz. SrTiO3, Sr2TiO4, and Sr3Ti2O7 were observed to be 15 m2 g−1, 6.2 m2 g−1, and 14 m2 g−1 respectively.
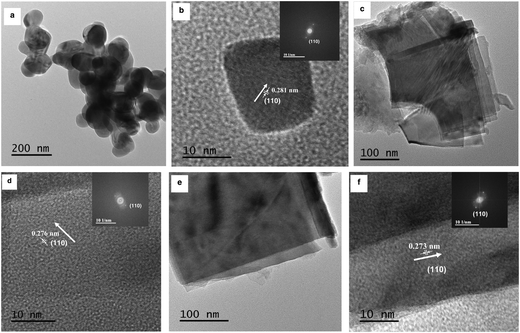 | ||
| Fig. 4 TEM images of (a) SrTiO3, (c) Sr2TiO4, and (e) Sr3Ti2O7. HRTEM images of (b) SrTiO3, (d) Sr2TiO4, and (f) Sr3Ti2O7. The inset shows the corresponding reduced FFT of the HRTEM image. | ||
The bandgap of the oxides was calculated using the Tauc equation (eqn (4)).
 | (4) |
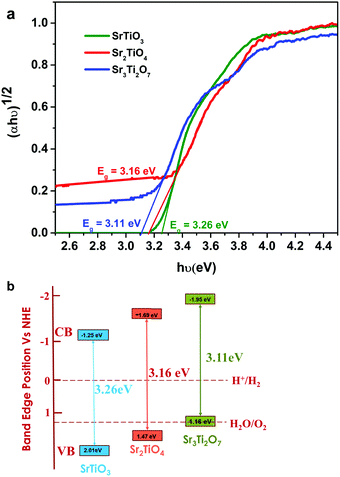 | ||
| Fig. 5 (a) Tauc plot and (b) schematic showcasing the energy diagram for SrTiO3, Sr2TiO4, and Sr3Ti2O7. | ||
3.1 Photocatalytic H2 evolution
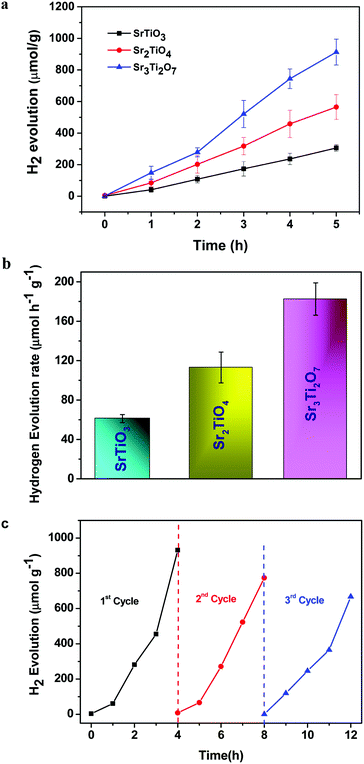
The photocatalytic hydrogen evolution of nanostructured SrTiO3 and SrO(SrTiO3)n (n = 1 and 2) was studied by observing the amount of hydrogen evolved from an aqueous solution containing 0.25 M Na2S and 0.35 M Na2SO3 (used as the hole-scavenger). The study was carried out in the absence of any metal co-catalyst to see the direct influence of the nature of the crystal structure on the photocatalytic performance of Sr–Ti–O based perovskites and Ruddlesden–Popper based oxides. At first, the experiments were carried out under dark conditions. No H2 gas was observed in the absence of light. Temporal hydrogen evolution under light is shown in Fig. 6a and b. It was observed that the amount of H2 evolved follows the order Sr3Ti2O7 > Sr2TiO4 > SrTiO3. Apparent quantum yield was calculated using eqn (3). The quantum yield obtained has been tabulated in Table 1. The recyclability test was performed on Sr3Ti2O7 (exhibiting the evolution of the highest amount of hydrogen amongst the three oxides) to check its reusability. The recyclability test was examined for 12 h and each experimental cycle was carried out for 4 h (Fig. 6c). The oxide was centrifuged and washed with water between each cycle. A slight decrease in the rate of H2 evolution was observed for three cycles. The stability of the catalyst was checked after the recyclability test of 12 h through PXRD (Fig. S5, ESI†). It was observed that the crystal structure of the catalyst remained unchanged after reusability. No additional peaks corresponding to any impurity were observed suggesting that the oxide was stable after 12 h.| Sample | n (amount of hydrogen gas evolved after 5 h of the reaction) (mol) | Apparent quantum yield (AQY) (%) |
|---|---|---|
| SrTiO3 | 12.23 × 10⁻⁶ | 0.018 |
| Sr2TiO4 (SrO(SrTiO3)) | 22.6 × 10⁻⁶ | 0.03 |
| Sr3Ti2O7 (SrO(SrTiO3)2) | 36.5 × 10⁻⁶ | 0.058 |
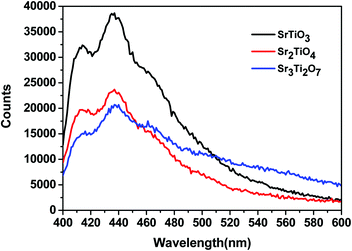
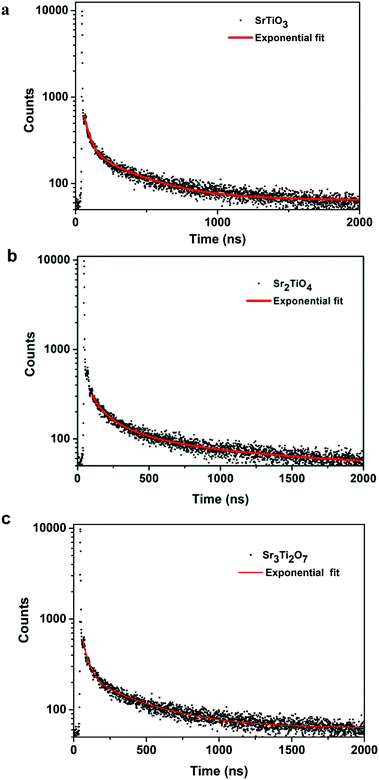
To ascertain the reason for the observed trend for the photocatalytic hydrogen evolution, photoluminescence (PL) and time-resolved photoluminescence studies were carried out for the three oxides. Fig. 7 shows the photoluminescence spectra for all the samples. Here, the samples were excited at a wavelength of 380 nm, and the emission spectra were recorded in the range of 395–700 nm. All the samples showed PL emission in the violet-blue region with a peak centered at 414 nm and 436 nm. It has been reported37 that the photoluminescence for SrTiO3 based oxides arises mostly due to a recombination of the electrons and holes that are trapped in the intermediate states (present within the bandgap). These intermediate states arise as a result of distortion, oxygen vacancies, etc. It has also been reported37 that the emission in the violet-blue region occurs due to the presence of a surface or shallow defects which may arise due to oxygen vacancies. Oxygen vacancies are also known to affect the catalytic behavior of oxides.5,38 The presence of a controlled concentration of defects (oxygen vacancies) is known to increase the photocatalytic efficiency of SrTiO3 towards hydrogen evolution.39 The oxygen vacancies act as electron donors which either result in an increased charge transport or a shift in the Fermi level towards the conduction band.39 Such a phenomenon is likely to improve the charge separation behavior of the oxide. In our studies, the presence of defect/oxygen vacancies was also confirmed by Raman and XPS studies. In addition to the presence of defects, it was also observed that the PL emission, corresponding to the defect, decreased in the following order SrTiO3 > Sr2TiO4 > Sr3Ti2O7. With the same excitation energy and no significant changes in the optical bandgap of the oxides, the decrease in the PL emission can be related to a decrease in the recombination of electron and hole pairs giving rise to radiative emission. To further investigate the lifetime of photo-induced charge carriers, time-resolved photoluminescence decay spectra were recorded. The data was fitted using eqn (1) and the average lifetime (τavg) was calculated using eqn (2). Fig. 8a–c show the second exponential decay fit of the time-resolved PL of the three oxides. The parameters obtained after fitting are listed in Table 2. The average lifetime was found to follow the order Sr3Ti2O7 > Sr2TiO4 > SrTiO3, for the Sr–Ti–O system. From the values obtained for τavg (ns), it can be concluded that the recombination of photo-induced charge carriers is delayed for Ruddlesden–Popper based oxides (Sr2TiO4 and Sr3Ti2O7) compared with SrTiO3. The longer lifetime implies that a large number of photo-induced electrons could reach the surface of the catalysts which would be captured by the H+ ions. Thus, the longer lifetime of the photo-induced charge carriers for Sr3Ti2O7 further supports the increased photocatalytic properties of Sr3Ti2O7. The presence of interlayers (SrO layer in our study) results in a reduction of the recombination of photogenerated charge carriers by separation of the electrons and holes thereby enhancing the photocatalytic water splitting reaction.40
| Sample | A 1 | τ 1 (ns) | A 2 | τ 2 (ns) | Average lifetime τavg (ns) |
|---|---|---|---|---|---|
| SrTiO3 | 1800 | 37.7 ± 1.0 | 213 | 351 ± 8.6 | 202 |
| Sr2TiO4 | 1646 | 38.0 ± 1.2 | 198 | 367 ± 8.8 | 215 |
| Sr3Ti2O7 | 1619 | 40.3 ± 1.0 | 194 | 392 ± 10 | 230 |
To further evaluate the charge transfer behavior of the three oxides in the presence of light, photoelectrochemical studies were carried out. The photocurrent density (Fig. 9a) was found to be the highest for Sr3Ti2O7. The onset potential was observed to be ∼−0.40 V vs. Ag/AgCl, which is nearly the same for all three samples. The overpotential for the hydrogen evolution reaction (HER) for the three oxides was evaluated from the current–voltage curve at −0.1 mA cm−2vs. Ag/AgCl (Fig. 9b). The overpotential was found to follow the order SrTiO3 > Sr2TiO4 > Sr3Ti2O7 for the Sr–Ti–O system. Fig. 9c shows Nyquist plots for the three oxides. Based on Rct (charge transfer resistance), Rs (solution resistance), and a constant phase element with impedance, which is related to the angular frequency of the applied potential, ω (using eqn (5)),
 | (5) |
 , the curve was fit to an equivalent circuit, shown in the inset of Fig. 9c. The parameters obtained after the fitting are tabulated in Table 3. The charge transfer resistance originating as a result of the ionic and electronic resistance across the electrode–electrolyte interface, Rct, were observed to follow the order: Sr3Ti2O7 < Sr2TiO4 < SrTiO3. Mott–Schottky studies in the presence of light (Fig. 9d) were carried out to calculate the charge carrier density using the following equation:
 | (6) |
 | (7) |
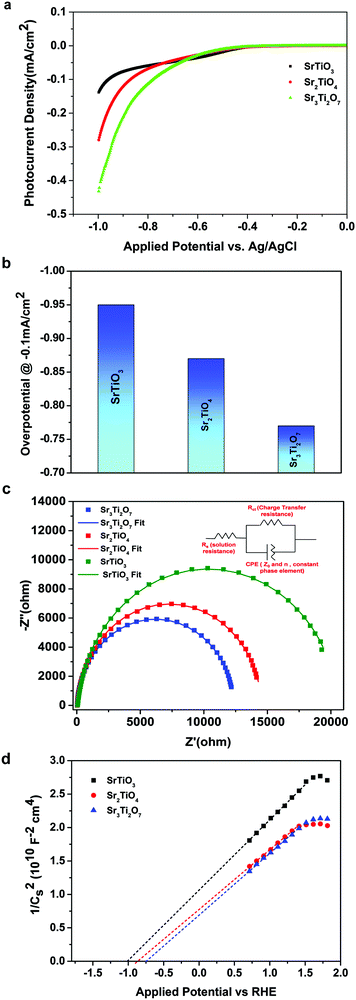 | ||
| Fig. 9 (a) Photocurrent density, (b) overpotential, (c) Nyquist plot and (d) Mott–Schottky plot for SrTiO3, Sr2TiO4, and Sr3Ti2O7. | ||
| Sample | R ct (kΩ) | R s (Ω) | CPE (μmho) | n (in constant phase element) |
|---|---|---|---|---|
| SrTiO3 | 20.6 | 36.5 | 16.0 | 0.940 |
| Sr2TiO4 | 14.5 | 28.4 | 12.5 | 0.973 |
| Sr3Ti2O7 | 12.3 | 26.5 | 12.1 | 0.974 |
Thus, from the trend observed for the photocatalytic hydrogen evolution there are a few interesting observations. One, the photocatalytic hydrogen evolution increases with the introduction of the SrO layer i.e. when comparing SrTiO3 with Sr2TiO4 (SrO(SrTiO3)). The SrO layer in Ruddlesden–Popper based layered perovskites44 is responsible for the dissociation of water. The oxygen site (apical oxygen) in SrTiO3 of Ruddlesden–Popper based layered perovskites favors the adsorption of hydrogen enabling its recombination with other adsorbed hydrogen to form H2. Wei et al.45 also observed that insertion of the SrO layer in SrTaO2N to form Sr2TaO3N (a Ruddlesden–Popper based oxynitride) resulting in the improved photocatalytic performance of the oxynitride. Second, with the increase in the SrTiO3 perovskite unit in Ruddlesden–Popper based layered perovskites i.e. on comparing Sr2TiO4 and Sr3Ti2O7, the photocatalytic activity was found to increase for Sr3Ti2O7. For photocatalytic water splitting, the active sites in Ruddlesden–Popper based layered perovskites are the B-site cations (Ti in Sr–Ti–O based systems), AO layers (SrO layer in Sr–Ti–O based systems), and defects arising due to oxygen vacancies. This arrangement of layers is known to suppress the charge carrier recombination, as evident from time-resolved photoluminescence studies, and promote charge carrier transfer, as evident from a decrease in charge transfer resistance.
Based on the study, it is also to be noted there are two important synergistic factors that affect the photocatalytic behavior of the oxides: (a) crystal structure and the arrangement of atoms, and (b) the presence of defects (oxygen vacancies). Thus, synergism in the role of the SrO layer and the SrTiO3 perovskite unit along with the layered morphology, low crystallite size, and presence of defects (oxygen vacancies), is presumed to have resulted in an improved photocatalytic performance for Ruddlesden–Popper based layered perovskite. This improved performance was evident from the reduced overpotential, low charge transfer resistance, and high charge carrier density for Ruddlesden–Popper based layered perovskites. Hence, the appropriate choice of the crystal structure from a series could result in attaining the desired factors required for designing an efficient catalyst for photocatalytic HER.
4. Conclusions
We have successfully synthesized three members of the Sr–Ti–O system viz. SrTiO3, Sr2TiO4, and Sr3Ti2O7 using the combination of a polymeric citrate precursor and a hydrothermal method. SrTiO3 was observed to crystallize into a cubic structure and possessed cube-like morphology. Sr2TiO4 and Sr3Ti2O7 were found to crystallize in a tetragonal crystal structure. Sheet-like morphology was observed for these two oxides. We have demonstrated photocatalytic hydrogen evolution activity for these three nanostructured oxides. All three structures were found to be active photocatalysts under a full range of light irradiation and in the absence of any co-catalyst. We observed that the nanocubes of SrTiO3 (perovskite cubic crystal structure) were less active for the photocatalytic HER than layered Sr2TiO4 and Sr3Ti2O7 (tetragonal, Ruddlesden–popper structure). Synergism of many factors which included the presence of a SrO layer, SrTiO3 unit, layered morphology, low crystallite size, and defects is attributed to the observed photocatalytic performance of the Ruddlesden–popper structure in comparison to cubic perovskite SrTiO3. Thus, the findings in our study highlight the influence of the Ruddlesden–Popper crystal structure on the hydrogen evolution efficiency of perovskite oxides. The study opens a strategic approach based on choosing the crystal structure while designing highly efficient catalysts.Conflicts of interest
There are no conflicts of interest to declare.Acknowledgements
A. V. thanks INST, Mohali for the fellowship. SV thanks CSIR (01(2943)/18-EMR-II), Govt. of India for funding.References
- K. Maeda, K. Teramura, D. Lu, T. Takata, N. Saito, Y. Inoue and K. Domen, Nature, 2006, 440, 295 CrossRef CAS PubMed.
- H. Tong, S. Ouyang, Y. Bi, N. Umezawa, M. Oshikiri and J. Ye, Adv. Mater., 2012, 24, 229–251 CrossRef CAS PubMed.
- Y.-F. Li, Z.-P. Liu, L. Liu and W. Gao, J. Am. Chem. Soc., 2010, 132, 13008–13015 CrossRef CAS.
- S. Ouyang and J. Ye, J. Am. Chem. Soc., 2011, 133, 7757–7763 CrossRef CAS PubMed.
- A. Kumar and V. Krishnan, Adv. Funct. Mater., 2021, 31, 2009807 CrossRef CAS.
- N. M. Flores, U. Pal, R. Galeazzi and A. Sandoval, RSC Adv., 2014, 4, 41099–41110 RSC.
- L. Zhang, T. Xu, X. Zhao and Y. Zhu, Appl. Catal., B, 2010, 98, 138–146 CrossRef CAS.
- Y. Liu, B. Huang, Y. Dai, X. Zhang, X. Qin, M. Jiang and M.-H. Whangbo, Catal. Commun., 2009, 11, 210–213 CrossRef CAS.
- S. Ouyang, N. Kikugawa, D. Chen, Z. Zou and J. Ye, J. Phys. Chem. C, 2009, 113, 1560–1566 CrossRef CAS.
- T. A. Kandiel, A. Feldhoff, L. Robben, R. Dillert and D. W. Bahnemann, Chem. Mater., 2010, 22, 2050–2060 CrossRef CAS.
- T. Li, H. Cai, C. Li, X. Liu and F. Huang, Front. Chem., 2020, 8, 351 CrossRef CAS PubMed.
- S. Chen, D. Huang, P. Xu, W. Xue, L. Lei, M. Cheng, R. Wang, X. Liu and R. Deng, J. Mater. Chem. A, 2020, 8, 2286–2322 RSC.
- J. Cai, A. Cao, Z. Wang, S. Lu, Z. Jiang, X.-Y. Dong, X. Li and S.-Q. Zang, J. Mater. Chem. A, 2021, 9, 13890–13897 RSC.
- S. Kumar, A. Kumar, A. Kumar and V. Krishnan, Catal. Rev., 2020, 62, 346–405 CrossRef CAS.
- H. Mai, D. Chen, Y. Tachibana, H. Suzuki, R. Abe and R. A. Caruso, Chem. Soc. Rev., 2021, 50, 13692–13729 RSC.
- G. Zhang, G. Liu, L. Wang and J. T. S. Irvine, Chem. Soc. Rev., 2016, 45, 5951–5984 RSC.
- A. Kumar, A. Kumar and V. Krishnan, ACS Catal., 2020, 10, 10253–10315 CrossRef CAS.
- T. Kimijima, K. Kanie, M. Nakaya and A. Muramatsu, Appl. Catal., B, 2014, 144, 462–467 CrossRef CAS.
- P.-L. Hsieh, G. Naresh, Y.-S. Huang, C.-W. Tsao, Y.-J. Hsu, L.-J. Chen and M. H. Huang, J. Phys. Chem. C, 2019, 123, 13664–13671 CrossRef CAS.
- A. Vijay and S. Vaidya, ACS Appl. Nano Mater., 2021, 4, 3406–3415 CrossRef CAS.
- T. Oshima, T. Yokoi, M. Eguchi and K. Maeda, Dalton Trans., 2017, 46, 10594–10601 RSC.
- K.-i Shimizu, Y. Tsuji, T. Hatamachi, K. Toda, T. Kodama, M. Sato and Y. Kitayama, Phys. Chem. Chem. Phys., 2004, 6, 1064–1069 RSC.
- X. Sun, Y. Xie, F. Wu, H. Chen, M. Lv, S. Ni, G. Liu and X. Xu, Inorg. Chem., 2015, 54, 7445–7453 CrossRef CAS PubMed.
- H. Zhang, S. Ni, Y. Mi and X. Xu, J. Catal., 2018, 359, 112–121 CrossRef CAS.
- K. Yamada, H. Suzuki, R. Abe and A. Saeki, J. Phys. Chem. Lett., 2019, 10, 1986–1991 CrossRef CAS.
- H. Jeong, T. Kim, D. Kim and K. Kim, Int. J. Hydrogen Energy, 2006, 31, 1142–1146 CrossRef CAS.
- X. Sun, Y. Xie, F. Wu, H. Chen, M. Lv, S. Ni, G. Liu and X. Xu, Inorg. Chem., 2015, 54, 7445–7453 CrossRef CAS PubMed.
- Y. Liu, L. Xie, Y. Li, R. Yang, J. Qu, Y. Li and X. Li, J. Power Sources, 2008, 183, 701–707 CrossRef CAS.
- W. G. Nilsen and J. G. Skinner, J. Chem. Phys., 1968, 48, 2240–2248 CrossRef CAS.
- S. Banerjee, D.-I. Kim, R. D. Robinson, I. P. Herman, Y. Mao and S. S. Wong, Appl. Phys. Lett., 2006, 89, 223130 CrossRef.
- R. Viennois, P. Hermet, D. Machon, M. M. Koza, D. Bourgogne, B. Fraisse, A. P. Petrović and D. Maurin, J. Phys. Chem. C, 2020, 124, 27882–27893 CrossRef CAS.
- A. Dias, J. I. Viegas and R. L. Moreira, J. Alloys Compd., 2017, 725, 77–83 CrossRef CAS.
- S. Kamba, P. Samoukhina, F. Kadlec, J. Pokorný, J. Petzelt, I. M. Reaney and P. L. Wise, J. Eur. Ceram. Soc., 2003, 23, 2639–2645 CrossRef CAS.
- C.-H. Lee, N. J. Podraza, Y. Zhu, R. F. Berger, S. Shen, M. Sestak, R. W. Collins, L. F. Kourkoutis, J. A. Mundy, H. Wang, Q. Mao, X. Xi, L. J. Brillson, J. B. Neaton, D. A. Muller and D. G. Schlom, Appl. Phys. Lett., 2013, 102, 122901 CrossRef.
- A. Chen, X. Zhang, Z. Zhang, S. Yao and Z. Zhou, J. Mater. Chem. A, 2019, 7, 11530–11536 RSC.
- H. Chen and X. Xu, Appl. Catal., B, 2017, 206, 35–43 CrossRef CAS.
- A. E. Souza, G. T. A. Santos, B. C. Barra, W. D. Macedo, S. R. Teixeira, C. M. Santos, A. M. O. R. Senos, L. Amaral and E. Longo, Cryst. Growth Des., 2012, 12, 5671–5679 CrossRef CAS.
- T. Zheng, W. Sang, Z. He, Q. Wei, B. Chen, H. Li, C. Cao, R. Huang, X. Yan, B. Pan, S. Zhou and J. Zeng, Nano Lett., 2017, 17, 7968–7973 CrossRef CAS.
- H. Tan, Z. Zhao, W.-B. Zhu, E. N. Coker, B. Li, M. Zheng, W. Yu, H. Fan and Z. Sun, ACS Appl. Mater. Interfaces, 2014, 6, 19184–19190 CrossRef CAS PubMed.
- Z. Liang, K. Tang, Q. Shao, G. Li, S. Zeng and H. Zheng, J. Solid State Chem., 2008, 181, 964–970 CrossRef CAS.
- W. Kwestroo and H. A. M. Paping, J. Am. Ceram. Soc., 1959, 42, 292–299 CrossRef CAS.
- P. Calvani, M. Capizzi, F. Donato, S. Lupi, P. Maselli and D. Peschiaroli, Phys. Rev. B: Condens. Matter Mater. Phys., 1993, 47, 8917–8922 CrossRef CAS.
- O. N. Tufte and P. W. Chapman, Phys. Rev., 1967, 155, 796–802 CrossRef CAS.
- Y. Zhu, H. A. Tahini, Z. Hu, J. Dai, Y. Chen, H. Sun, W. Zhou, M. Liu, S. C. Smith, H. Wang and Z. Shao, Nat. Commun., 2019, 10, 149 CrossRef PubMed.
- S. Wei and X. Xu, Appl. Catal., B, 2018, 228, 10–18 CrossRef CAS.
Footnote |
| † Electronic supplementary information (ESI) available. See DOI: https://doi.org/10.1039/d2ma00097k |
| This journal is © The Royal Society of Chemistry 2022 |

