 Open Access Article
Creative Commons Attribution 3.0 Unported Licence
Pressure effect on long-term heat storage ceramics based on Mg-substituted λ-Ti3O5†
Shin-ichi
Ohkoshi
 *a,
Fangda
Jia
a,
Marie
Yoshikiyo
 a,
Kenta
Imoto
 a,
Hiroko
Tokoro
 ab,
Kosuke
Nakagawa
 a,
Yuta
Maeno
a,
Asuka
Namai
a,
Yuta
Maeno
a,
Asuka
Namai
 a,
Risa
Harada
c,
Kenji
Hattori
c,
Kunihiro
Kojima
c,
Kei
Sugiura
c and
Takatoshi
Suganuma
c
aDepartment of Chemistry, School of Science, The University of Tokyo, 7-3-1 Hongo, Bunkyo-ku, Tokyo, 113-0033, Japan. E-mail: ohkoshi@chem.s.u-tokyo.ac.jp
bDivision of Materials Science, Faculty of Pure and Applied Sciences, University of Tsukuba, 1-1-1 Tennodai, Tsukuba, Ibaraki 305-8577, Japan
cDENSO CORPORATION, 1-1 Showa-cho, Kariya, Aichi 448-8661, Japan
First published on 4th May 2022
Abstract
Waste heat energy could be effectively used if the accumulated thermal energy could be conserved. However, neither typical sensible heat-storage materials such as brick and concrete nor latent heat-storage materials such as water and polyethylene glycol can store energy for a prolonged period. Herein we report a heat-storage material, which is a ceramic that exhibits long-term storage of latent heat and release of the heat by applying pressure. This material is Mg-substituted lambda-trititanium-pentoxide (λ-MgxTi3−xO5 where 0 < x ≤ 0.053). λ-MgxTi3−xO5 shows a phase transition to Mg-substituted beta-trititanium-pentoxide (β-MgxTi3−xO5) by pressure application. Mg cation substitution can control the temperature of the heat storage originating from the β- to λ-phase transition from 196 °C (469 K) for x = 0 to 80 °C (353 K) for x = 0.053. This phase transition temperature range is suitable for heat storage from industrial waste and thermal power plants. The accumulated heat energy is maintained at a large value of 215–227 kJ L−1 in the range of 0 < x ≤ 0.053. Such an eco-friendly and pressure-responsive heat-storage ceramic, which can preserve the latent heat energy for a prolonged period, is effective for the sustainable reuse of heat energy that has been wasted in industrial facilities and factories.
Introduction
Global warming, which is a global temperature increase due to the rise of the CO2 concentration in the atmosphere, has become an urgent problem. Green innovations, which are technologies to solve this problem, are very important for better management of the Earth for the next generation of human beings. From the perspective of an energy problem, producing nature-friendly energy is important while simultaneously reusing generated energy effectively.1–4 Currently, about 40% of consumed energy such as oil, gas, and coal is lost to the atmosphere as waste heat. Among the wasted heat energy, about 80% is below 200 °C (473 K). Additionally, waste heat negatively affects the environment.5,6 Therefore, the development of high-performance heat-storage materials should be an effective solution.7,8Known heat-storage materials include sensible ones such as bricks and concrete, and solid–liquid latent ones such as water, paraffin, and polyethylene glycol.9–12 In general heat-storage materials, the accumulated heat energy is released over time. Consequently, they are unsuitable for long-term storage of the accumulated heat energy. This issue is called the “time-gap problem” in the field of heat-storage materials. If the accumulated heat energy can be stored for a long period of time and released on demand, various applications should be possible.
Recently, a new concept of “long-term heat-storage ceramics” has been proposed, in which latent heat is preserved until a material is triggered by external stimuli.13 An example is lambda-trititanium-pentoxide (λ-Ti3O5), which shows a reversible phase transition to beta-trititanium-pentoxide (β-Ti3O5) by external stimuli such as light, heat, and pressure.13–19 Moreover, solid–solid phase transition materials such as charge transfer phase transition materials,20–26 spin crossover transition materials,27–40 and metal insulator phase transition materials,14,41,42 may also be good candidates for long-term heat storage materials. In this study, we synthesize a long-term heat-storage material based on magnesium-substituted lambda-trititanium-pentoxide, λ-MgxTi3−xO5. Synthesis of λ-MgxTi3−xO5 was first reported by our group in 2017.18 Then, the temperature-induced phase transition from λ- to α-MgxTi3−xO5 was reported.19 However, the pressure-induced phase transition of λ-MgxTi3−xO5 and its heat-storage performance have yet to be explored. Pressure-induced phase transition effect43–48 is considered to be an essential approach for energy release because pressure applications are useful for extracting accumulated heat energy. Herein we report the crystal structure and morphology, heat-storage temperature, accumulated heat energy, pressure-responsive heat-energy release, and theoretical analyses of the heat-storage performance of λ-MgxTi3−xO5 based on a thermodynamic theory.
Results and discussion
Materials
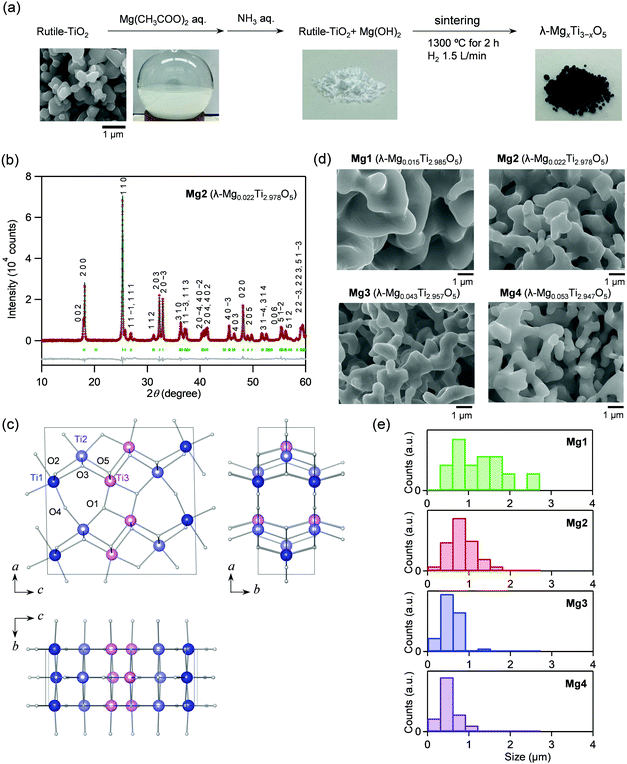
Mg-Substituted λ-Ti3O5 was synthesized by the following process. First, the Mg ion-covered TiO2 precursor was prepared by adding an ammonia aqueous solution to a mixed solution of a rutile-TiO2 particle dispersion and a magnesium acetate aqueous solution. The precursor was sintered at 1300 °C under a hydrogen atmosphere (Fig. 1a). Four samples were synthesized with different Mg feed ratios and sintering times at 1300 °C: Mg1 ([Mg]/[Mg + Ti] = 1.5%, sintering time = 6 hours), Mg2 (1.5%, 2 hours), Mg3 (3.0%, 6 hours), and Mg4 (4.0%, 6 hours). Elemental analyses were performed using X-ray fluorescence (XRF). The sample formulas are Mg0.015Ti2.985O5 (Mg1), Mg0.022Ti2.978O5 (Mg2), Mg0.043Ti2.957O5 (Mg3), and Mg0.053Ti2.947O5 (Mg4).Crystal structure and morphology
Fig. 1b shows the powder X-ray diffraction (PXRD) pattern with Rietveld analysis of Mg2, while those of the other samples are shown in Fig. S1 (ESI†). Mg1–Mg4 consist of 100% of the λ-phase. The lattice parameters of the λ-phase are: Mg1: a = 9.8286(9) Å, b = 3.7875(2) Å, c = 9.9676(9) Å, and β = 91.173(4)°; Mg2: a = 9.8357(2) Å, b = 3.78584(4) Å, c = 9.9712(2) Å, and β = 91.1946(11)°; Mg3: a = 9.8284(4) Å, b = 3.78733(8) Å, c = 9.9709(3) Å, and β = 91.094(2)°; Mg4: a = 9.8155(3) Å, b = 3.78565(6) Å, c = 9.9680(2) Å, and β = 90.950(2)° (Table S1, ESI†). As a representative, the crystal structure of Mg2 is shown in Fig. 1c.The morphologies of the samples were investigated by scanning electron microscopy (SEM). All samples have coral-shaped morphologies, and the diameters of the coral-structure are 0.5–2.5 μm (Mg1), 0.2–1.6 μm (Mg2), 0.2–1.5 μm (Mg3), and 0.1–1.0 μm (Mg4) (Fig. 1d). Mg substitution gradually reduces the thickness of the coral. The diameter of Mg4 is about half that of Mg1 (Fig. 1e).
Pressure-induced phase transition and released heat energy
After applying an external pressure (P) of P = 2.5, 5, 7.5, 10, 12.5, 15, 30, 45, 60, 230, 600 MPa, or 2 GPa, the pressure was released and PXRD patterns were measured. The transition pressure (P1/2), at which the λ- and β-phase fractions are equal, is low for Mg1 (79 MPa). By contrast, P1/2 is 450 MPa (Mg2), 700 MPa (Mg3), and over 2 GPa (Mg4) (Fig. 2).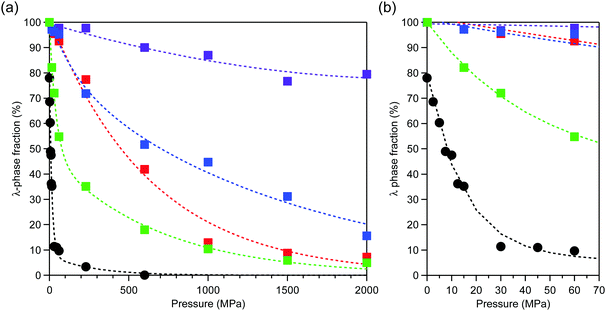 | ||
| Fig. 2 (a) Pressure dependence of the λ-phase fractions of λ-MgxTi3−xO5 for Mg1 (green), Mg2 (red), Mg3 (blue), Mg4 (purple), and block-type λ-Ti3O5 (black, adapted from ref. 15). (b) Enlarged plot in the low pressure region. Dashed lines are to guide the eye. | ||
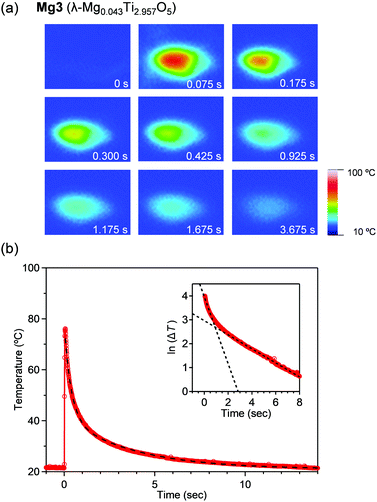
To visually measure the released heat energy at the pressure-induced phase transition, the temperature changes of the samples were measured via thermography (Fig. 3). The thermographic image is blue prior to applying pressure. The white or red point corresponds to the position pressed by applying instant pressure with a hammer. Afterward, the maximum temperature reaches 89.8 °C, 79.1 °C, 76.1 °C, and 66.8 °C for Mg1–Mg4, respectively within 75 ms (Fig. 3b and Fig. S2, ESI†). The released heat energies were evaluated under adiabatic conditions. The released heat energies are: 203 kJ L−1 (Mg1), 177 kJ L−1 (Mg2), 167 kJ L−1 (Mg3), and 142 kJ L−1 (Mg4).
Fig. 3b shows the temperature change of the pressurized point. Heat release occurs immediately after applying pressure. A double exponential function, ΔT = A1![[thin space (1/6-em)]](https://www.rsc.org/images/entities/char_2009.gif) exp(−t/τ1) + A2
exp(−t/τ1) + A2![[thin space (1/6-em)]](https://www.rsc.org/images/entities/char_2009.gif) exp(−t/τ2), was fitted to the decay curves. Here, ΔT is the temperature change, t is time, τ1 and τ2 are decay times, and A1 and A2 are constants. The decay times are (τ1, τ2) = (0.2, 1.7), (0.5, 3.1), (0.4, 3.8), and (0.5, 2.9) seconds for Mg1–Mg4, respectively. A pressure-sensitive sheet suggests that the applied pressure is ca. 50 MPa. τ1 is attributed to the thermal relaxation of the sample, while τ2 is due to the thermal relaxation of acryl substrate.
exp(−t/τ2), was fitted to the decay curves. Here, ΔT is the temperature change, t is time, τ1 and τ2 are decay times, and A1 and A2 are constants. The decay times are (τ1, τ2) = (0.2, 1.7), (0.5, 3.1), (0.4, 3.8), and (0.5, 2.9) seconds for Mg1–Mg4, respectively. A pressure-sensitive sheet suggests that the applied pressure is ca. 50 MPa. τ1 is attributed to the thermal relaxation of the sample, while τ2 is due to the thermal relaxation of acryl substrate.
Accumulated heat energy and temperature
Heat accumulation temperatures and the accumulated heat energies were measured for the pressure-produced β-phase using differential scanning calorimetry (DSC). All samples display endothermic peaks during the transition from the β-phase to the λ-phase. The DSC curves show endothermic peaks at heat storage temperatures (Tβ→λ) of 178 °C (451 K), 160 °C (433 K), 108 °C (381 K), and 80 °C (353 K) for Mg1–Mg4, respectively (Fig. 4a and b). The transition enthalpy values (ΔHβ→λ) obtained from the area of the endothermic peaks are 227 kJ L−1, 223 kJ L−1, 215 kJ L−1, and 216 kJ L−1, respectively (Fig. 4c). Substitution with Mg cations decreases the Tp value from 198 °C (x = 0) to 80 °C (x = 0.053). On the other hand, exothermic peaks are not observed, indicating that the λ-phase is maintained in the cooling process.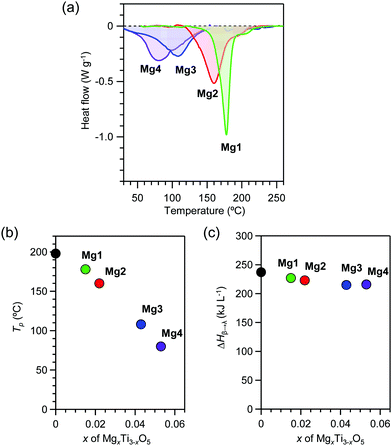 | ||
| Fig. 4 Heat-storage properties of λ-MgxTi3−xO5. (a) DSC charts of Mg1 (green), Mg2 (red), Mg3 (blue), and Mg4 (purple) as the temperature increases. (b) x-Value dependence of the transition temperature. (c) x-Value dependence of the transition enthalpy. Black circle represents block-type λ-Ti3O5 (adapted from ref. 15). | ||
To verify the phase transition from pressure-produced β-phase to λ-phase, variable-temperature PXRD (VT-PXRD) measurements were conducted for Mg3 and Mg4. In the heating process of Mg3, the intensity of the (2 0 4) peak due to the β-phase starts to decrease at 60 °C, drastically changes around 100 °C, and reaches a minimum at 160 °C (Fig. S3, ESI†). The differential of the (2 0 4) peak intensity versus temperature plot shows a peak at 103 °C with a full width at half maximum of 47 °C. In Mg4, the PXRD intensity of the (204) peak starts to decrease around 30 °C, changes largely around 75 °C, and reaches a minimum around 180 °C (Fig. S4, ESI†). The differential of the (204) peak intensity versus temperature plot shows a peak at 77 °C with a full width at half maximum of 87 °C. These results correspond to the endothermic peaks of Mg3 and Mg4 in the DSC measurements. These phase transition temperatures almost correspond to the previously reported values.18,19
Appearance of the thermal hysteresis loop on phase transition
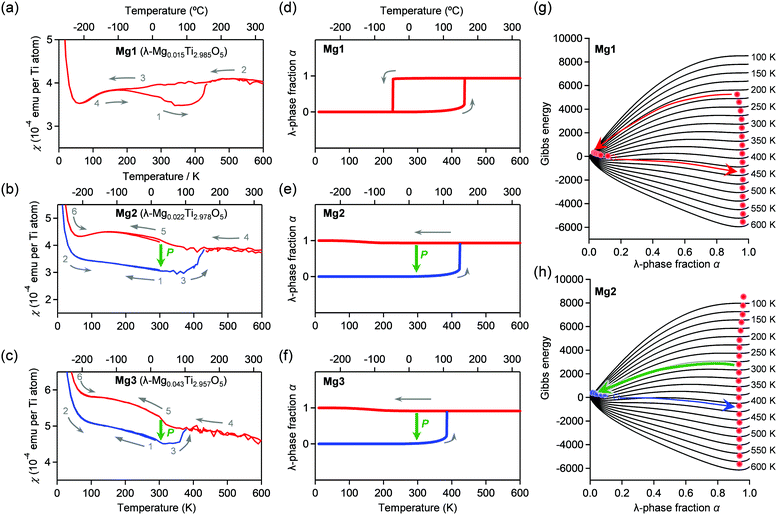
The temperature dependences of the magnetic susceptibility (χ) in Mg1–Mg3 were measured using a superconducting quantum interference device (SQUID) magnetometer (Fig. 5a–c). Mg1 displays a thermal hysteresis loop with a phase transition temperature upon cooling (Tλ→β) at 180 K and a phase transition temperature upon heating (Tβ→λ) of 420 K, and a temperature width of a thermal hysteresis (ΔT ≡ Tβ→λ − Tλ→β) of 240 K. On the other hand, Mg2 and Mg3 do not show such a thermal hysteresis loop at ambient pressure. Applying an external pressure transforms the λ-phase into the β-phase in the heating process. Pressurized Mg2 shows a phase transition from the β-phase to the λ-phase at Tβ→λ = 433 K. Similarly, the Tβ→λ value is 380 K for Mg3.Mechanism of the pressure-induced phase transition
Here, we discuss the reason for the decrease in Tβ→λ by Mg-substitution as well as the increase in the phase transition pressure. We calculated the thermal hysteresis loops of the phase transition between the λ-phase and the β-phase using the mean-field model proposed by Slichter and Drickamer (SD model).49 In the model, the Gibbs energy G of the system is described as G = αΔHt + γ α(1 − α) + T{R[α![[thin space (1/6-em)]](https://www.rsc.org/images/entities/i_char_2009.gif) ln
ln![[thin space (1/6-em)]](https://www.rsc.org/images/entities/char_2009.gif) α + (1 − α)ln(1 − α)] − αΔSt} + Gβ, where α is the λ-phase fraction, Gβ is the Gibbs energy of the β-phase set as the origin of the energies. ΔHt and ΔSt are the transition enthalpy and the transition entropy, which are smaller than ΔHβ→λ and ΔSβ→λ, and γ is the interaction parameter between the λ- and β-phases. The γ value is the interaction parameter due to the elastic interaction inside of crystals, γ = γa + γbT. The SD model calculation reproduced the observed thermal hysteresis loop of Mg1 with Tλ→β = 232 K and Tβ→λ = 440 K with ΔHt = 11.4 kJ mol−1, ΔSt = 28.4 J K−1 mol−1, γa = 12.6 kJ mol−1, and γb = 6.33 J K−1 mol−1. In addition, we reproduced Tβ→λ values of 430 K and 380 K for Mg2 and Mg3, respectively (Fig. 5d–h). Details of the SD parameters for simulations are shown in the Experimental section.
α + (1 − α)ln(1 − α)] − αΔSt} + Gβ, where α is the λ-phase fraction, Gβ is the Gibbs energy of the β-phase set as the origin of the energies. ΔHt and ΔSt are the transition enthalpy and the transition entropy, which are smaller than ΔHβ→λ and ΔSβ→λ, and γ is the interaction parameter between the λ- and β-phases. The γ value is the interaction parameter due to the elastic interaction inside of crystals, γ = γa + γbT. The SD model calculation reproduced the observed thermal hysteresis loop of Mg1 with Tλ→β = 232 K and Tβ→λ = 440 K with ΔHt = 11.4 kJ mol−1, ΔSt = 28.4 J K−1 mol−1, γa = 12.6 kJ mol−1, and γb = 6.33 J K−1 mol−1. In addition, we reproduced Tβ→λ values of 430 K and 380 K for Mg2 and Mg3, respectively (Fig. 5d–h). Details of the SD parameters for simulations are shown in the Experimental section.
To reproduce the pressure-induced phase transition from the λ-phase to the β-phase at room temperature, we calculated the temperature dependence of the Gibbs energy for the λ-and β-phases of Mg1–Mg3 using the γ value and considering pressure contribution (i.e., γ = γa + γbT + γcP). As examples, thermodynamic simulations of thermal hysteresis were performed at 79 MPa (Mg1), 450 MPa (Mg2), and 700 MPa (Mg3). The SD parameters are shown in the Experimental section. The Tλ→β values of Mg1–Mg3 exceed 300 K and correspond to the pressure-induced phase transition from λ-phase to β-phase (Fig. S5, ESI†). Hence, the Mg concentration should significantly influence the γc value, increasing the necessary pressure for the phase transition. To consider the drastic change in the γc value, we investigated the primary particle size of the λ-phase using high-resolution TEM images (Fig. S6, ESI†). The primary particle size of Mg1 is ca. 500 nm, whereas those of Mg2–Mg4 are 50–200 nm. Based on our previous studies,14,15 the primary size of Mg1 and those of Mg2–Mg4 correspond to block-type λ-Ti3O5 and flake-type λ-Ti3O5, respectively. Although the particle sizes in the SEM images change only slightly, the primary particle sizes drastically decrease as the Mg concentration increases. Therefore, the increase of the necessary pressure for the pressure-induced phase transition is attributed to the decreased correlation length of the elastic interaction due to the smaller primary particle size from impurities or defects inside the crystals.
In fact, the increase of the χ value of Mg1–Mg3 in the low-temperature region is attributed to the Curie paramagnetic component due to lattice defects. The Curie constant (C) was obtained by fitting an equation of χ = C/(T − θ), where θ is the Weiss temperature, to the χ–T plot. The fitted C values are 3.3 × 10⁻³ (Mg1), 4.1 × 10⁻³ (Mg2), and 6.2 × 10⁻³ (Mg3) (Fig. S7, ESI†). The increase in the C value also suggests an increase in the lattice defects by Mg-substitution.
Conclusions
Here, we construct a long-term heat-storage system based on Mg-substituted λ-Ti3O5 and investigated its phase transition induced by pressure and heat-storage characteristics. The temperature of the heat storage originating from the β- to λ-phase transition can be controlled from 196 °C (469 K) for x = 0 to 80 °C (353 K) for x = 0.053 by Mg-substitution. The temperature dependence of the λ-phase fraction is well reproduced by the SD model and considering the pressure contribution to the elastic interaction inside crystals. Mg-Substituted λ-Ti3O5 with long-term heat-storage performance would be useful for power plants and industry-to-residential heat-waste reuse because 70% of the generated heat energy is wasted, which is below 100 °C (373 K), the boiling temperature of water. This series composed of Mg, Ti, and O should realize both economic and environmental benefits.Experimental
Physical measurements
Elemental analyses on the prepared samples were performed using XRF (Rigaku, ZSX PrimusII). The compositions were determined to be Mg1: Mg0.015Ti2.985O5 (calc.: Mg 0.17%, Ti 64.00%, O 35.84%; found: Mg 0.16%, Ti 63.72%, O 36.11%); Mg2: Mg0.022Ti2.978O5 (calc.: Mg 0.24%, Ti 63.90%, O 35.86%; found: Mg 0.24%, Ti 63.64%, O 36.13%); Mg3: Mg0.043Ti2.957O5 (calc.: Mg 0.47%, Ti 63.59%, O 35.94%; found: Mg 0.47%, Ti 63.11%, O 36.43%); and Mg4: Mg0.053Ti2.947O5 (calc.: Mg 0.58%, Ti 63.44%, O 35.98%; found: Mg 0.58%, Ti 63.80%, O 35.61%). The TEM measurements were conducted using a JEOL JEM-2000EXII and a JEM-4000FXII. A JEOL JSM-7000F SEM measured the morphologies of the compounds with a 15 kV or 10 kV accelerating voltage. The XRD measurements were carried out on Rigaku Ultima IV (Cu Kα source, λ = 1.5418 Å). RIETAN-FP50 and RIGAKU PDXL programs were used for Rietveld analyses. The magnetic properties were measured using a SQUID magnetometer (Quantum Design, MPMS 7). DSC measurements were conducted using a Rigaku DSC 8230. The samples for DSC measurements were prepared by pressurization, and the phase ratios for each sample were as follows: 36% of λ-phase and 64% of β-phase (Mg1), 75% of λ-phase and 25% of β-phase (Mg2), 52% of λ-phase and 48% of β-phase (Mg3), and 80% of λ-phase and 20% of β-phase (Mg4). An infrared thermal imaging camera (NIPPON AVIONICS R550Pro) acquired the thermographic images. The background temperatures were around 25 °C (Mg1), 21 °C (Mg2 and Mg4), and 28 °C (Mg3).Thermodynamic analysis
The γ value is dependent on temperature and pressure (i.e., γ = γa + γbT + γcP). In the simulation of the temperature dependence of α at 0.1 MPa, γc was not taken into account. The parameters of the SD model simulations (ΔH, ΔS, γa, γb) for Mg1–Mg3 were (216 kJ L−1, 539 J K−1 L−1, 239 kJ L−1, −120 J K−1 L−1), (204 kJ L−1, 524 J K−1 L−1, 237 kJ L−1, −130 J K−1 L−1), and (188 kJ L−1, 519 J K−1 L−1, 229 kJ L−1, −185 J K−1 L−1), respectively. Based on the pressure-induced phase transition properties of Mg1–Mg3, thermodynamic simulations at 79 MPa (Mg1), 450 MPa (Mg2), and 700 MPa (Mg3) were performed using the following parameters of (ΔH, ΔS, γa, γb, γc): (216 kJ L−1, 536 J K−1 L−1, 243 kJ L−1, −120 J K−1 L−1, −168 J MPa−1 L−1), (204 kJ L−1, 486 J K−1 L−1, 237 kJ L−1, −130 J K−1 L−1, −3.8 J MPa−1 L−1), and (188 kJ L−1, 395 J K−1 L−1, 229 kJ L−1, −185 J K−1 L−1, −0.9 J MPa−1 L−1), respectively. The ΔH and ΔS values under pressure were determined based on first-principles calculations in which the ΔS value decreased by 12% while the ΔH value remained nearly constant at 1 GPa.Author contributions
S. O. coordinated and designed the entire study, supervised all of the experiments and theoretical simulations, and wrote the paper. F. J. synthesized the samples and conducted the elemental analyses, SEM observations, pressure-dependence experiments, PXRD, thermography, DSC, and magnetic measurements, thermodynamic calculations, and TEM analysis. M. Y. obtained the TEM images and contributed to writing the paper. K. I. conducted the thermodynamic calculations, Rietveld analyses, and analyses of the magnetic data. H. T. contributed to the DSC and magnetic measurements. K. N. conducted the DSC, thermography, and magnetic measurements, Y. M. contributed to the synthesis, A. N. conducted the Rietveld analysis, and R. H., K. H., K. K., K. S., and T. S. contributed to the interpretation of the results. All authors commented on the manuscript.Conflicts of interest
There are no conflicts to declare.Acknowledgements
This work was partially supported by the Advanced Research Program for Energy and Environmental Technologies project commissioned by the New Energy and Industrial Technology Development Organization (NEDO) of METI and a JSPS Grant-in-Aid for Scientific Research (A) (Grant Number 20H00369). F. J. is grateful to JST SPRING (Grant Number JPMJSP2108). This work was partially carried out in the framework of the IM-LED LIA (CNRS). We recognize the Cryogenic Research Center and the Center for Nano Lithography & Analysis at The University of Tokyo.References
- D. Butler, Nature, 2007, 445, 768–769 CrossRef PubMed.
- D. Lindley, Nature, 2009, 458, 138–141 CrossRef CAS PubMed.
- S. A. Rattner and S. Garimella, Energy, 2011, 36, 6172–6183 CrossRef.
- D. B. Gingerich and M. S. Mauter, Environ. Sci. Technol., 2015, 49, 8297–8306 CrossRef CAS PubMed.
- C. W. King, A. S. Holman and M. E. Webber, Nat. Geosci., 2008, 1, 283–286 CrossRef CAS.
- M. D. Bartos and M. V. Chester, Nat. Clim. Change, 2015, 5, 748–752 CrossRef.
- G. W. Crabtree and N. S. Lewis, Phys. Today, 2007, 60, 37–42 CrossRef CAS.
- E. Cartlidge, Science, 2011, 334, 922–924 CrossRef PubMed.
- M. M. Farid, A. M. Khudhair, S. A.-K. Razack and S. Al-Hallaj, Energy Convers. Manage., 2004, 45, 1597–1615 CrossRef CAS.
- A. Sharma, V. V. Tyagi, C. R. Chen and D. Buddhi, Renewable Sustainable Energy Rev., 2009, 13, 318–345 CrossRef CAS.
- M. Barrio, D. O. López, J. Ll. Tamarit, P. Negrier and Y. Haget, J. Solid State Chem., 1996, 124, 29–38 CrossRef CAS.
- I. Gur, K. Sawyer and R. Prasher, Science, 2012, 335, 1454–1455 CrossRef PubMed.
- H. Tokoro, M. Yoshikiyo, K. Imoto, A. Namai, T. Nasu, K. Nakagawa, N. Ozaki, F. Hakoe, K. Tanaka, K. Chiba, R. Makiura, K. Prassides and S. Ohkoshi, Nat. Commun., 2015, 6, 7037 CrossRef CAS PubMed.
- S. Ohkoshi, Y. Tsunobuchi, T. Matsuda, K. Hashimoto, A. Namai, F. Hakoe and H. Tokoro, Nat. Chem., 2010, 2, 539–545 CrossRef CAS PubMed.
- S. Ohkoshi, H. Tokoro, K. Nakagawa, M. Yoshikiyo, F. Jia and A. Namai, Sci. Rep., 2019, 9, 13203 CrossRef PubMed.
- C. Mariette, M. Lorenc, H. Cailleau, E. Collet, L. Guérin, A. Volte, E. Trzop, R. Bertoni, X. Dong, B. Lépine, O. Hernandez, E. Janod, L. Cario, V. Ta Phuoc, S. Ohkoshi, H. Tokoro, L. Patthey, A. Babic, I. Usov, D. Ozerov, L. Sala, S. Ebner, P. Böhler, A. Keller, A. Oggenfuss, T. Zmofing, S. Redford, S. Vetter, R. Follath, P. Juranic, A. Schreiber, P. Beaud, V. Esposito, Y. Deng, G. Ingold, M. Chergui, G. F. Mancini, R. Mankowsky, C. Svetina, S. Zerdane, A. Mozzanica, A. Bosak, M. Wulff, M. Levantino, H. Lemke and M. Cammarata, Nat. Commun., 2021, 12, 1239 CrossRef CAS PubMed.
- Y. Nakamura, Y. Sakai, M. Azuma and S. Ohkoshi, Sci. Adv., 2020, 6, 5264 CrossRef PubMed.
- S. Ohkoshi, Y. Maeno and T. Nasu, International Patent Number WO2017/164083, 2017.
- M. Wang, W. Huang, Z. Shen, J. Gao, Y. Shi, T. Lu and Q. Shi, J. Alloys Compd., 2019, 774, 1189–1194 CrossRef CAS.
- A. Bleuzen, V. Marvaud, C. Mathonière, B. Sieklucka and M. Verdaguer, Inorg. Chem., 2009, 48, 3453–3466 CrossRef CAS PubMed.
- S. Ohkoshi, S. Ikeda, T. Hozumi, T. Kashiwagi and K. Hashimoto, J. Am. Chem. Soc., 2006, 128, 5320–5321 CrossRef CAS PubMed.
- Y.-Z. Zhang, P. Ferko, D. Siretanu, R. Ababei, N. P. Rath, M. J. Shaw, R. Clérac, C. Mathonière and S. M. Holmes, J. Am. Chem. Soc., 2014, 136, 16854–16864 CrossRef CAS PubMed.
- J. M. Cain, A. C. Felts, M. W. Meisel and D. R. Talham, Chem. Mater., 2021, 33, 246–255 CrossRef CAS.
- M. Magott, M. Reczyński, B. Gaweł, B. Sieklucka and D. Pinkowicz, J. Am. Chem. Soc., 2018, 140, 15876–15882 CrossRef CAS PubMed.
- F. J. Luque, I. A. Kowalik, J. P. Prieto-Ruiz, M. Á. Niño, H. Prima-García, F. M. Romero, D. Arvanitis, C. Mathonière, E. Coronado, R. Miranda and J. J. de Miguel, J. Mater. Chem. C, 2019, 7, 2305–2317 RSC.
- S. Chorazy, T. Charytanowicz, D. Pinkowicz, J. Wang, K. Nakabayashi, S. Klimke, F. Renz, S. Ohkoshi and B. Sieklucka, Angew. Chem., Int. Ed., 2020, 59, 15741–15749 CrossRef CAS PubMed.
- P. Gütlich, Y. Garcia and T. Woike, Coord. Chem. Rev., 2001, 219, 839–879 CrossRef.
- K. Ridier, A.-C. Bas, V. Shalabaeva, W. Nicolazzi, L. Salmon, G. Molnár, A. Bousseksou, M. Lorenc, R. Bertoni, E. Collet and H. Cailleau, Adv. Mater., 2019, 31, 1901361 CrossRef PubMed.
- F. Renz, H. Oshio, V. Ksenofontov, M. Waldeck, H. Spiering and P. Gütlich, Angew. Chem., Int. Ed., 2000, 39, 3699–3700 CrossRef CAS PubMed.
- C. Rajnak, R. Micova, J. Moncol, L. Dlhan, C. Kruger, F. Renz and R. Boca, Dalton Trans., 2021, 50, 472–475 RSC.
- V. Davesne, M. Gruber, M. Studniarek, W. H. Doh, S. Zafeiratos, L. Joly, F. Sirotti, M. G. Silly, A. B. Gaspar, J. A. Real, G. Schmerber, M. Bowen, W. Weber, S. Boukari, V. Da Costa, J. Arabski, W. Wulfhekel and E. Beaurepaire, J. Chem. Phys., 2015, 142, 194702 CrossRef CAS PubMed.
- S. Ohkoshi, K. Imoto, Y. Tsunobuchi, S. Takano and H. Tokoro, Nat. Chem., 2011, 3, 564–569 CrossRef CAS PubMed.
- P. N. Martninho, P. N. Gildea, M. M. Harris, T. Lemma, A. D. Naik, H. Müller-Bunz, T. E. Keyes, Y. Garcia and G. G. Morgan, Angew. Chem., Int. Ed., 2012, 51, 12597–12601 CrossRef PubMed.
- S. Ohkoshi, S. Takano, K. Imoto, M. Yoshikiyo, A. Namai and H. Tokoro, Nat. Photonics, 2014, 8, 65–71 CrossRef CAS.
- H. Holovchenko, J. Dugay, M. Gimenez-Marques, R. Torres-Cavanillas, E. Coronado and H. S.-J. van der Zaant, Adv. Mater., 2016, 28, 7228–7233 CrossRef PubMed.
- Y. Zan, L. Salmon and A. Bousseksou, Nanomaterials, 2021, 11, 3169 CrossRef CAS PubMed.
- J. E. Clements, P. R. Airey, F. Ragon, V. Shang, C. J. Kepert and S. M. Neville, Inorg. Chem., 2018, 57, 14930–14938 CrossRef CAS PubMed.
- M. Paez-Espejo, M. Sy and K. Boukheddaden, J. Am. Chem. Soc., 2018, 140, 11954–11964 CrossRef CAS PubMed.
- Y. Guo, S. Xue, M. M. Dirtu and Y. Garcia, J. Mater. Chem. C, 2018, 6, 3895–3900 RSC.
- T. Boon-prab, S. J. Lee, S. J. Telfer, K. S. Murray, W. Phonsri, G. Chastanet, E. Collet, E. Trzop, G. N.-L. Jameson, P. Harding and D. J. Harding, Angew. Chem., Int. Ed., 2019, 58, 11811–11815 CrossRef CAS PubMed.
- Z. Liu, Y. Sakai, J. Yang, W. Li, Y. Liu, X. Ye, S. Qin, J. Chen, S. Agrestini, K. Chen, S.-C. Liao, S.-C. Haw, F. Baudelet, H. Ishii, T. Nishikubo, H. Ishizaki, T. Yamamoto, Z. Pan, M. Fukuda, K. Ohashi, K. Matsuno, A. Machida, T. Watanuki, S. Kawaguchi, A. M. Arevalo-Lopez, C. Jin, Z. Hu, J. P. Attfield, M. Azuma and Y. Long, J. Am. Chem. Soc., 2020, 142, 5731–5741 CrossRef CAS PubMed.
- J. Varignon, M. Bibes and A. Zunger, Nat. Commun., 2019, 10, 1658 CrossRef PubMed.
- S. N. Vaidya, C. Karunakaran and S. T. Arina, High Pressure Res., 2001, 21, 79–92 CrossRef.
- S. Rahman, S. Samanta, D. Errandonea, S. Yan, K. Yang, J. Lu and L. Wang, Phys. Rev. B, 2017, 95, 024107 CrossRef.
- F. Bai, K. Bian, X. Huang, Z. Wang and H. Fan, Chem. Rev., 2019, 119, 7673–7717 CrossRef CAS PubMed.
- E. Coronado and G. M. Espallargas, Chem. Soc. Rev., 2013, 42, 1525–1539 RSC.
- D. Pinkowicz, M. Rams, M. Mišek, K. V. Kamenev, H. Tomkowiak, A. Katrusiak and B. Sieklucka, J. Am. Chem. Soc., 2015, 137, 8795–8802 CrossRef CAS PubMed.
- A. B. Gaspar, G. Molnár, A. Rotaru and H. J. Shepherd, C. R. Chim, 2018, 21, 1095–1120 CrossRef CAS.
- C. P. Slichter and H. G. Drickamer, J. Chem. Phys., 1972, 56, 2142–2160 CrossRef CAS.
- F. Izumi and K. Momma, Solid State Phenom., 2007, 130, 15–20 CAS.
Footnote |
| † Electronic supplementary information (ESI) available: PXRD patterns, Rietveld analyses, pressure-induced temperature changes, high-temperature PXRD patterns, SD-model calculations, TEM images, and Curie paramagnetic component estimated from magnetic susceptibility. See DOI: https://doi.org/10.1039/d2ma00278g |
| This journal is © The Royal Society of Chemistry 2022 |

