 Open Access Article
Creative Commons Attribution 3.0 Unported Licence
Construction of novel flower-like functionalized black phosphorus nanosheets/P-doped BiOCl S-scheme photocatalysts with improved photocatalytic activity in RhB and Cr(VI) degradation†
Hecheng
Ma
 ,
Jianjun
Liu
 *,
Yimeng
Wang
,
Shengli
Zuo
,
Yingchun
Yu
* and
Baoshan
Li

State Key Laboratory of Chemical Resource Engineering, Beijing University of Chemical Technology, Beijing 100029, P. R. China. E-mail: liujj@buct.edu.cn; yuyc@buct.edu.cn
First published on 26th July 2022
Abstract
Photocatalytic degradation has been developed as a promising strategy for environmental remediation. Black phosphorus (BP) has attracted much attention in the field of photocatalysis due to the adjustable bandgap and high carrier mobility. In this work, we constructed a flower-like BP nanosheet/P-doped BiOCl (BP/P-BiOCl) S-scheme heterostructure via a simple co-precipitation method. The physicochemical properties such as the crystallinity, morphology, chemical environment, and optical and electronic properties of the as-fabricated materials were analyzed by using different analytical techniques. SEM data indicated the successful formation of a flower-like structure of BP/P-BiOCl composites. X-Ray photoelectron spectroscopy data indicated the formation of P-doped BiOCl. X-Ray diffraction and high resolution-TEM data revealed the formation of a hierarchical BP/P-BiOCl heterostructure. The catalytic activity of the as-synthesized samples (15%-BP/P-BiOCl) was tested towards RhB degradation (96% of 20 ppm RhB solution) and Cr(VI) reduction (90% of 20 ppm Cr(VI) solution) under solar light illumination. We demonstrated the formation mechanism of a flower-like structure in which positively charged BPNs assembled with negatively charged P-BiOCl by electrostatic attraction. Furthermore, we revealed the S-scheme photocatalytic mechanism to prove the enhanced photocatalytic activity of BP/P-BiOCl composites. The photodegradation of phenol, radical species trapping experiments and charge transfer route test were performed to prove the formation of the S-scheme. This work provides a facile route for the construction of a flower-like S-scheme heterostructure photocatalyst for efficient solar light photocatalytic performance.
1. Introduction
Photocatalysis has received widespread attention due to its promising application in environmental pollution elimination and energy conversion.1 Bismuth oxychloride (BiOCl) has attracted much attention in the field of photocatalysis due to its indirect band gap (3.2–3.5 eV), and structure-dependent photocatalytic performance that arises from its layered structure interleaved with Bi2O2 slabs and double halogen atom slabs.2,3 However, the photocatalytic activity of BiOCl still needs to be improved, as it has a wide band gap, poor light absorption and fast carrier recombination rate. These deficiencies could be resolved by various modification methods, including creating defects, atom doping, noble metal deposition, and heterojunction construction; of these, atom doping is simple and effective.4 Mn-doped BiOCl and B-doped BiOCl reportedly have improved photocatalytic degradation efficiency.5,6 Meanwhile, doping the semiconductors with nonmetal elements such as N, P, C and S is an efficient method to optimize the electronic structure and improve the electron-pair separation. Various studies have shown that phosphorus-doping (P-doping) can efficiently promote the photocatalytic efficiency of photocatalysts. Han et al. have reported surface P-doped TiO2 by using the sol–gel method.7 Zeynab et al. have reported P-doped BiOx for efficient Cr(VI) degradation.8 The significant improvement in the photocatalytic performance of P-doped metal oxides can be attributed to the synergistic effects of better light harvesting and inducing electronic vacancies by surface doped P5+, which can facilitate the migration and separation of photogenerated charge carriers. The P-doped BiOCl shows a larger band gap with a more negative CB, facilitating the photodegradation of tetracycline.9BP nanosheets, a new two-dimensional semiconductor, have attracted much attention in various fields of application, including biomedicine, biosensing, supercapacitors, solar cells, etc.10–12 They also exhibit great potential in photocatalysis due to their optical/electronic characteristics, such as outstanding light harvesting ability for a broad spectrum, a tunable band gap (0.3–2.0 eV) and high carrier mobility (∼1000 cm2 V−1 s−1).13–15 As a result, BP-based materials have been applied in many photocatalysis fields, such as H2 evolution, degradation of organic pollutants, removal of air pollutants and nitrogen fixation.16 For example, Lei fabricated Ag/BP nanohybrids to photodegrade RhB under visible light irradiation.17 Yu's group constructed a BP/RP heterostructure as a visible light driven photocatalyst for the degradation of organic pollutants.18 Fujitsuka's group found that BP/CN is a metal-free photocatalyst for efficient H2 evolution.19
Recently, a novel step-scheme (S-scheme) heterojunction was proposed and has attracted much attention from researchers.20 An S-scheme heterojunction usually consists of an oxidation photocatalyst and a reduction photocatalyst with staggered band structures. Besides, the directional migration of free electrons will lead to band bending and internal electric field (IEF) owing to the work function difference.21 Notably, under the influence of an IEF, the photogenerated electrons of an oxidation photocatalyst can recombine with the photogenerated holes of a reduction photocatalyst. Recently, Yu et al. constructed a core–shell S-scheme TiO2/ZnIn2S4 for efficient photocatalytic CO2 reduction.22 Meanwhile, the S-scheme photogenerated charge transfer mechanism is testified by in situ irradiated X-ray photoelectron spectroscopy.
The morphology of photocatalysts is an important factor that can greatly affect their photocatalytic performance.23–25 Moreover, flower-like Z-scheme nanostructures assembled from two-dimensional (2D) nanosheets feature interconnected open pores, thereby exposing a large number of active sites and ensuring high catalytic performance.26,27 Ultrathin 2D nanosheets assembled into a flower-like structure in close contact with each other, thereby displaying high stability and reusability.28 Recently, Zhang's group found that PDDA functionalized BP nanosheets combined with BiOI nanoplates displaying a unique flower-like nanostructure with enhanced visible light photocatalytic activity.29 The PDDA functionalized BP nanosheets could facilitate the formation of a tight heterojunction with BiOI. Li et al. constructed flower-like BP/BiOBr nanocomposites with enhanced photocatalytic activity via a simple co-precipitation method.30
In this work, we report the synthesis of P-doped BiOCl and the use of functionalized BPNs to strengthen the photocatalytic activity of P-doped BiOCl by establishing a flower-like S-scheme system. The formation mechanism of a flower-like hierarchical structure was revealed. PDDA functionalized BP nanosheets assist in the formation of a nanoflower. Moreover, PDDA plays a passivating role in improving the stability of the BP nanosheets. In comparison with bulk BP and BiOCl, the optimized catalyst displays the highest efficiency with regard to the degradation of RhB and Cr(VI) under sun light irradiation. Meanwhile, the formation of a Z-scheme heterostructure can accelerate photogenerated carrier separation and utilize the VB and the CB with high redox ability. The catalysts also retain stability after several evaluation cycles. Finally, a possible photocatalytic mechanism of the Z-scheme functionalized BPNs and BiOCl composites is proposed.
2. Experimental section
2.1 Reagents
The reagents used in this experiment and their purities are provided in the ESI.†2.2 Synthesis of BP
All chemicals were purchased from Aladdin without further purification. In this work, BP was synthesized by the mineralization method according to the previous literature with a little modification.31 Red phosphorus (500 mg), Sn powder (60 mg) and SnI4 (30 mg) were sealed in a vacuum quartz tube with a length of 20 cm, an inner diameter of 1 cm and a wall thickness of 0.2 cm. The preparation of black phosphorus is based on the concept of mineralization, so Sn powder and SnI4 play the role of mineralizers and will not exist in the final product. The quartz tube was placed in a muffle furnace and heated to 893 K at a rate of 1 K min−1 and held for 2 h; then it was cooled to 758 K at a rate of 0.33 K min−1 and held for 3 h and finally cooled at a rate of 0.33 K min−1 to room temperature. Specifically, the product was placed in 20 mL of hot toluene and sonicated for 15 min and then placed in 20 mL of acetone and sonicated for 24 h. Finally, the product was rinsed with ethanol three times and dried in a vacuum to get the final product. The XRD patterns and the optical picture of BP are shown in Fig. S1 (ESI†).2.3 Preparation of functionalized BPNs
100 μL poly dimethyl diallyl ammonium chloride (PDDA) was added to 50 mL deionized water and sonicated for 10 min. Next, 25 mg of BP was added to the PDDA solution and sonicated for 2.5 h to form a turbid solution. The number of layers of the BPNs was controlled by the centrifugation speed. First, a speed of 6000 rpm was employed for 15 min to remove unstripped BP. Finally, the obtained suspension was centrifuged again at a speed of 11![[thin space (1/6-em)]](https://www.rsc.org/images/entities/char_2009.gif) 000 rpm for 15 min to obtain a solution of nanosheets consisting of a few layers of PDDA-functionalized BP and named as BPNs. The obtained BPNs were dissolved in deionized water to form a BPN dispersion.
000 rpm for 15 min to obtain a solution of nanosheets consisting of a few layers of PDDA-functionalized BP and named as BPNs. The obtained BPNs were dissolved in deionized water to form a BPN dispersion.
2.4 Preparation of flower-like BP/P-BiOCl nanocomposites
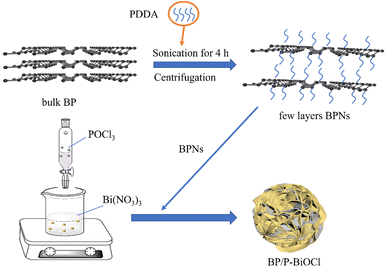
2 mmol Bi(NO3)3·5H2O was added to 5 mL of ethylene glycol to give a solution named solution A. 2 mmol of POCl3 was added to solution A and then stirred for 30 min to make Bi(NO3)3 dissolve. Then, 5 mL BPNs was added to solution A and stirred at room temperature for 4 h. The amount of BPNs was also changed from 20 mL, 40 mL and 80 mL, and the obtained samples were named as 5%-BP/P-BiOCl, 10%-BP/P-BiOCl, 15%-BP/P-BiOCl and 20%-BP/P-BiOCl. Pure P-BiOCl was prepared in the same manner without the addition of the BPNs solution. Pure BiOCl was prepared via a solvothermal method. 1 mmol Bi(NO3)·5H2O and 1 mmol NaCl were dissolved into 70 mL glycol and deionized water, respectively, followed by constant stirring for 1 h to form a transparent solution. Then, the NaCl solution was dropwise added to the Bi(NO3)·5H2O solution, which was kept stirring for 30 min at room temperature. The mixture was kept stirring for 1 h and then transferred to a 200 mL Teflon-lined stainless-steel autoclave. The autoclave was treated at 120 °C for 12 h and then naturally cooled to room temperature. The samples were separated by filtration, washed with distilled water and ethanol several times and dried at 60 °C for 12 h. The obtained products were centrifuged and then washed with water and ethanol several times and then placed in an oven and dried at 60 °C overnight. The synthesis process is shown in Scheme 1.2.5 Characterization
The instruments and methods used to characterize the photocatalysts are provided in the ESI.†2.6 Photocatalytic evaluation
In this scientific research, K2Cr2O7 was selected to prepare a standard chromium solution used to simulate Cr(VI)-containing sewage, while RhB and phenol were used to simulate organic pollutants. The photocatalytic activity of the as-prepared samples was evaluated by degradation of RhB, phenol and Cr(VI) under solar light irradiation. A 300 W Xenon lamp was chosen to offer simulated sun light. The experimental details were as follows: under dark conditions, 50 mg of the photocatalyst was dispersed in a 100 mL of 20 ppm RhB or 40 ppm phenol or 20 ppm Cr(VI) aqueous solution. The RhB (phenol, Cr(VI)) solution was stirred for 30 min in the dark to establish an absorption–desorption equilibrium. During the period of light irradiation, the 5 mL solution containing the sample was removed from the reaction suspensions every 15 minutes and then centrifuged at 4000 rpm to remove the photocatalyst. Next, the concentrations of the RhB solution and the phenol solution were measured using a UV–vis spectrophotometer at wavelengths of 554 nm and 270 nm, respectively. The absorbance of the Cr(VI) solution was measured using a Cr(VI)-DCP method using the UV-vis spectrophotometer at the wavelength of 540 nm.32 Finally, the concentration changes were described by C/C0, where C0 is the initial concentration of RhB (phenol, Cr(VI)) and C is the remaining concentration of RhB (phenol, Cr(VI)). The degradation ratio was expressed as (1 − (C/C0)) × 100%.3. Results and discussion
3.1 Structure and morphology
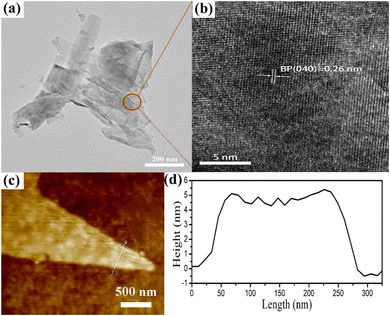
Black phosphorus was fabricated by a mineralization method. The black phosphorus nanosheets (BPNs) were then obtained through water-liquid exfoliation. In order to change the surface properties and stability of the BPNs, PDDA was introduced to functionalize and passivate the nanosheets. In the comparison of BPNs (−10.2 mV), the zeta potential of the functionalized BPNs was shifted to +54.8 mV, which further reveals that BPNs were successfully modified by the PDDA molecules. Besides, the zeta potential of the P-doped BiOCl was also measured, and the result showed that the zeta potential of P-BiOCl is −15.5 mV. The TEM and HRTEM images of the functionalized BP nanosheets are shown in Fig. 1. And the TEM image (Fig. 1a) of the functionalized BP nanosheets displays a size of about 200–300 nm. Fig. 1b displays that the lattice fringe spaces with 0.26 nm were assigned to the (040) plane of the BP nanosheets. The AFM images of the BP nanosheets show a few-layers with a thickness of 4.5 ± 0.6 nm.13The X-ray diffraction (XRD) pattern of the pure BiOCl, P-BiOCl and BPNs/P-BiOCl nanocomposites is shown in Fig. 2a. As observed from the measured XRD pattern shown in Fig. 2a, all the diffraction peaks of the as prepared P-BiOCl could be indexed to BiOCl (JCPDS: 06-0249), illustrating the formation of tetragonal BiOCl after P-doping modification. The diffraction peaks in the XRD patterns of BPNs can be observed at a 2θ of 17.2°, 34.5° and 52.8°, corresponding to the (020), (040), and (060) faces of BPNs (JCPDS: 73-1358). Compared to pure BiOCl, the (001) peaks of P-BiOCl shifted to 12.12° due to the successful doping of phosphorus with BiOCl. The BP/P-BiOCl nanocomposites exhibit similar XRD patterns to P-BiOCl and BPNs, and with the addition of BPNs, the P-BiOCl diffraction peaks became weakened because of the deposition of BPNs on the surface of P-BiOCl, thus suppressing the growth of P-BiOCl (101) faces.33 X-Ray diffraction (XRD) patterns of the BiOCl and P-BiOCl samples (Fig. S2, ESI†) show that both samples have sharp diffraction peaks, indicating their good crystallinity. All the diffraction peaks match well with the tetragonal phase of BiOCl (JCPDS file 06-0249). No other phases could be observed in the P-BiOCl sample, illustrating that P-doping did not change the structure of BiOCl.
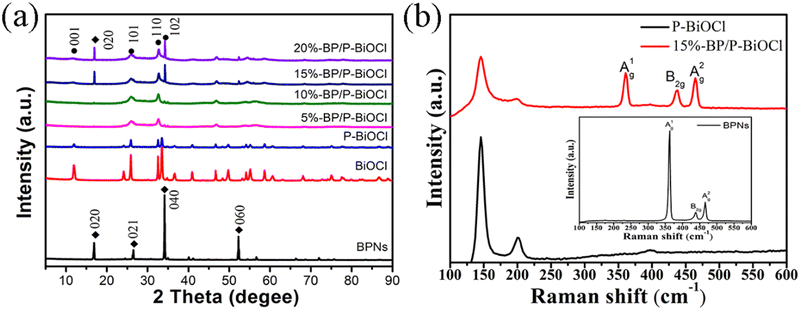 | ||
| Fig. 2 (a) XRD patterns of BPNs, P-BiOCl and BP/P-BiOCl nanocomposites, (b) Raman spectra of BP, P-BiOCl and 15%-BP/P-BiOCl. | ||
Raman analysis was used to confirm the existence of BP nanosheets in nanocomposites. As shown in Fig. 2b, P-BiOCl and 15%-BP/P-BiOCl show two similar peaks at 146 and 201 cm−1, which correspond to the A1g internal Bi–Cl stretching mode and the Eg internal Bi–Cl stretching mode. The characteristic peaks at 361, 438 and 465 cm−1 correspond to the A1g, B2g and A2g modes of BP, indicating the successful preparation of BP with orthogonal crystals. Raman spectra of BiOCl and P-BiOCl are shown in Fig. S3 (ESI†). The apparent peaks at 144.3 (142.5) and 199.2 (193.9) cm−1 are assigned to the A1g and Eg internal Bi–Cl stretching mode, respectively. Moreover, the intensities of the peaks decrease after P-doping, which demonstrated the decrease of the vibrating group (Bi–Cl).9
To further investigate the interfacial interactions between BPNs and P-BiOCl and the chemical states of 15%-BP/P-BiOCl hybrid photocatalysts, XPS spectra were recorded, which showed Bi 4f, O 1s and Cl 2p in P-BiOCl and 15%-BP/P-BiOCl and P 2p in BPNs and 15%-BP/P-BiOCl (Fig. 3). For the Bi 4f spectrum of P-BiOCl (Fig. 3a), the two peaks at 158.7 and 163.9 eV can be attributed to Bi 4f7/2 and Bi 4f5/2, respectively. In contrast, these binding energies were observed to shift to higher binding energies by ca. 0.6 eV for Bi 4f7/2 and 0.4 eV for Bi 4f5/2 in BP/P-BiOCl. The increase of binding energy of Bi 4f, O 1s and Cl 2p demonstrated the strengthening of the electron screening effect due to the decreased electron density, thus the increase of binding energy means a decreased electron density. For the O 1s spectrum of 15%-BP/P-BiOCl, the three peaks at 529.1 eV, 530.3 eV and 531.38 eV are attributed to the Bi–O bond, P–O bond and absorbed O2, respectively. The P 2p XPS spectrum is shown in Fig. 3d. The three peaks at 129.1, 129.9 and 133.3 eV are assigned to P 2p3/2, P 2p1/2 and P–O bonds in P-BiOCl, indicating the formation of P-doped BiOCl. This binding energy shifted to lower binding energy by ca. 0.1 eV for P 2p and 0.1 eV for the P–O bond in BP/P-BiOCl. The higher or lower binding energy shifts of Bi 4f and P 2p in BP/P-BiOCl are ascribed to the decreased and increased electron density of P-BiOCl and BP, respectively. This change of electron density is due to the transfer of electrons from BiOCl to BPNs through the internal electric field.19 The XPS spectra of BiOCl and P-BiOCl are shown in Fig. S4 (ESI†). As shown in Fig. S4d (ESI†), the P 2p spectra of P-BiOCl show that only one peak at 132.8 eV is identified as the P–O bond.
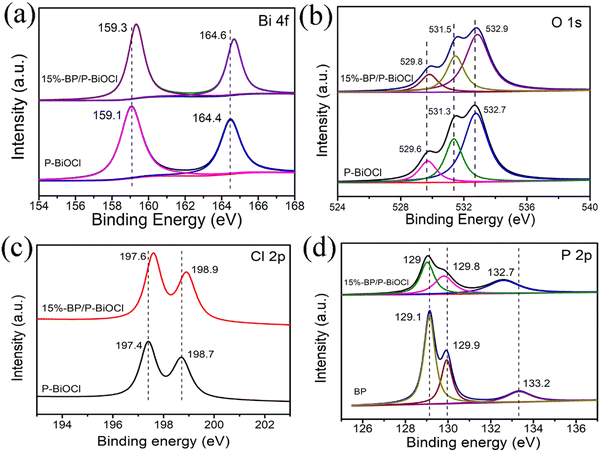 | ||
| Fig. 3 XPS spectra of Bi 4f (a), O 1s (b), Cl 2p (c), and P 2p (d) of P-BiOCl. BP and 15%-BP/P-BiOCl. | ||
The FTIR spectra of BiOCl and P-BiOCl are shown in Fig. S5 (ESI†). The bands around 530 cm−1 are attributed to the stretching vibration of the Bi–O bond. The vibration bands around 1620 and 3440 cm−1 are assigned as the bending and stretching vibration of adsorbed water and hydroxyl groups. The new characteristic peak appearing at 960 cm−1 of P-BiOCl is associated with the stretching vibration of the P–O bond, it illustrates that the phosphorus element incorporates into the crystal structure of BiOCl rather than being in the absorbed state of PO43−. Besides, the actual content of the P ion in the P-BiOCl sample was measured by inductively coupled plasma (ICP) mass spectrometry, and the value is 0.36 wt%.
The morphology of P-BiOCl and BP/P-BiOCl nanocomposites was observed via SEM, TEM and HRTEM. As shown in Fig. 4c, P-BiOCl presents a stacking plate structure with a size range of 200–400 nm. Compared with P-BiOCl, 15%-BP/P-BiOCl in the composite samples is comparatively similar in size, as shown in Fig. 4b. The reason for the high dispersity is the suppression of the (001) crystal plane of P-BiOCl due to the addition of BPNs. The BPNs efficiently inhibited the aggregation of P-BiOCl nanoparticles. P-BiOCl with negative charge combines with PDDA functionalized BPNs via in situ growth, and the flower-like structure is determined by the existence state of PDDA. Owing to polymerization of long chains of dimethyl diallyl ammonium chloride, PDDA can act as a soft template, leading to the formation of a flower-like structure.29 Such a flower-like structure offers abundant transmission channels to the active sites of the photogenerated carriers. To further study the microstructure of the P-BiOCl and 15%-BP/P-BiOCl composites, TEM and HRTEM were employed. Fig. 4(e and f) reveals the irregular plates of P-BiOCl and the three-dimensional hierarchical structure of 15%-BP/P-BiOCl. The surface of 15%-BP/P-BiOCl is not as smooth as that of P-BiOCl, as can be seen in Fig. 4a. For the HR-TEM image of 15%-BP/P-BiOCl in Fig. 4f, the lattice fringes with an interplanar distance of 0.275 nm and an interplanar distance of 0.25 nm can be attributed to the (110) plane of P-BiOCl and the (040) plane of BPNs, respectively. The electrostatic self-assembly could enhance the separation efficiency of charge carriers and facilitate the formation of a heterojunction.23 These results verify that the BPNs grow compactly on the surface of P-BiOCl, and that the heterojunction has been prepared successfully via an electrostatic self-assembly method. As shown in Fig. 4e, we can clearly find the heterojunction formed at the edge of the flower-like structure (marked by the red circle). The EDS elemental mapping of 15%-BP/P-BiOCl was carried out. As shown in Fig. 4c, all the Bi, O, Cl and P elements are present in the 15%-BP/P-BiOCl heterostructure, which indicates homogeneous hybridization consisting of P_BiOCl and BPNs. These results reveal that the flower-like 3D structure of the 15%-BP/P-BiOCl heterostructure is composed of two types of nanosheets, which have successfully hybridized via electrostatic self-assembly. We further constructed BP/BiOBr and BP/BiOI composites to study the morphology. For now, we found that the BiOX (X = Cl, Br, I) nanosheets with the addition of PDDA functionalized BP nanosheets are major components of the flower-like structure, as shown in Fig. S6 (ESI†).
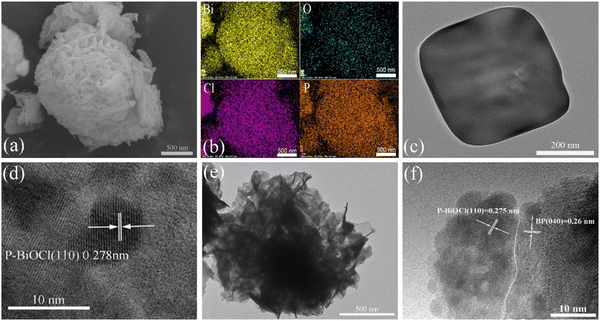 | ||
| Fig. 4 (a) SEM image of 15%-BP/P-BiOCl, (b) EDX mapping of 15%-BP/P-BiOCl, (c and d) TEM image of pure P-BiOCl, (e and f) TEM and HRTEM images of 15%-BP/P-BiOCl. | ||
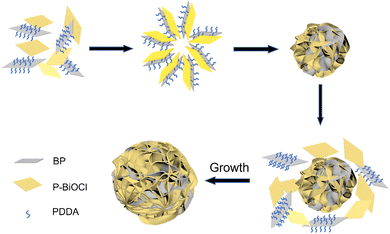
Considering why the addition of PDDA-functionalized BPNs could promote the self-assembly of P-BiOCl into flower-like shapes, the implicit mechanism has aroused our interest. Hence, as shown in Fig. 5, we demonstrated a self-assembly mechanism for the formation of a flower-like heterostructure. Initially, the P-BiOCl nanosheets formed by Bi(NO3)3 and POCl3, P-BiOCl with negative charge and BPNs with positive charge are attracted and stacked like a sandwich structure due to the high concentration of electronegative P-BiOCl.34 As the reaction time increases, the formed sandwich structures continue to absorb each other to form the flower shaped nucleus, resulting in the increasing size and formation of a flower-like structure.23 In the later stages of the reaction, PDDA ensures that it could continue to grow slowly and show high dispersity of the BP/P-BiOCl flower sphere.
As shown in Fig. 6, N2 absorption–desorption isotherms and pore size distribution of P-BiOCl and 15%-BP/P-BiOCl was given. P-BiOCl nanosheets show a BET surface area of 13.4 m2 g−1, while 15%-BP/P-BiOCl with a flower-like structure exhibits a BET surface of 37.1 m2 g−1. The two isotherms display a typical feature of the type IV physisorption isotherm with hysteresis H3 loops, which implies the existence of mesopores formed between the P-BiOCl and BP nanosheets. The pore size distribution of 15%-BP/P-BiOCl and P-BiOCl is shown in the insert of Fig. 6. P-BiOCl displays a peak at about 16 nm, which was attributed to the mesopores of P-BiOCl nanosheets due to the stacking of the nanosheets. It is worth noting that the pore size distribution of 15%-BP/P-BiOCl exhibited three peaks at 14, 22 and 42 nm, which could ascribe to the construction of an interconnected open pore after BP nanosheets coupled with P-BiOCl and the mesopores of P-BiOCl and BP. The result of the N2 absorption–desorption test confirmed that the construction of a flower-like hierarchical structure could increase the specific surface area of the photocatalyst, thus improving photocatalytic activity.35
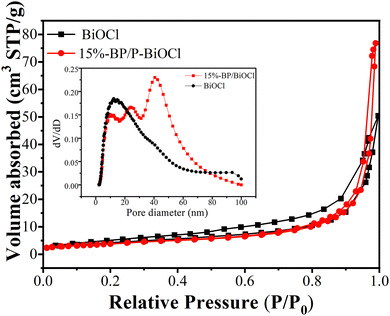 | ||
| Fig. 6 N2 adsorption–desorption isotherm and pore size distribution curves (inset) of P-BiOCl and 15%-BP/P-BiOCl. | ||
The light absorbing properties and bandgaps of BP, P-BiOCl and 15%-BP/P-BiOCl were analysed and calculated by UV–vis diffuse reflectance spectroscopy (DRS). As shown in Fig. 7a, BP shows a very wide absorption, ranging from the UV to NIR region. The P-BiOCl showed UV light absorption while the BP/P-BiOCl nanocomposites displayed UV–visible light absorbability. The P-BiOCl has an absorption edge of approximately 390 nm, and the absorption edge of 15%-BP/P-BiOCl is obviously larger than that of P-BiOCl. This indicates that the absorption capacity is one of the reasons for the enhancement of the photocatalytic ability of P-BiOCl following the addition of BPNs. The bandgap can be calculated using the formula (αhν)n = A(hν − Eg). For the direct band gap semiconductor BP, n = 2. For the indirect band gap semiconductor P-BiOCl, n = 1/2. From Fig. 7(b and c), the band gap energies of BP, BiOCl and P-BiOCl are estimated to be 1.55, 3.27 and 3.04 eV, which demonstrated that P-doping can reduce the bandgap of BiOCl and enhance the light absorbance ability.
 | ||
| Fig. 7 (a) Diffuse reflectance UV–vis DRS spectra of the as-synthesized samples, (b) the corresponding Tauc plot of the BP sample and (c) the corresponding Tauc plot of BiOCl and P-BiOCl samples. | ||
3.2 Photocatalytic activity
Photodegradation of RhB and phenol under simulated solar light was used as the typical reaction to evaluate the photocatalytic performance of BP/P-BiOCl nanocomposites. Colored RhB and colorless phenol organic contaminants were used as desired water-soluble target pollutants for the evaluation of photocatalytic performances of the as-prepared nanocomposites and the reference sample under solar light illumination. As shown in Fig. 8a, the RhB solution was stirred for 30 min in the dark to establish an absorption equilibrium. This result reveals that all BP/P-BiOCl samples show a small RhB absorption ability. Under sunlight irradiation, as shown in Fig. 8a, the blank experiment reveals that RhB is barely decomposed without photocatalysts. The degradation ratio of RhB is 40% and 53% for pure BPNs and P-BiOCl after 160 min of irradiation, respectively. The photocatalytic performance significantly showed improvement after BPNs coupled with P-BiOCl, in which the as-prepared 15%-BP/P-BiOCl showed excellent photocatalytic performance and over 98% of RhB degraded in 60 min. As shown in Fig. S7 (ESI†) compared with 5%-BP/P-BiOCl and 20%-BP/P-BiOCl, 15%-BP/P-BiOCl with a hierarchical and perfect flower-like Z-scheme structure could promote the photocatalytic performance. This result was same with HRTEM as shown in Fig. 4f. Furthermore, the best content of BPNs is 15 wt%. The optimization content of BPNs is in accordance with the other reported photocatalysts, which possibly might arise from 15% BPNs restraining the recombination of the photoinduced charges more effectively.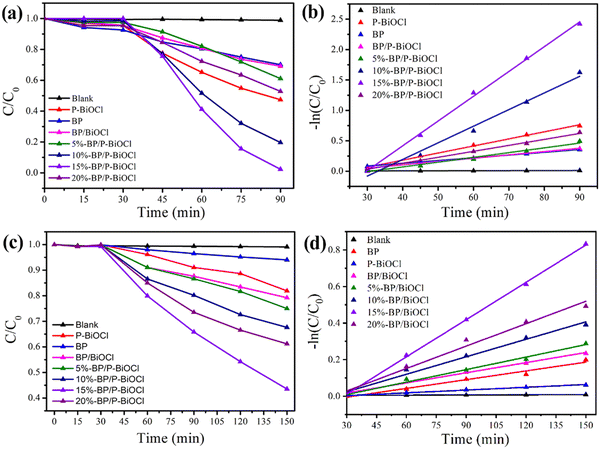 | ||
| Fig. 8 Photocatalytic degradation of RhB and phenol over BPNs, P-BiOCl, BP/BiOCl and BP/P-BiOCl photocatalysts (a and c); kinetic curves of photodegradation of RhB and phenol (b and d). | ||
Meanwhile, the degradation data can be further evaluated by the pseudo first-order kinetic equation, as shown in Fig. 8b. The apparent degradation rate of RhB constant (k) of 15%-BP/P-BiOCl is calculated as 0.0407 min−1, which is 3.9 and 9.6 times greater than that of P-BiOCl (0.011 min−1) and BPNs (0.0045 min−1), respectively. Besides, all the results clearly exhibit that the addition of BPNs can effectively remove RhB as compared to any single catalyst or the composite.
As is known to all, phenol is a refractory pollutant compared with other dye pollutants due to its high oxidation potential for degradation. The phenol oxidation potential (2.21 eV/NHE) is much higher than that of RhB (1.06 eV/NHE). The formation of the Z-scheme could improve redox potentials of photocatalysts, thus enhancing the photocatalytic activity. To confirm the formation of the Z-scheme, the photocatalytic activity was evaluated by photodegradation of phenol under solar light irradiation as shown in Fig. 8c. The degradation ratio of phenol is about 8% and 19% after 120 min of solar light irradiation by BPNs and P-BiOCl, respectively. The as-prepared BP/P-BiOCl samples show enhanced photocatalytic performance. The 15%-BP/P-BiOCl exhibited the best photocatalytic activity; almost 60% of phenol was degraded under solar light irradiation for 120 min. Fig. 8d displays the photodegradation rate of phenol constants. The apparent degradation rate constant of 15%-BP/P-BiOCl is 0.00679 min−1, which is 4.3 and 3.0 times greater than that of BP and P-BiOCl. These results indicated that the Z-scheme heterostructure dramatically enhanced the photocatalytic performance of degradation of phenol by retaining high redox ability and facilitating photoinduced charge carrier separation efficiency.
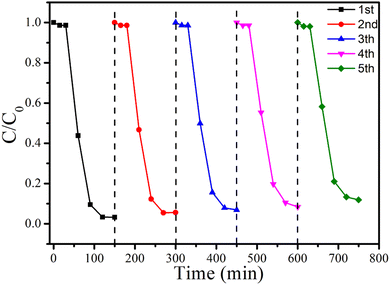
Furthermore, the recyclability and physicochemical stability of 15%-BP/P-BiOCl in the degradation of RhB have been evaluated. In Fig. 9, the recycling experiment is performed over 15%-BP/P-BiOCl, demonstrating that after five cycles of repeated use, a RhB degradation efficiency of 90% is still obtained. This shows that the PDDA-functionalized black phosphorus nanosheets have good stability, which contributes to the stability of this composite photocatalyst.36 Besides, the physicochemical properties of the reused 15%-BP/P-BiOCl have been characterized by TEM and XRD (Fig. S8, ESI†), and no obvious variations are found in them.
The photocatalytic Cr(VI) removal of the as-fabricated samples was also assessed under simulated sun light irradiation. As displayed in Fig. 10a, under simulated sun light irradiation, the Cr(VI) solution was barely degraded without a photocatalyst. The removal ratio of pure BPNs and P-BiOCl is 18% and 15%, respectively. Furthermore, under the same experimental condition, the BP/P-BiOCl composites exhibited better photocatalytic performance than BPNs and P-BiOCl. The degradation rate of Cr(VI) is illustrated in Fig. 10b. Moreover, the 15%-BP/P-BiOCl photocatalyst shows the best photocatalytic activity and almost 90% of Cr ions are removed within 60 min under sunlight irradiation. The photodegradation rate of 15%-BP/P-BiOCl is 0.03729 min−1, which is the highest photocatalytic rate among BP/P-BiOCl composites.
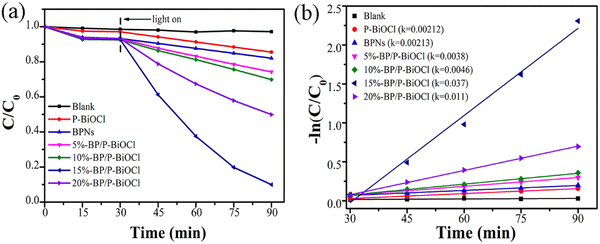 | ||
| Fig. 10 (a) Photodegradation curves of Cr(VI) over pure BPNs, P-BiOCl and BP/P-BiOCl hybrid photocatalysts, (b) kinetic curves for the photodegradation of Cr(VI). | ||
3.3 Photocatalytic mechanism
In order to elucidate the photocatalytic mechanism of the 15%-BP/P-BiOCl nanocomposites, active species capture experiments were conducted. EDTA–2Na, AgNO3, IPA and BQ were used as hole (h+), electron (e−), superoxide radical (˙O2−) and hydroxyl radical (˙OH) capture agents. For the photodegradation of RhB, after adding BQ, as shown in Fig. 11a, the photodegradation ratio has dramatically dropped from 95.7% to 15.8%, which indicates that ˙O2− was the most active species during photocatalytic degradation. Similarly, the photodegradation ratio decreased from 95.7% to 31.6% and 40% by adding EDTA–2Na and IPA in the photocatalytic reaction. The results reveal that ˙O2− plays an important role in the photocatalytic irradiation reaction, where holes and ˙OH also have some influence on degradation. Therefore, holes, ˙OH and ˙O2− together exert an important effect on the removal of organic pollutants. Fig. 11b shows the photocatalytic phenol degradation curves of 15%-BP/P-BiOCl without scavengers and containing the scavengers of ˙OH and ˙O2−. As shown in Fig. 10b, the photocatalytic phenol degradation activity significantly decreased after adding BQ and IPA as scavengers. The presence of IPA dramatically decreased the photocatalytic performance of phenol. After 90 min of irradiation, only 15% of phenol was degraded under solar light irradiation, indicating that ˙OH is the main active species in the phenol degradation reaction. Similarly, the photocatalytic activity decreased after adding BQ as an ˙O2− scavenger, indicating that ˙O2− is responsible for phenol degradation. Therefore, the experimental results demonstrate that the phenol degradation is caused by the photogenerated ˙O2− and ˙OH radicals, and ˙OH is the main active radical to catalyse the ring-opening reactions of phenol and finally mineralize phenol into carbon dioxide and water. Meanwhile, the active species trapped experiment was performed as shown in Fig. 11c. The photocatalytic reduction of Cr(VI) displays a significant decrease after adding AgNO3. This results in the formation of major active species that could be photogenerated electrons. Compared with the controlled experiment (scavenger-free reaction), the photo-reduction efficiencies were slightly improved after the addition of EDTA. This phenomenon can be attributed to the capturing of h+ to restrain the recombination of e−/h+ pairs, thus more e− could participate in the reduction reaction. | ||
| Fig. 11 (a) Photocatalytic performance of 15%-BP/P-BiOCl with different scavengers over RhB (a), phenol degradation (b) and Cr(VI) reduction (c) under solar light irradiation. | ||
In order to investigate the photogenerated carrier separation efficiency, the transient photocurrent response analysis was carried out (Fig. 12a). At each on/off cycle of solar light irradiation, the rapid and high intensity photocurrent response of the 15%-BP/P-BiOCl photocatalyst can be clearly observed. The pristine BP and P-BiOCl showed low intensity photocurrent response owing to the quick photoinduced carrier recombination. Thus, the enhanced photocurrent under solar light irradiation in the 15%-BP/P-BiOCl composites proves that the addition of BPNs not only improved the light absorption but also formed a heterojunction at the interface of BP and P-BiOCl, which enhanced the utilization ratio of light and simultaneously facilitated the separation efficiency of the photogenerated carriers in BP/P-BiOCl composites.37 Electrochemical impedance spectroscopy (EIS) measurements can further support the results. As shown in Fig. 12b, the smallest EIS Nyquist plot semicircle is observed for the 15%-BP/P-BiOCl photocatalyst under solar light irradiation, demonstrating the fast interfacial charge migration between BPNs and P-BiOCl.38
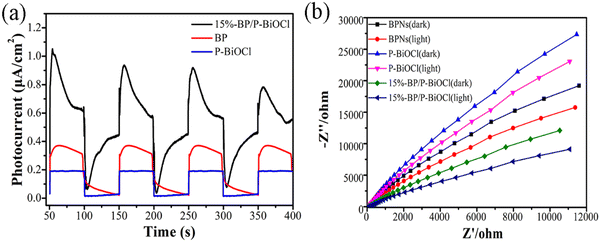 | ||
| Fig. 12 (a) Photocurrent response of pure P-BiOCl, BPNs and BP/P-BiOCl nanocomposites, (b) electrochemical impedance spectral Nyquist plots. | ||
According to the above analysis, we concluded that the 15%-BP/P-BiOCl photocatalyst shows a higher separation efficiency of electron–hole pairs than any single component catalyst or composites with different content, thus leading to its remarkable photocatalytic performance. To confirm this conclusion, the photoluminescence (PL) analyses were performed to investigate the actual separation and transportation behaviours of the photoexcited carriers in these samples. Fig. 13a represents the PL spectra of BPNs, P-BiOCl and BP/P-BiOCl nanocomposites at an excitation wavelength of 235 nm. The highest PL peaks of P-BiOCl indicated the fast photoinduced charge carrier recombination. When BPNs were coupled with P-BiOCl to form BP/P-BiOCl hybrids, the PL intensity obviously decreases, indicating that the heterostructure can accelerate the separation of photoinduced carriers. The 15%-BP/P-BiOCl sample exhibited the lowest PL intensity among all the as-prepared samples, revealing the best separation efficiency of the photoinduced carriers. The effective separation of the photogenerated electron–hole pairs can be attributed to the heterostructure of BPNs and P-BiOCl, which can create an internal electric field from BP to P-BiOCl at the interface of heterostructures. This internal electric field promotes the photoinduced electron transfer from P-BiOCl to BP. Moreover, the lifetime of the photoinduced electron–hole pairs was measured by time-resolved Pl spectra (Fig. 13b). The photoluminescence decay curves could be well fitted using the triexponential model, and the calculated average lifetimes of BiOCl, P-BiOCl and 15%-BP/P-BiOCl are 2.95, 3.43 and 9.09 ns, respectively. The prolonged average decay time of P-BiOCl and 15%-BP/P-BiOCl demonstrated that photoinduced carriers enhance the possibility of participating in the photocatalytic reaction before recombination.9
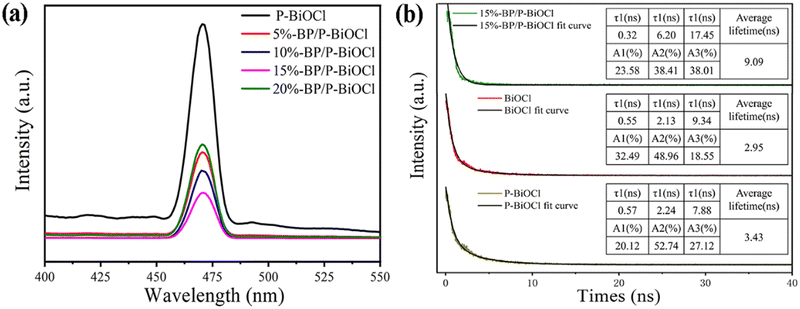 | ||
| Fig. 13 (a) PL spectra of BPNs, P-BiOCl and BP/P-BiOCl nanocomposites and (b) time-resolved PL spectra of BiOCl, P-BiOCl and 15%-BP/P-BiOCl. | ||
As reported in the literature, a desirable engineering for enhancing the photocatalytic activity is to narrow the band gap by the introduction of discrete mid-gap states between the valence and conduction bands.4 This narrowing of the band gap can be due to the shift of the edges of the VB and/or CB. The XPS valence band spectra were recorded to determine the VB position of BiOCl and P-BiOCl samples. The VB position of BiOCl and P-BiOCl is measured and calculated by the equation: EVB·NHE = φ + EVBXPS − 0.44, where φ is the work function of the XPS analyzer and the value is 0.5 eV. The value of the VB is 2.93 eV for P-BiOCl and 3.12 eV for the BiOCl sample (Fig. S9, ESI†). Meanwhile, in P-doped BiOCl, new mid-gaps are observed, and the valence band is contributed by a hybrid of mostly 3p orbitals of the phosphorus atom, O 2p, Cl 2p, Bi 6p and small hybridizations of Bi 6s states, which essentially works to introduce sub-levels and narrow the band gap.39 It can be explained as the difference in electronegativity of P, Cl and O elements, leading to different p states. The phosphorus atom has three unpaired electrons with P 3p character which can be hybridized with its neighboring O 2p and Cl 2p states.40
To confirm the charge transfer route, the photodeposition of Pt and MnO2 nanoparticles was executed for 15%-BP/P-BiOCl. Generally, Pt nanoparticles, reduced from H2PtCl6 by accepted electrons, can be used for the characterization of photogenerated electron flow, and MnO2, oxidized from MnCl2 by accepting the hole, characterizes the hole transfer route.41–43Fig. 14 illustrates the TEM images of photodeposition of MnO2 nanoparticles on 15%-BP/P-BiOCl. Fig. 14b clearly exhibits two connected particles with lattice fringe spacings of 0.225 and 0.24 nm and are observed in the HRTEM images. They are assigned to the (110) plane of P-BiOCl and the (101) plane of MnO2, indicating that the MnO2 nanoparticles were photodeposited onto the P-BiOCl nanosheets. This implies hole transfer from P-BiOCl to MnO2. Fig. 14(c and d) gives the TEM images of Pt nanoparticle deposition. The HRTEM images show that the lattice fringe space is 0.225 nm, corresponding to the (111) plane of Pt. Also, there is a 0.26 nm lattice fringe space corresponding to the (040) plane of BP, indicating that the Pt nanoparticles were directly deposited onto BP. This implies that the electron transfers from BP to Pt nanoparticles. Hence, these results illustrate that reduction was happening only in BP and the oxidation reaction was taking place only in P-BiOCl.
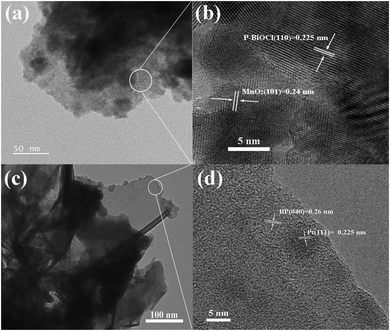 | ||
| Fig. 14 Charge transfer route of 15%-BP/P-BiOCl. TEM and HRTEM images of the photodeposited MnO2 nanoparticles (a and b) and Pt nanoparticles (c and d). | ||
On the basis of aforementioned analysis, a plausible mechanism for the enhanced photodegradation of 15%-BP/P-BiOCl is proposed (Scheme 2). All the results presented above indicate that the photocatalytic mechanism proceeds through the S-scheme and not through the type II charge transfer route. According to the UV–vis spectrum, we can find the Eg of BP and P-BiOCl to be 1.55 eV and 3.04 eV, respectively. The value of the VB is 2.93 eV for the P-BiOCl sample (Fig. S9, ESI†). The electron in the VB of P-BiOCl can easily be transferred to the P-doping energy level and then excited by solar light irradiation and injected to the CB of P-BiOCl. The P-doping has significantly changed the electron structure of BiOCl with the wider light absorption range and fast carrier separation efficiency. To prove the construction of the S-scheme heterojunction, the photodegradation of phenol was measured.44 Under solar light irradiation, photogenerated electrons and holes are formed on both P-BiOCl and BPNs. Unlike conventional heterostructure photocatalysts, the electrons in the CB of P-BiOCl (−0.11 eV) are not strong enough to generate ˙O2−, which has a more positive potential than the redox potential (O2/˙O2− = −0.33 eV). Conversely, holes on the VB of BPNs (1.0 eV) possess a more negative potential than the redox potential (OH−/˙OH = 2.28 eV).45 An S-scheme charge transfer mechanism is proposed.20 Due to the significant difference of the work function between BP and P-BiOCl, the electron in BP gets transferred to P-BiOCl, thus creating an internal electric field. The electrons in the CB of P-BiOCl move to the VB of BP and combine with the holes due to the influence of the internal electric field. The electrons in the CB of BP are strong enough to reduce O2 to ˙O2− and the ˙O2− further oxidizes the pollutants like RhB dye.45,46 Furthermore, ˙OH is generated by holes with H2O which still remain in the P-BiOCl, and ˙OH could oxidize pollutants like phenol. In the RhB and phenol degradation reaction, the ˙O2− and ˙OH are major active species. These results are consistent with the data in the trapping experiment.
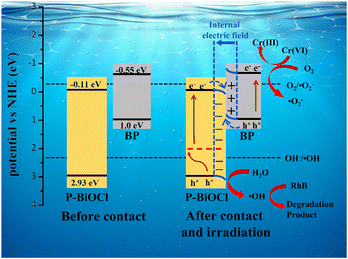 | ||
| Scheme 2 S-scheme photocatalytic mechanism of RhB degradation by BP/P-BiOCl nanocomposites under sun light irradiation. | ||
Besides, we propose a possible mechanism of Cr(VI) reduction according to the above experimental results. Under solar light illumination, BPNs and P-BiOCl can be easily excited and generate photoinduced electron–hole pairs. Therefore, compared to the potential of the Cr(VI)/Cr(III) (0.51 eV/NHE), electrons in the BPNs CB can reduce the Cr(VI) ions due to a more negative potential (−0.55 eV).47 So, it is known that the photoinduced electron plays an important role in the Cr(VI) reduction reaction. The enhancement in degradation of RhB and Cr(VI) reduction, especially, hard-degradable phenol is benefitted from the S-scheme configuration and the close contact between BPNs and P-BiOCl allowing for highly efficient electron transfer and charge transportation.
4. Conclusion
In this study, a S-scheme heterojunction with an electrostatically derived combination of PDDA-functionalized BPNs and P-BiOCl was fabricated for the first time. The photocatalytic performance of the BP/P-BiOCl photocatalyst is significantly enhanced during the process of degradation of RhB and Cr(VI) under solar light irradiation. 15%-BP/P-BiOCl showed the best photocatalytic activity, which is 9.6 and 3.5 times that of BPNs and P-BiOCl in the degradation of RhB, 12.1 and 12.3 times that of BPNs and P-BiOCl in the removal of Cr(VI) ions. The improved photocatalytic performance can be attributed to the S-scheme bandgap configuration, the enhanced light absorption due to flower-like morphology and P-doped BiOCl, the reinforced electron migration due to the strong intercalation of BP and P-BiOCl nanosheets. Furthermore, the S-scheme structure was confirmed by XPS spectra and photodegradation of phenol. In particular, due to the passivation effect of PDDA, the nanocomposite can maintain high photostability during multiple cycles of degradation. This work provides a new strategy for the development of functionalized BP-based nanocomposites in environmental demands.Conflicts of interest
There are no conflicts to declare.Acknowledgements
This study was financially supported by the Natural Science Foundation of China under Grant no. 10972025.References
- K. Wenderich and G. Mul, Chem. Rev., 2016, 116, 14587–14619 CrossRef CAS PubMed.
- J. Di, J. Xia, M. Ji, B. Wang, S. Yin, Q. Zhang, Z. Chen and H. Li, ACS Appl. Mater. Interfaces, 2015, 7, 20111–20123 CrossRef CAS PubMed.
- W. Cai, J. Tang, Y. Shi, H. Wang and X. Jiang, ACS Omega, 2019, 4, 22187–22196 CrossRef CAS PubMed.
- X. Yang, S. Sun, J. Cui, M. Yang, Y. Luo and S. Liang, Cryst. Growth Des., 2021, 21, 6576–6618 CrossRef CAS.
- J. Cao, J. Li, W. Chu and W. Cen, Chem. Eng. J., 2020, 400, 125813 CrossRef CAS.
- C. Yu, H. He, Q. Fan, W. Xie, Z. Liu and H. Ji, Sci. Total Environ., 2019, 694, 133727 CrossRef CAS PubMed.
- Z. Han, J. Wang, L. Liao, H. Pan, S. Shen and J. Chen, Appl. Surf. Sci., 2013, 273, 349–356 CrossRef CAS.
- Z. Khazaee, A. R. Mahjoub, A. H. C. Khavar, V. Srivastava and M. Sillanpää, Sol. Energy, 2020, 207, 1282–1299 CrossRef CAS.
- J. Cao, W. Cen, Y. Jing, Z. Du, W. Chu and J. Li, Chem. Eng. J., 2022, 435, 134683 CrossRef CAS.
- G. Qu, T. Xia, W. Zhou, X. Zhang, H. Zhang, L. Hu, J. Shi, X. F. Yu and G. Jiang, Chem. Rev., 2020, 120, 2288–2346 CrossRef CAS PubMed.
- F. Xia, H. Wang and Y. Jia, Nat. Commun., 2014, 5, 4458 CrossRef CAS PubMed.
- M. Luo, T. Fan, Y. Zhou, H. Zhang and L. Mei, Adv. Funct. Mater., 2019, 29, 1808306 CrossRef.
- J. He, D. He, Y. Wang, Q. Cui, M. Z. Bellus, H.-Y. Chiu and H. Zhao, ACS Nano, 2015, 9, 6436–6442 CrossRef CAS PubMed.
- H. Wang, S. Jiang, W. Shao, X. Zhang, S. Chen, X. Sun, Q. Zhang, Y. Luo and Y. Xie, J. Am. Chem. Soc., 2018, 140, 3474–3480 CrossRef CAS PubMed.
- Q. Zhou, Q. Chen, Y. Tong and J. Wang, Angew. Chem., Int. Ed., 2016, 55, 11437–11441 CrossRef CAS PubMed.
- S. Thurakkal, D. Feldstein, R. Perea-Causín, E. Malic and X. Zhang, Adv. Mater., 2021, 33, 2005254 CrossRef CAS PubMed.
- W. Lei, T. Zhang, P. Liu, J. A. Rodriguez, G. Liu and M. Liu, ACS Catal., 2016, 6, 8009–8020 CrossRef CAS.
- Z. Shen, S. Sun, W. Wang, J. Liu, Z. Liu and J. C. Yu, J. Mater. Chem. A, 2015, 3, 3285–3288 RSC.
- M. Zhu, S. Kim, L. Mao, M. Fujitsuka, J. Zhang, X. Wang and T. Majima, J. Am. Chem. Soc., 2017, 139, 13234–13242 CrossRef CAS PubMed.
- Q. Xu, L. Zhang, B. Cheng, J. Fan and J. Yu, Chem, 2020, 6, 1543–1559 CAS.
- X. Lian, W. Xue, S. Dong, E. Liu, H. Li and K. Xu, J. Hazard. Mater., 2021, 412, 125217 CrossRef CAS PubMed.
- L. Wang, B. Cheng, L. Zhang and J. Yu, Small, 2021, 17, 2103447 CrossRef CAS PubMed.
- Y. Guan, J. Wu, X. Man, Q. Liu, Y. Qi, P. He and X. Qi, Chem. Eng. J., 2020, 396, 125234 CrossRef CAS.
- R. Jiang, G. Lu, M. Nkoom, Z. Yan, D. Wu, J. Liu and T. Dang, Chem. Eng. J., 2020, 400, 125931 CrossRef.
- S. M. Ghoreishian, K. S. Ranjith, B. Park, S.-K. Hwang, R. Hosseini, R. Behjatmanesh-Ardakani, S. M. Pourmortazavi, H. U. Lee, B. Son, S. Mirsadeghi, Y.-K. Han and Y. S. Huh, Chem. Eng. J., 2021, 419, 129530 CrossRef CAS.
- L. Qin, S. Zhao, C. Fan and Q. Ye, RSC Adv., 2021, 11, 18565–18575 RSC.
- H. Li, Z. Liang, Q. Deng, M. T. Hu, N. Du and W. Hou, ChemCatChem, 2019, 11, 1633–1642 CrossRef CAS.
- X. Li, J. Xiong, X. Gao, J. Ma, Z. Chen, B. Kang, J. Liu, H. Li, Z. Feng and J. Huang, J. Hazard. Mater., 2020, 387, 121690 CrossRef CAS PubMed.
- R. Jing, J. Yang, S. Li, S. Zhao, P. Wang, Y. Liu, A. Liu, Z. Meng, H. Huang, Z. Zhang and Q. Zhang, J. Colloid Interface Sci., 2020, 576, 34–46 CrossRef CAS PubMed.
- S. Li, P. Wang, H. Zhao, R. Wang, R. Jing, Z. Meng, W. Li, Z. Zhang, Y. Liu, Q. Zhang and Z. Li, Colloids Surf., A, 2021, 612, 125967 CrossRef CAS.
- T. Nilges, M. Kersting and T. Pfeifer, J. Solid State Chem., 2008, 181, 1707–1711 CrossRef CAS.
- Y. Deng, L. Tang, G. Zeng, Z. Zhu, M. Yan, Y. Zhou, J. Wang, Y. Liu and J. Wang, Appl. Catal., B, 2017, 203, 343–354 CrossRef CAS.
- A. E. Del Rio Castillo, V. Pellegrini, H. Sun, J. Buha, D. A. Dinh, E. Lago, A. Ansaldo, A. Capasso, L. Manna and F. Bonaccorso, Chem. Mater., 2018, 30, 506–516 CrossRef CAS.
- X. Pan, C. Shang, Z. Chen, M. Jin, Y. Zhang, Z. Zhang, X. Wang and G. Zhou, Nanomaterials, 2019, 9, 1266 CrossRef CAS PubMed.
- Y. Gui, Z. Liu, S. Fang, J. Tian and F. Gong, J. Mater. Sci.: Mater. Electron., 2015, 27, 2890–2895 CrossRef.
- Y. Wang, Z. Zhang, L. Zhang, Z. Luo, J. Shen, H. Lin, J. Long, J. C. S. Wu, X. Fu, X. Wang and C. Li, J. Am. Chem. Soc., 2018, 140, 14595–14598 CrossRef CAS PubMed.
- Q. Feng, H. Liu, M. Zhu, J. Shang, D. Liu, X. Cui, D. Shen, L. Kou, D. Mao, J. Zheng, C. Li, J. Zhang, H. Xu and J. Zhao, ACS Appl. Mater. Interfaces, 2018, 10, 9679–9687 CrossRef CAS PubMed.
- S. Tian, Y. F. Ding, M. Q. Cai, L. Chen, C. T. Au and S. F. Yin, Phys. Chem. Chem. Phys., 2021, 23, 17894–17903 RSC.
- J. Guo, X. Liao, M.-H. Lee, G. Hyett, C.-C. Huang, D. W. Hewak, S. Mailis, W. Zhou and Z. Jiang, Appl. Catal., B, 2019, 243, 502–512 CrossRef CAS.
- W. L. Huang, J. Comput. Chem., 2009, 30, 1882–1891 CrossRef CAS PubMed.
- P. Wang, H. Zhao, S. Li, R. Jing, Y. Liu, N. Jiang, F. Bian, Y. Liu, H. Liu and Q. Zhang, J. Mater. Sci., 2021, 56, 8060–8078 CrossRef CAS.
- B. Wang, S. Shen and L. Guo, Appl. Catal., B, 2015, 166-167, 320–326 CrossRef CAS.
- Y. Gong, J. Shen, Y. Zhu, W. Yan, J. Zhu, L. Hou, D. Xie and C. Li, Appl. Surf. Sci., 2021, 545, 149012 CrossRef CAS.
- W. Jiang, X. Zong, L. An, S. Hua, X. Miao, S. Luan, Y. Wen, F. F. Tao and Z. Sun, ACS Catal., 2018, 8, 2209–2217 CrossRef CAS.
- W. Zhang, A. R. Mohamed and W.-J. Ong, Angew. Chem., Int. Ed., 2020, 59, 22894–22915 CrossRef CAS PubMed.
- Q. Li, Z. Guan, D. Wu, X. Zhao, S. Bao, B. Tian and J. Zhang, ACS Sustainable Chem. Eng., 2017, 5, 6958–6968 CrossRef CAS.
- X. Zhang, Y. Wang, F. Hou, H. Li, Y. Yang, X. Zhang, Y. Yang and Y. Wang, Appl. Surf. Sci., 2017, 391, 476–483 CrossRef CAS.
Footnote |
| † Electronic supplementary information (ESI) available. See DOI: https://doi.org/10.1039/d2ma00290f |
| This journal is © The Royal Society of Chemistry 2022 |

