 Open Access Article
Theoretical investigation of the mechanism of phospholipid extraction from the cell membrane using functionalized graphene quantum dots
Peng-Zhen
Zhang†
a,
Fang-Fang
Jiao†
b,
Zhe-Xing
Xie
c,
Zhe
Kong
 *ad,
Wei
Hu
*b,
Jia-Wei
Shen
 e and
Li-Jun
Liang
 *c
*c
aCenter for Advanced Optoelectronic Materials, College of Materials and Environmental Engineering, Hangzhou Dianzi University, Hangzhou, 310018, China. E-mail: zhekong@hdu.edu.cn; Fax: +86 571 87713538
bShandong Provincial Key Laboratory of Molecular Engineering, School of Chemistry and Pharmaceutical Engineering, Qilu University of Technology (Shandong Academy of Sciences), Jinan 250353, China. E-mail: weihu@qlu.edu.cn
cCollege of Accounting, Hangzhou Dianzi University, Hangzhou, 310018, China. E-mail: michael.lijunl@gmail.com
dKey Laboratory of Novel Materials for Sensor of Zhejiang Province, College of Materials and Environmental Engineering, Hangzhou Dianzi University, Hangzhou, 310018, China
eCollege of Pharmacy, School of Medicine, Hangzhou Normal University, Hangzhou, 311121, China
First published on 24th May 2022
Abstract
Since their discovery as one of the most promising materials in the 21st century, nanomaterials have been widely studied by the scientific community, where their biosafety remains the most concerning issue. Therefore, understanding the interactions between nanomaterials and living organisms is important. In this study, the mechanism of phospholipid extraction from cell membranes using graphene quantum dots (GQDs) and graphene oxide quantum dots (GOQDs) was investigated through molecular dynamics (MD) simulations. Our simulation results showed that GQDs can rapidly extract phospholipid molecules from the cell membrane. However, for GOQDs, the ability to extract phospholipid molecules from the cell membrane is weak due to the presence of hydrophilic hydroxyl groups. According to our density functional theory (DFT) calculations, the binding energy of water molecules to GOQDs is strong, and it is difficult for phospholipid molecules to climb up GOQDs through dehydration.
1. Introduction
Nanomaterials are a new type of material having excellent properties such as interface effects, small size effects, and quantum size effects.1–6 Thus, nanomaterials have broad application prospects in many fields, especially optics, electronics, and aerospace, among others.7–10 Similarly, nanomaterials play an important role in biomedicine, especially in biosensors, gene delivery, and tumor therapy.11–13 Carbon-based nanomaterials have been widely studied for many years.14,15 All organisms are made up of carbon-based compounds, which play an important role in metabolism. Therefore, exploring the interaction between carbon nanomaterials and different organisms can better elucidate the potential toxicity of carbon nanomaterials.16,17As a new two-dimensional nanomaterial, graphene has attracted widespread attention since its discovery.18 It has significant potential applications in medicine, especially in drug delivery,19,20 disease diagnosis,21 and medical imaging.22 Graphene quantum dots (GQDs) are quasi-zero-dimensional nanomaterials made of graphene that have a size of less than 100 nanometers.23 Since they are derived from graphene, GQDs inherit many of its properties, such as excellent photoelectric properties, low toxicity, good biocompatibility, and stability.24 Moreover, GQDs also show strong quantum confinement and edge effects, which make them suitable for potential applications in many fields.25 Similar to GQDs, graphene oxide quantum dots (GOQDs), the oxides of GQDs, maintain the layered structure of graphite after oxidation, but with the introduction of many oxygen functional groups into its layers. The presence of hydrophilic hydroxyl groups makes the structure of graphene more complex and allows it to acquire new properties. For example, GOQDs have excellent conductivity, thermal conductivity, and photochemical properties, which can be used in biosensors, imaging technology, and energy storage catalytic devices.26–28
In recent studies, GOQDs were found to have poor stability under physiological conditions and a lack of targeting ability and were easily cleared via systemic circulation.29 In addition, the sharp edges of GOQDs can easily cause mechanical damage to cells.30 Xie et al. found that GOQDs nanocarriers modified with erythrocyte membranes have improved stability and hemolytic performance, which is conducive for applications in biomedicine.31 Sun et al. showed that GOQDs could alleviate the ethanol-induced decline in cell viability and could be used as nano-enzymes to accelerate the catalysis of ethanol, thus avoiding the accumulation of toxic products in cells.32 However, our understanding of the microscopic mechanisms of GQDs cell interactions is still limited. Molecular dynamics (MD) simulations,33 a new analytical method in addition to theoretical calculations and experimental analysis, allows the observation and analysis of complex biomolecular dynamic problems from an atomic point of view.34,35 Recent studies have found that GQDs can inhibit the fibrosis of α-syn protein and interact with mature fibrils to trigger their decomposition, which provides new insights for drug development in Parkinson's disease.36 Duan et al. found, through experiments and kinetic simulations, that GQDs and GOQDs can induce the formation of cell membrane pores, which highlights another cytotoxic mechanism of graphene.37
As one of the important theories of cytotoxicity, the theory of phospholipid molecular extraction of nanomaterials has attracted widespread attention in the scientific field, among which graphene is the most representative.38–40 The strong hydrophobic interaction between the lipid molecules and graphene is called “nanoscale dewetting”.41–43 In related studies, graphene has a unique sp2 two-dimensional structure, which contributes to the strong interaction between graphene and membrane lipids, which may extract phospholipid molecules from the cell membrane and lead to cell apoptosis. However, there are few studies on the influence of the degree of oxidation of GOQDs on their interaction with the cell membrane, and it is not clear whether the change of oxidation degree will affect the adsorption of phospholipid molecules on the cell membrane. As a simulation method closest to experimental conditions, molecular dynamics (MD) simulation has been widely used to study complex bio-nanotechnology.44,45 In particular, it is widely used in the interaction between nanomaterials and biological macromolecules.46 For example, MD can not only be used to study the damage mechanism of nanometers to proteins, but also provide the atomic details of nanoparticles translocation through lipid membrane.47,48 In this study, we study the all-atom MD simulation of the process of GQDs and cell membranes in aqueous solution, to force constraints on GQDs to explore the extraction of phospholipid molecules. In addition, we used a combination of MD simulation and density functional theoretical (DFT) calculation methods to explore the adsorption of cell membrane phospholipid molecules on GQDs and GOQDs with different degrees of oxidation.
2. Computational details
2.1 System setup
As in our previous work,49,50 the initial GQDs were set on the x–y plane. To obtain GQDs with different degrees of oxidation, as shown in Fig. 1, a visual molecular dynamics (VMD) software program was used to randomly add hydroxyl groups.51 To better compare the effects of the oxidized side and the unoxidized side of a single GOQDs on the adsorption of phospholipid molecules, we set all oxidation groups of GQDs on one side. GOQDs are named after the number of hydroxyl groups: from GOQD21 (4.3% oxidation ratio), GOQD42 (8.8% oxidation ratio), GOQD84 (17.5% oxidation ratio), GOQD125 (26.2% oxidation ratio), and GOQD158 (33% oxidation ratio), where the initial graphene quantum dots were defined as GQDs. The edges of the quantum dots were saturated with hydrogen atoms, and all quantum dots have dimensions of 3.38 × 3.24 nm. The initial structure of the 1-palmitoyl-2-oleoyl-glycero-3-phosphatedylcholine (POPC) cell membrane was derived from our previous work.42 A total of 256 phospholipid molecules were divided into upper and lower layers, and the specific simulation details are listed in Table 1. Firstly, the POPC membrane was balanced in NPT ensemble solution, and the membrane structure was used as the adsorption surface of GQDs. GQDs with different oxidation degrees were fixed on the top of the POPC membrane, 4.5 nm away from the centroid of the cell membrane, and water molecules were added to each system. Before the simulation, all GQDs systems undergo 50![[thin space (1/6-em)]](https://www.rsc.org/images/entities/char_2009.gif) 000 steps of energy minimization, 1 ns NVT simulation pre balance, and finally 300 ns NPT simulation. As shown in Fig. 2a, the size of the simulated water tank is 9.40 nm × 9.30 nm × 14.28 nm. GQDs and POPC were placed in the water tank, and a TIP3P water dissolution system was used.52 All GQDs, GOQDs, and POPC were placed in the water tank. Each system was independently simulated three times.
000 steps of energy minimization, 1 ns NVT simulation pre balance, and finally 300 ns NPT simulation. As shown in Fig. 2a, the size of the simulated water tank is 9.40 nm × 9.30 nm × 14.28 nm. GQDs and POPC were placed in the water tank, and a TIP3P water dissolution system was used.52 All GQDs, GOQDs, and POPC were placed in the water tank. Each system was independently simulated three times.
| System | Number of OH | Oxidation degree (%) | Number of atoms | Time (ns) | Repeat times |
|---|---|---|---|---|---|
| GQDs | 0 | 0 | 126![[thin space (1/6-em)]](https://www.rsc.org/images/entities/char_2009.gif) 405 405 |
300 | 3 |
| GOQD21 | 21 | 4.3 | 124![[thin space (1/6-em)]](https://www.rsc.org/images/entities/char_2009.gif) 608 608 |
300 | 3 |
| GOQD42 | 42 | 8.8 | 126![[thin space (1/6-em)]](https://www.rsc.org/images/entities/char_2009.gif) 420 420 |
300 | 3 |
| GOQD84 | 84 | 17.5 | 126![[thin space (1/6-em)]](https://www.rsc.org/images/entities/char_2009.gif) 459 459 |
300 | 3 |
| GOQD125 | 125 | 26.2 | 126![[thin space (1/6-em)]](https://www.rsc.org/images/entities/char_2009.gif) 508 508 |
300 | 3 |
| GOQD158 | 158 | 33 | 126![[thin space (1/6-em)]](https://www.rsc.org/images/entities/char_2009.gif) 562 562 |
300 | 3 |
 | ||
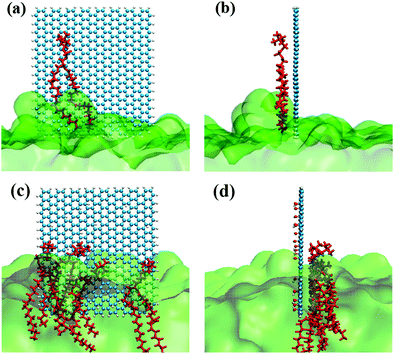
| Fig. 2 (a) Schematic structure of GQDs. (b) Schematic structure of GOQD21. (c) Side view of the GQDs intruding into the membrane. (d) Side view of GOQD21 intruding into the membrane. | ||
2.2 MD simulations
In the simulations, the parameters of the Charmm36 force field were selected and used in the Gromacs5.0 software package.53 For the GQDs, the charge of the outermost hydrogen atom and the carbon atom connected to the hydrogen atom were +0.115e and −0.115e, respectively, and the charge of the carbon atom farthest away from the edge was set to zero, as described previously.54 In contrast to GQDs, because GOQDs contain carbon atoms modified by hydroxyl groups, the carbon atom has a +0.439e charge, while the oxygen atom and hydrogen atom connected with the carbon atom have charges of −0.619e and +0.18e, respectively. The harmonic band potential, harmonic angle, harmonic dihedral angle, and Lennard-Jones (LJ) parameters of the GQDs and GOQDs were taken from the literature.54 These parameters have been successfully used in our previous work and by other groups.49,55 The Nose–Hoover constant temperature method was used in the simulation to maintain the temperature at 310 K, and the pressure was maintained at 1 bar by a semi-isotropic Parrinello–Rahman pressure regulator. All chemical bonds, including those connected to H atoms, use the LINCS algorithm to constrain the bond length and the bond angle.56 To constrain the positions of the GQDs and GOQDs in the simulation process, a force of 3000 kJ mol−1 was applied in all three directions. The nonbonded van der Waals (vdW) interaction was set to 1.2 nm, and the simulation results were saved every 2 fs.2.3 DFT calculations
The composite structure of GQDs (GOQDs) and water were simulated at the density functional theory (DFT) level using the Gaussian 09 program. A GQDs (GOQDs) layer with the edges saturated with hydrogen atoms was selected to cover the water molecule. Then we optimized the geometries of the composite structure at the B3LYP57/6-311G(d,p) level. The DFT-D358 method was used to consider the vdW interactions. During geometrical optimization, the GQDs (GOQDs) layer was frozen. Then the GQDs (GOQDs) layer and the water were extracted from the optimized structure to calculate the single-point energy. The binding energy was calculated as follows:| ΔE = Esub+mol − Esub − Emol |
| System | Number of atoms | GQDs![[thin space (1/6-em)]](https://www.rsc.org/images/entities/char_2009.gif) : :![[thin space (1/6-em)]](https://www.rsc.org/images/entities/char_2009.gif) water (POPC) water (POPC) |
Oxidation ratio |
|---|---|---|---|
| GQDs–water | 39 | 1![[thin space (1/6-em)]](https://www.rsc.org/images/entities/char_2009.gif) : :![[thin space (1/6-em)]](https://www.rsc.org/images/entities/char_2009.gif) 1 1 |
0 |
| GOQDs–water | 43 | 1![[thin space (1/6-em)]](https://www.rsc.org/images/entities/char_2009.gif) : :![[thin space (1/6-em)]](https://www.rsc.org/images/entities/char_2009.gif) 1 1 |
8% |
3. Results and discussion
3.1 Translocation phenomenon
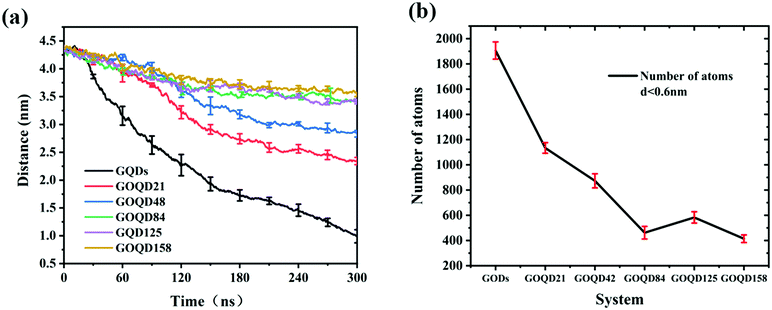
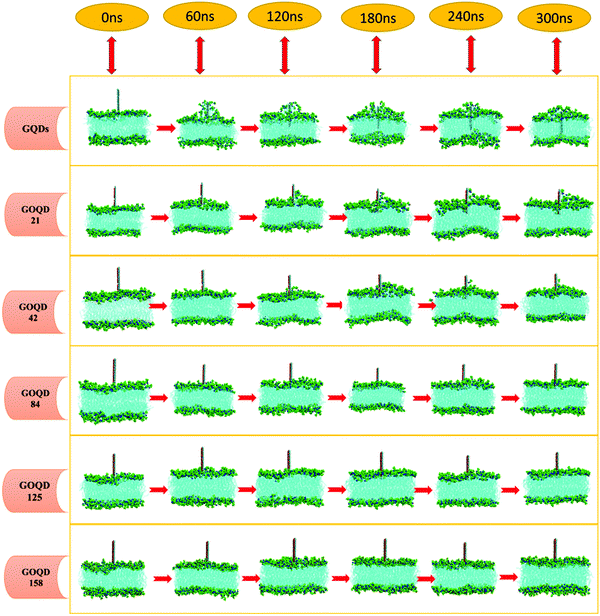
An instantaneous snapshot in the simulation process is shown in Fig. 4 to visually observe the interaction between the GQDs and POPC membrane. It is noteworthy that these systems have different penetration rates. For the GQDs, a large number of phospholipid molecules were adsorbed on their surface at 60 ns, but no obvious adsorption was observed for other simulation systems at this time. As the time of the simulation proceeded in the system with GQDs, the number of phospholipid molecules on the surface of GQDs increased, and the top of the cell membrane phospholipid molecule layer was broken. Due to the strong adsorption of phospholipid molecules by GQDs, the upper phospholipid molecules adsorbed onto the surface of the GQDs. At 160 ns, the GQDs penetrated into the interior of the cell membrane, and the phospholipid molecules at the upper layer of the cell membrane wrapped the upper end of the GQDs. At 300 ns, owing to the strong adsorption of GQDs, and GQDs penetrated into the interior of the membrane, and the centroid of the whole membrane moved up by 3.5 nm. In contrast, unlike single GQDs, GOQDs adsorbed phospholipid molecules more slowly. As seen in Fig. 4, for GOQD21 and GOQD42, with a relatively low degree of oxidation, a small number of the phospholipid molecules were adsorbed from the membrane at 120 ns. Moreover, due to unilateral oxidation, only the side without OH functionalization adsorbed phospholipid molecules, whereas the side containing OH did not show obvious adsorption of phospholipid molecules. At 300 ns, only one side of GOQD21 and GOQD42 adsorbed phospholipid molecules, but only the end of GOQD21 was inserted into the phospholipid molecular layer. Compared with GQDs, highly oxidized GQDs had no obvious adsorption of phospholipid molecules at 300 ns. However, in combination with the results shown in Fig. 3a, it can be seen that due to its strong adsorption effect, the membrane also appeared to be in a state of overall upward approach to the GOQDs. More specifically, the change in the distance between the GOQDs and the cell membrane decreased with an increase in the hydroxyl content.
3.2 Translocation dynamics
By observing the climbing process of phospholipid molecules, we plotted the instantaneous position diagram of phospholipid molecules, as shown in Fig. 5. For the GQDs system, the phospholipid molecules were first separated from the membrane due to the strong adsorption of GQDs at 14 ns, as shown in Fig. 5a. For the GOQD21 system, as shown in Fig. 5c, owing to the slow climbing of phospholipids, several phospholipid molecules separated from the membrane until 148 ns. Once the phospholipid molecules were extracted from the membrane, they attached tightly to the surface of the GQDs and GOQDs, as shown in Fig. 5b and d. In particular, for a single phospholipid molecule, the complete adsorption of GQDs was due to the strong hydrophobic effect of the tail of the phospholipid molecule. The tail adsorbed on the GQDs via diffusion to ensure maximum contact with the GQDs surface, while the hydrophilic head preferred to stay in the solvent in water. It was also observed that the upper layer of phospholipid molecules adsorbed quickly on the top of the GQDs. It is worth noting that after extracting the first layer of phospholipids, the second layer of phospholipids molecules are also adsorbed and closely attached to the first layer of phospholipids molecules. After a few nanoseconds, these phospholipid molecules became tightly attached to the first layer of phospholipid molecules.Phospholipid molecules can be adsorbed from the stable structure of cell membrane by GQDs and GOQDs, and the van der Waals interaction between them plays an important role. The change in the vdW force with time in the simulation process was calculated, and as shown in Fig. 6 the non-oxidized GQDs system exhibited the largest energy change, where it stabilized at 2500 kJ mol−1, approximately 40 ns into the simulation. Combining with the results suggested in the instantaneous screenshot in Fig. 4, it is presumed that the outer layer of phospholipid molecules covered the surface of the GQDs at 40 ns and the inner layer of phospholipid molecules mainly “climbed” afterwards, so the vdW force of the POPC molecules and GQDs remained stable. However, for the oxidized GOQDs systems, the vdW force decreased gradually with an increase in the degree of oxidation. For GOQD21 and GOQD42, the vdW force also increased slightly after 120 ns because of the existence of a small number of phospholipid molecules “climbing” on one side of the molecule. For GOQD84, GOQD125, and GOQD158, the vdW interactions were maintained within 500 kJ mol−1 throughout the entire process.
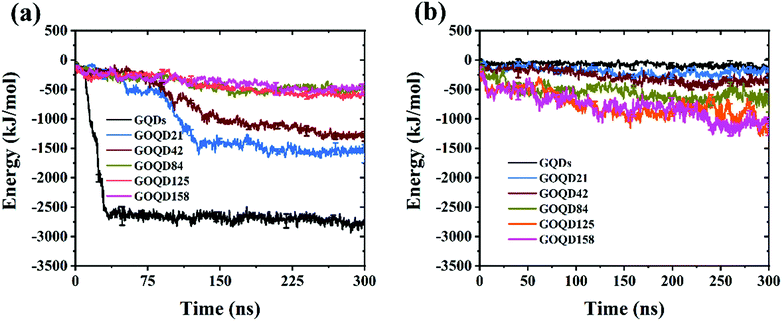 | ||
| Fig. 6 (a) van der Waals (vdW) force between GQDs (GOQDs) and cell membrane. (b) Electrostatic (Ele) interaction between GQDs (GOQDs) and cell membrane. | ||
Electrostatic force is also an important reference quantity to describe intermolecular interaction, as shown in Fig. 6b. The electrostatic interaction between GQDs (GOQDs) and cell membrane was calculated. With the increase of oxidation degree of GOQDs, the electrostatic interaction between them is also increasing, but the vdW interaction is decreasing. In the highly oxidized GOQDs system, the synergy between the two still cannot separate phospholipid molecules from the cell membrane.
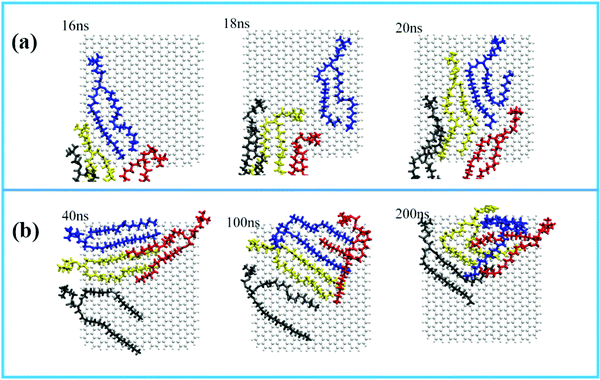
For the displacement of phospholipid molecules adsorbed on the surface of GQDs, four phospholipid molecules adsorbed on the surface of GQDs are taken as an example to explore the adsorption process. The four phospholipid molecules are displayed in different colors. In Fig. 7a, a single phospholipid molecule is first adsorbed on the surface of GQDs at 16 ns, as shown in the blue phospholipid molecule. By 20 ns, all four phospholipid molecules on the surface have been tightly adsorbed on the surface of GQDs. Fig. 7b shows the displacement of phospholipid molecules on the surface of GQDs from 40 ns to 200 ns. It can be seen that the four phospholipid molecules begin to continuously adjust their configurations and migrate to the upper layer of GQDs as a whole. This is because the newly adsorbed phospholipid molecules occupy the lower layer of GQDs, causing the phospholipid molecules to move up. With the adsorption of the first layer of phospholipid molecules, the second layer of phospholipid molecules also separate from the lipid membrane and adsorb on the surface of the first layer of phospholipid molecules.
However, it is worth noting that in the initial state, the membrane relies on vdW forces to pull the phospholipid molecules towards the GQDs. During this time, the GQDs and GOQDs are in the phase of stable adaptation and the integrity of the membrane is not greatly damaged. However, GQDs can quickly adsorb phospholipid molecules while the adsorption of GOQDs is slower, especially with an increase in the degree of oxidation. As reported in the literature,38,41–43 we found that the concept of nanometer “dehumidification” (that is, expelling water from the surface of GQDs) also plays an important role in the adsorption of phospholipids. To investigate this “dehumidification” mechanism, the DFT method was used to calculate the binding energies between GQDs and water molecules, and between GOQDs and water molecules. As shown in Fig. 8a, to simplify the model, small-sized GQDs and GOQDs were used to calculate the binding energies. In the calculation of GOQDs and water molecules, the positively charged H atom in water molecules and the O atom in –OH are close to each other to form a stable structure. When the water molecule is adsorbed near –OH, the H atom in the water molecule can approach the oxygen atom from behind –OH. Similarly, Valdemir et al. also proved through calculation and simulation that a strong hydrogen bond was formed between water molecules and oxygen functional groups (hydroxyl, carboxyl and epoxide).59 However, in the calculation of GQDs and water molecules, this adsorption effect is not obvious because there is no –OH modification on the surface of GQDs. Through the calculation of binding energy, the binding energy between GOQDs and water molecules is 46.04 kJ mol−1, while the binding energy between GQDs and water molecules is 17.75 kJ mol−1, with a difference of more than twice. Therefore, on the surface of GOQDs, water molecules are more difficult to remove, and the dehydration and climbing of phospholipid molecules are difficult.
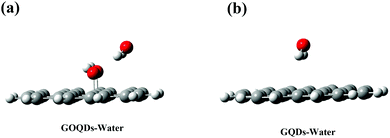 | ||
| Fig. 8 (a) DFT calculation results of GOQDs and water molecules (b) DFT calculation results of GQDs and water molecules. Gray is the C atom, white is the H atom and red is the O atom. | ||
Hydrogen bonding is an interaction between atoms. In MD simulations, when the hydrogen–donor–acceptor angle is less than or equal to 30°, the distance between the donor and the acceptor is less than or equal to 0.35 nm, hydrogen bonds are considered to be formed.60
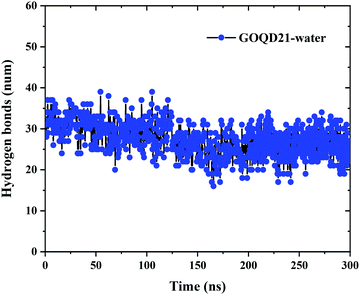
In order to more intuitively display the number of hydrogen bonds, the change of the number of hydrogen bonds between GOQD21 and water molecules in MD with time was calculated. As shown in Fig. 9, 31 hydrogen bonds were formed between the initialized GOQDs and water molecules. With the completion of the simulation, the surface hydrogen bonds of GOQD21 decreased a little, and the number was 26. But it can be seen from Fig. 4 that a small part of phospholipid molecules climbed to the surface at this time, breaking a small amount of hydrogen bonds, but there are still many hydrogen bonds between them, and it is difficult for phospholipid molecules to climb on the hydroxyl side. And with the increase of oxidation degree, the number of hydroxyl groups is also increasing, the number of hydrogen bonds formed with water molecules will also increase. Climbing of phospholipid molecules on GOQDs is more difficult, which can be seen in our highly oxidized GQDs system.
For other quantum dot systems, the average number of hydrogen bonds between GQDs (GOQDs) and liquid water molecules was calculated throughout the simulation, as shown in Table 3. In the GQDs system without hydroxyl groups, the number of hydrogen bonds with water molecules is zero. As the degree of oxidation increases, so does the number of hydrogen bonds formed between the quantum dots and water molecules. The climbing of phospholipid molecules on the surface of GOQDs needs to displace water molecules on the surface, which requires breaking of more hydrogen bonds formed between water molecules and the surface of GOQDs, making the climbing difficult.
| System | GQDs | GOQD21 | GOQD42 | GOQD84 | GOQD125 | GOQD158 |
|---|---|---|---|---|---|---|
| Hydrogen bonds | 0 | 27 | 56 | 91 | 109 | 127 |
3.3 The effect of GQDs on the structure of the cell membrane
It can be seen from the above results that GQDs can cause structural damage to the membrane, so we used the order parameter of the membrane to describe it in detail. In the simulation, the membrane flowed and was flexible. The order parameter represents the order degree of phospholipid molecules in a certain direction, and it is an important parameter that represents the structural changes in the cell membrane. The following equations are derived from our previous work.61Eqn (1) and (2) represent the inertia tensor of the jth phospholipid molecule, mi is the atomic mass of the ith atom in the phospholipid molecule of j, ri is the vector distance between the center of mass of the jth phospholipid molecule and the i atom in this phospholipid molecule, and α and β represent one of the x, y, and z directions in space. The long axis of the phospholipid molecule is defined as the eigenvector Ij, and the smallest eigenvector Imin was obtained by diagonalizing. | (1) |
 | (2) |
 | (3) |
| Sorder = λmax | (4) |
![[n with combining right harpoon above (vector)]](https://www.rsc.org/images/entities/i_char_006e_20d1.gif) is the eigenvector with the largest eigenvalue λmax of Q. The λmax is the order parameter Sorder. The deduced equation was written into the script of the program, and the change in the order parameter of each frame is obtained.
is the eigenvector with the largest eigenvalue λmax of Q. The λmax is the order parameter Sorder. The deduced equation was written into the script of the program, and the change in the order parameter of each frame is obtained.
As shown in Fig. 10, the order parameter of the GQDs system membrane changed a lot. It began to decrease at 20 ns, deviating from 0.7. It indicates that the phospholipid molecule has begun to climb to the surface of the GQDs. In the 50 ns simulation, the order parameter is 0.55, which is 0.2 lower than the initial value of 0.75. It indicates that the membrane structure changes a lot to compare with its initial structure. After 240 ns simulation time, the order parameters of the membrane under the GQDs system return to a stable state. As seen in Fig. 4, the phospholipid molecules on the surface of GQDs have completely wrapped the GQDs, and the climbing speed of the phospholipid molecules slowed down in the 240 ns simulation time. For GOQD21, the order parameter of the membrane decreased at 160 ns, at which a small number of the phospholipid molecules climbed to its surface, leading to the instability of the membrane. However, for the other systems, the order parameters of the cell membrane showed little change because no obvious climbing of phospholipid molecules was observed. The results showed that with an increase in the degree of graphene oxidation, it would be more difficult for phospholipid molecules to climb onto the surface of graphene, thereby decreasing their influence on the structure of the cell membrane.
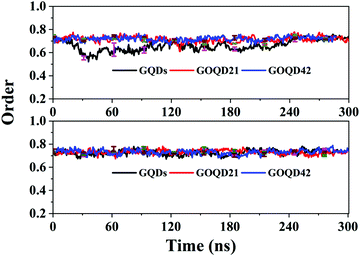 | ||
| Fig. 10 The order parameter of the POPC membrane as a function of simulation time in all simulations. | ||
4. Conclusions
In this study, we investigated the mechanism of phospholipid extraction using GQDs with different degrees of oxidation by combining MD simulations and DFT calculations. Pristine GQDs without oxidation can quickly adsorb phospholipid molecules on the cell membrane in 300 ns. With an increase in the degree of oxidation, phospholipid molecules were less likely to be adsorbed onto the surface of GOQDs, and GOQDs exhibited a much weaker phospholipid extraction behavior. DFT calculations showed that the “dehumidification” effect on the surface of GOQDs may be the main reason for the failure of the phospholipid molecules to adhere onto the graphene surface. Our research shows that in the extraction theory of cell membrane phospholipid molecules by nanomaterials, GQDs have a stronger adsorption effect than GOQDs, which may have the greatest impact on cells. This study provides a basis for in-depth understanding of the phospholipid extraction mechanism of GQDs and is helpful to further develop the potential applications of GQDs in the biomedical field.Conflicts of interest
There are no conflicts of interest to declare.Acknowledgements
This work was financially supported by the National Natural Science Foundation of China (Grant No. 21978060 and 11904300), the Natural Science Foundation of Zhejiang Province (Grant No. LY21B060004) and the Key Research and Development Plan of Zhejiang Province (No. 2020C01008). This work was also supported by the start funding of Hangzhou Dianzi University (No. KYS195618111) and the Key Fostering Project of Scientific Research of Hangzhou Normal University (2018PYXML006).Notes and references
- K. H. Lee, H. Park, W. Eom, D. J. Kang, S. H. Noh and T. H. Han, J. Mater. Chem. A, 2019, 7, 23727–23732, 10.1039/c9ta05242a.
- H. Y. Fan, X. H. Yu, K. Wang, Y. J. Yin, Y. J. Tang, Y. L. Tang and X. H. Liang, Eur. J. Med. Chem., 2019, 182, 111620, DOI:10.1016/j.ejmech.2019.111620.
- C. R. Martin, Science, 1994, 266, 1961–1966, DOI:10.1126/science.266.5193.1961.
- C. Buzea, I. I. Pacheco and K. Robbie, Biointerphases, 2007, 2, 17–71, DOI:10.1116/1.2815690.
- M. M. Rahman, D. Y. Huang, C. M. Ewulonu, C. Wang, S. Kuga, M. Wu and Y. Huang, Cellulose, 2020, 28, 1153–1165, DOI:10.1007/s10570-020-03558-z.
- S. Z. N. Ahmad, W. N. Wan Salleh, A. F. Ismail, N. Yusof, M. Z. Mohd Yusop and F. Aziz, Chemosphere, 2020, 248, 126008, DOI:10.1016/j.chemosphere.2020.126008.
- K. A. McDonnell, N. J. English, C. P. Stallard, M. Rahman and D. P. Dowling, Appl. Surf. Sci., 2013, 275, 316–323, DOI:10.1016/j.apsusc.2012.12.070.
- R. Kumar, A. Umar, G. Kumar and H. S. Nalwa, Ceram. Int., 2017, 43, 3940–3961, DOI:10.1016/j.ceramint.2016.12.062.
- M. P. Monopoli, C. Aberg, A. Salvati and K. A. Dawson, Nat. Nanotechnol., 2012, 7, 779–786, DOI:10.1038/nnano.2012.207.
- V. C. Sanchez, A. Jachak, R. H. Hurt and A. B. Kane, Chem. Res. Toxicol., 2012, 25, 15–34, DOI:10.1021/tx200339h.
- R. Di Santo, L. Digiacomo, S. Palchetti, V. Palmieri, G. Perini, D. Pozzi, M. Papi and G. Caracciolo, Nanoscale, 2019, 11, 2733–2741, 10.1039/c8nr09245a.
- J. Zhang, L. Chen, B. Shen, L. Chen, J. Mo and J. Feng, Langmuir, 2019, 18, 6120–6128, DOI:10.1021/acs.langmuir.9b00611.
- R. Z. A. R. Jamaluddin, L. L. Tan and K. F. Chong, Nanotechnology, 2020, 31, 485501, DOI:10.1088/1361-6528/abab2e.
- J. Adhikari, M. Rizwan, N. A. Keasberry and M. U. Ahmed, J. Chin. Chem. Soc., 2020, 67, 937–960, DOI:10.1002/jccs.201900417.
- P. A. S. Kinaret, G. Scala, A. Federico, J. Sund and D. Greco, Small, 2020, 16, 1907609, DOI:10.1002/smll.201907609.
- S. Baek, S. H. Joo, C. Su and M. Toborek, Environ. Toxicol., 2020, 35, 87–96, DOI:10.1002/tox.22845.
- P. Shah, M. Lalan and D. Jani, Curr. Pharm. Des., 2020, 556–564, DOI:10.2174/1381612826666200916143741.
- A. Geim, K. Novoselov and S. J. N. Materials, Nature, 2007, 183–191, DOI:10.1038/nmat1849.
- D. Li, X. Hu and S. Zhang, Biomaterials, 2019, 202, 12–25, DOI:10.1016/j.biomaterials.2019.02.020.
- S. M. Mousavi, S. Soroshnia, S. A. Hashemi, A. Babapoor, Y. Ghasemi, A. Savardashtaki and A. M. Amani, Drug Metab. Rev., 2019, 51, 91–104, DOI:10.1080/03602532.2019.1582661.
- M. Papi, V. Palmieri, L. Digiacomo, F. Giulimondi, S. Palchetti, G. Ciasca, G. Perini, D. Caputo, M. C. Cartillone, C. Cascone, R. Coppola, A. L. Capriotti, A. Lagana, D. Pozzi and G. Caracciolo, Nanoscale, 2019, 11, 15339–15346, 10.1039/c9nr01413f.
- M. A. Iqbal, M. Cui, A. Liaqat, R. Faiz, M. Hossain, X. Wang, S. Hussain, C. Dang, H. Liu and W. Wen, Nanotechnology, 2019, 30, 254003, DOI:10.1088/1361-6528/ab0608.
- M. Bacon, S. J. Bradley and T. Nann, Part. Part. Syst. Charact., 2014, 31, 415–428, DOI:10.1002/ppsc.201300252.
- J. Peng, W. Gao, B. K. Gupta, Z. Liu, R. Romero-Aburto, L. Ge, L. Song, L. B. Alemany, X. Zhan and G. Gao, Nano Lett., 2012, 12, 844–849, DOI:10.1021/nl2038979.
- K. A. Ritter and J. W. Lyding, Nat. Mater., 2009, 8, 235–242, DOI:10.1038/nmat2378.
- S. C. Smith and D. F. Rodrigues, Carbon, 2015, 91, 122–143, DOI:10.1016/j.carbon.2015.04.043.
- W. Kang, X. Li, A. Sun, F. Yu, X. J. E. S. Hu and Technology, Environ. Sci. Technol., 2019, 53, 3791–3801, DOI:10.1021/acs.est.8b06023.
- L. Mu, Q. Zhou, Y. Zhao, X. Liu and X. Hu, J. Hazard. Mater., 2019, 366, 694–702, DOI:10.1016/j.jhazmat.2018.12.044.
- J. Li, X. Huang, R. Huang, J. Jiang, Y. Wang, J. Zhang, H. Jiang, X. Xiang, W. Chen, X. Nie and R. Gui, Carbon, 2019, 146, 660–670, DOI:10.1016/j.carbon.2019.02.056.
- H. B. Xing, A. Mello, F. Fan and S. G. Santos-Oliveira, J. Biomed. Nanotechnol., 2021, 17, 131–148, DOI:10.1166/jbn.2021.3006.
- M. Xie, T. Deng, J. Li and H. Shen, J. Colloid Interface Sci., 2021, 591, 290–299, DOI:10.1016/j.jcis.2021.01.088.
- A. Sun, L. Mu and X. Hu, ACS Appl. Mater. Interfaces, 2017, 9, 12241–12252, DOI:10.1021/acsami.7b00306.
- B. R. Brooks, R. E. Bruccoleri, B. D. Olafson, D. J. States, S. Swaminathan and M. Karplus, J. Comput. Chem., 2010, 187–217, DOI:10.1002/jcc.540040211.
- Y. Zhang, H. Han, N. Wang, P. Zhang, Y. Fu, M. Murugesan, M. Edwards, K. Jeppson, S. Volz and J. Liu, Adv. Funct. Mater., 2015, 25, 4430–4435, DOI:10.1002/adfm.201500990.
- L. Liang, J. W. Shen, Z. Zhang and Q. Wang, Biosens. Bioelectron., 2017, 89, 280–292, DOI:10.1016/j.bios.2015.12.037.
- D. Kim, J. M. Yoo, H. Hwang, J. Lee, S. H. Lee, S. P. Yun, M. J. Park, M. Lee, S. Choi and S. H. Kwon, Nat. Nanotechnol., 2018, 13, 812–818, DOI:10.1038/s41565-018-0179-y.
- G. Duan, Y. Zhang, B. Luan, J. K. Weber, R. W. Zhou, Z. Yang, L. Zhao, J. Xu, J. Luo and R. Zhou, Sci. Rep., 2017, 7, 42767, DOI:10.1038/srep42767.
- Y. Tu, M. Lv, P. Xiu, T. Huynh, M. Zhang, M. Castelli, Z. Liu, Q. Huang, C. Fan and H. Fang, Nat. Nanotechnol., 2013, 8, 594–601, DOI:10.1038/nnano.2013.125.
- X. Zou, L. Zhang, Z. Wang and Y. Luo, J. Am. Chem. Soc., 2016, 138, 2064–2077, DOI:10.1021/jacs.5b11411.
- R. Wu, X. Ou, R. Tian, J. Zhang, H. Jin, M. Dong, J. Li and L. Liu, Nanoscale, 2018, 10, 20162–20170, 10.1039/c8nr04207a.
- B. J. Berne, J. D. Weeks and R. Zhou, Annu. Rev. Phys. Chem., 2009, 60, 85–103, DOI:10.1146/annurev.physchem.58.032806.104445.
- R. Zhou, X. Huang, C. J. Margulis and B. J. Berne, Science, 2004, 305, 1605–1609, DOI:10.1126/science.1101176.
- P. Liu, X. Huang, R. Zhou and B. J. Berne, Nature, 2005, 437, 159–162, DOI:10.1038/nature03926.
- J. Mao, R. H. Guo and L. T. Yan, Biomaterials, 2014, 35, 6069–6077, DOI:10.1016/j.biomaterials.2014.03.087.
- B. Luan and R. Zhou, Nat. Commun., 2019, 10, 4610, DOI:10.1038/s41467-019-12584-w.
- X. Zhang, G. Ma and W. Wei, NPG Asia Mater., 2021, 13, 52, DOI:10.1038/s41427-021-00320-0.
- M. Zhou, Q. Shen, J. W. Shen, L. Jin and L. Liang, Colloids Surf., B, 2018, 174, 575–581, DOI:10.1016/j.colsurfb.2018.11.059.
- J. L. Chen, G. Q. Zhou, L. Chen, Y. Wang, X. G. Wang and S. W. Zeng, J. Phys. Chem. C, 2016, 120, 6225–6231, DOI:10.1021/acs.jpcc.5b10635.
- L. Liang, Z. Kong, Z. Kang, H. Wang, L. Zhang and J. W. Shen, ACS Biomater. Sci. Eng., 2016, 2, 1983–1991, DOI:10.1021/acsbiomaterials.6b00390.
- Z. Zhang, J. Shen, H. Wang, Q. Wang, J. Zhang, L. Liang, H. Agren and Y. Tu, J. Phys. Chem. Lett., 2014, 5, 1602–1607, DOI:10.1021/jz500498c.
- W. Humphrey, A. Dalke and K. Schulten, J. Mol. Graphics, 1996, 14, 33–38, DOI:10.1016/0263-7855(96)00018-5.
- E. Neria, S. Fischer and M. Karplus, J. Chem. Phys., 1996, 105, 1902–1921, DOI:10.1063/1.472061.
- M. J. Abraham, T. Murtola, R. Schulz, S. Páll, J. C. Smith, B. Hess and E. Lindahl, SoftwareX, 2015, 1–2, 19–25, DOI:10.1016/j.softx.2015.06.001.
- D. Cohen-Tanugi and J. C. Grossman, Nano Lett., 2012, 12, 3602–3608, DOI:10.1021/nl3012853.
- Z. Kong, W. Hu, F. Jiao, P. Zhang, J. Shen, B. Cui, H. Wang and L. Liang, J. Phys. Chem. B, 2020, 124, 9335–9342, DOI:10.1021/acs.jpcb.0c05882.
- B. Hess, H. Bekker, H. And and J. Fraaije, J. Comput. Chem., 1997, 1463–1472 CrossRef CAS.
- A. D. Becke, J. Chem. Phys., 1993, 98, 5648–5652, DOI:10.1063/1.464913.
- S. Grimme, J. Antony, S. Ehrlich and H. Krieg, J. Chem. Phys., 2010, 132, 154104, DOI:10.1063/1.3382344.
- V. Ludwig, A. H. D. Lima, L. Modesto-Costa, Z. M. D. C. Ludwig, J. P. A. D. Mendonça, W. G. Quirino and F. Sato, J. Mol. Liq., 2021, 342, 117429, DOI:10.1016/j.molliq.2021.117429.
- I. K. McDonald and J. M. Thornton, J. Mol. Biol., 1994, 238, 777–793, DOI:10.1006/jmbi.1994.1334.
- Z. Kong, H. Wang, L. Liang, Z. Zhang, S. Ying, Q. Hu and J.-W. Shen, J. Mol. Model., 2017, 23, 113, DOI:10.1007/s00894-017-3292-1.
Footnote |
| † P. Z. Z and F. F. J. contributed equally to this work. |
| This journal is © The Royal Society of Chemistry 2022 |


