 Open Access Article
A solid-state fluorescent probe for α,β-diamine based on tetraphenylethylene skeleton construction†
Dongqing
Liu
a,
Qiao
Yan
*b,
Qinglin
Ma
a and
Ming
Bai
 *ab
*ab
aMarine College, Shandong University, Weihai, Weihai, 264209, People's Republic of China. E-mail: ming_bai@sdu.edu.cn
bSDU-ANU Joint Science College, Shandong University, Weihai, Weihai, 264209, People's Republic of China
First published on 8th June 2022
Abstract
α,β-Diamines, as raw materials or intermediates, have extensive applications in various chemical industries, but volatile amine vapors are serious threats to the environment and human health. So far, numerous fluorescent sensors have been developed to detect amines, but a majority of them are based on aggregation-caused quenching or lack portability. As a fluorescent dye with aggregation-induced emission property, the switching mechanism of tetraphenylethylene (TPE) and its application in chemical sensors have attracted considerable attention. In this research, we report a fluorescent sensor, namely DPEC, based on TPE, which showed response to α,β-diamines with high selectivity and sensitivity via the quinone-containing redox mechanism. When the sensor was exposed to amines, they underwent a Michael addition and redox reaction between the quinone units of the sensing material and the target amines to construct the TPE fluorophore, resulting in “turn-on” response and rapid color changes. As is known, this is the first fluorescent sensor based on the TPE skeleton construction. The research explored the TPE construction mechanism and will contribute to the development of novel TPE sensors.
Introduction
α,β-Diamines have been used in numerous fields, such as chemistry, biology, medicine and agriculture.1–3 However, as raw materials or intermediates in chemical industry, such as pesticides, dyes and medicines, diamines, have the characteristics of high toxicity, persistence and bioaccumulation.4 Moreover, they are the main pollutants causing odor pollution easily absorbed through skin, eyes or respiratory system, and are harmful to the air environment5 and human health.6 Therefore, it is imperative to develop methods for the detection of gaseous α,β-diamines.Conventional methods previously reported to detect amine pollutants are colorimetry,7 gas chromatography8 and high-performance liquid chromatography.9 With the development of sensor technology, numerous electrochemical sensors10 and optical sensors11,12 are gradually developed for the detection of amines. However, most of these methods have some disadvantages, such as high cost and complicated operations, which greatly hinder their applications. For this reason, developing convenient and economical methods to detect α,β-diamines is of great significance.
In recent years, solid fluorescent sensors have been widely used in the amine detection due to their advantages of high selectivity and portability.12–14 In particular, as one of the most promising fluorescent dyes, the aggregation-induced emission (AIE) fluorophore15 showed a unique advantage in solid state fluorescent sensors, which could emit strong fluorescence in the aggregation state. The reported responsive mechanisms of the solid-state AIE sensors include inducing aggregation or restricting the intramolecular motion of AIE dyes16 with functional group reaction,17 photoactivated cycloaddition,18 bioconjugation19 and photophysical processes, such as photoinduced electron transfer (PET),20,21 intramolecular charge transfer (ICT),22 energy transfer (ET) and excited intramolecular proton transfer (ESIPT).23,24 Depending upon the interaction site present in the sensor, the detection can be based on the above-mentioned mechanisms. Tetraphenylethylene (TPE) is one of the most important AIE materials for its strong emission in solid state and facile preparation. A fluorescence sensor based on TPE cores has also been reported,25 which is based on mechanisms with chemical reaction. Therefore, we intend to design a fluorescent sensor to detect amine vapor by using the chemical reactions with amines to reconstruct the π–π-conjugated benzene rings in TPE.
In the year of 2010, Barbosa et al. reported a process to obtain 2,5-bis(alkylamino)-1,4-benzoquinones from 1,4-benzoquinones with ethylenediamine (EDA), as shown in Scheme 1.26 1,4-Benzoquinone was treated with EDA to form the additive product 1 and 3. Simultaneously, due to the reductive property of the 2-alkylamino-1,4-hydroquinones and 2,5-bis(alkylamino)-1,4-hydroquinones, 1,4-benzoquinone was reduced by the additive product to get the product 1,4-hydroquinone.
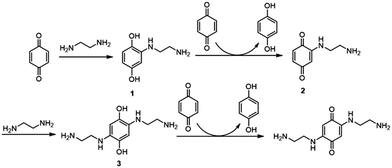 | ||
| Scheme 1 The Michael addition of benzoquinone and ethylenediamine and the following redox reaction to form hydroquinone. | ||
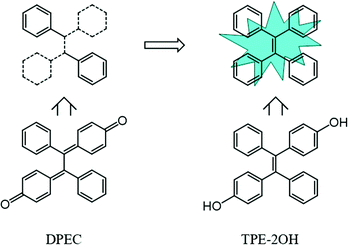
Herein, we utilized the above-mentioned reaction to design a solid fluorescent sensor, namely DPEC, which combined the capabilities of both colorimetric and fluorescence sensors based on the TPE skeleton construction and its AIE property. The non-emissive compound 4,4′-(1,2-diphenyl-1,2-ethanediylidene) bis[2,5-cyclohexadien-1-one] (DPEC) was the oxidate product of 4,4′-(1,2-diphenylethane-1,2-diyl) diphenol (TPE-2OH), which is highly emissive in the solid state. When reacted with α,β-diamines, the quinone unit in the molecule DPEC could be converted to benzene ring through Michael addition and redox reaction with the target amines to reconstruct the TPE framework, which resulted in luminescence in solid or aggregate state (Scheme 2). We also investigated the response of the compound DPEC to a series of amines and found that the compound showed a significant response to α,β-diamines, such as ethylenediamine (EDA), 1,2-diaminocyclohexane and o-phenylenediamine. Moreover, test strips by directly loading DPEC on a filter paper could be prepared and used as a portable sensor for α,β-diamine vapor detection, which has advantages of high sensitivity, low-cost and real time detection.
Experiment section
Materials and chemicals
Solvents used for solution measurement and thin film formation were distilled prior to use. Chloroform and toluene were distilled from calcium hydride under nitrogen. All chemicals and reagents were purchased from commercial sources and used as received without further purification. Column chromatography was carried out on a silica gel column (Qingdao Haiyang, 200–300 mesh) with the indicated eluents. All the other reagents, such as 4-hydroxybenzophenone, zinc dust, titanium tetrachloride, potassium ferricyanide, ethylenediamine, and 1,2-diaminobenzene, 1,2-diaminocyclohexane, were used as received.Equipment and methods
1H NMR spectra were recorded on a Bruker DPX 400 spectrometer (1H: 400 MHz, 13C: 100 MHz) in CDCl3 unless otherwise stated. Spectra were referenced internally using the residual solvent resonances (δ = 7.28 ppm from CDCl3 for 1H NMR) relative to SiMe4 (δ = 0 ppm). 13C NMR spectra were referenced internally by using the solvent resonances (δ = 77.00 ppm for CDCl3). Ground state UV-vis absorption spectra were recorded on a Hitachi U-2900 spectrophotometer. Photoluminescence spectra were recorded on a Hitachi F-7000 spectrophotometer. The emission spectra were corrected for the wavelength-dependent sensitivity of the detection system. The ESI-MS spectrum was taken on a Thermo Fisher Q-Exactive mass spectrometer.Synthesis of DPEC
4-Hydroxybenzophenone and zinc powder were added to anhydrous tetrahydrofuran under nitrogen protection. The mixture was cooled to −78 °C, and TiCl4 was added into the reaction system drop by drop. Then, the mixture was returned to room temperature and stirred for 0.5 h. After that, the reaction was heated to reflux overnight. Using n-hexane/ethyl acetate (V/V 7![[thin space (1/6-em)]](https://www.rsc.org/images/entities/char_2009.gif) :
:![[thin space (1/6-em)]](https://www.rsc.org/images/entities/char_2009.gif) 3) as the mobile phase, TPE-2OH was obtained by column chromatography. Then, under the condition of potassium ferricyanide, which was dissolved in 80 mL of 5% (mass fraction) potassium hydroxide aqueous solution, TPE-2OH reacted in toluene for 8 h. The resulting solution was filtered and evaporated to afford the crude product. Then, the crude product was recrystallized using ethanol to give the red solid in 70% yield. The detailed experimental procedure was shown in ESI.†1H-NMR (400 MHz, CDCl3), (TMS, ppm): 7.49 (dt, 2H, ArH); 7.37 (m, 8H, ArH); 7.20 (q, 4H,
3) as the mobile phase, TPE-2OH was obtained by column chromatography. Then, under the condition of potassium ferricyanide, which was dissolved in 80 mL of 5% (mass fraction) potassium hydroxide aqueous solution, TPE-2OH reacted in toluene for 8 h. The resulting solution was filtered and evaporated to afford the crude product. Then, the crude product was recrystallized using ethanol to give the red solid in 70% yield. The detailed experimental procedure was shown in ESI.†1H-NMR (400 MHz, CDCl3), (TMS, ppm): 7.49 (dt, 2H, ArH); 7.37 (m, 8H, ArH); 7.20 (q, 4H, ![[double bond, length as m-dash]](https://www.rsc.org/images/entities/char_e001.gif) CH); 6.54 (m, 4H,
CH); 6.54 (m, 4H, ![[double bond, length as m-dash]](https://www.rsc.org/images/entities/char_e001.gif) CH). 13C-NMR (100 MHz, CDCl3), δ: 186.74, 154.65, 137.46, 137.27, 136.43, 132.35, 130.62, 130.40, 130.10, 128.74. ESI-MS: m/z calcd. for [M + H] +, 363.4; found, 363.6.
CH). 13C-NMR (100 MHz, CDCl3), δ: 186.74, 154.65, 137.46, 137.27, 136.43, 132.35, 130.62, 130.40, 130.10, 128.74. ESI-MS: m/z calcd. for [M + H] +, 363.4; found, 363.6.
Results and discussion
Optical property characterizations and mechanisms
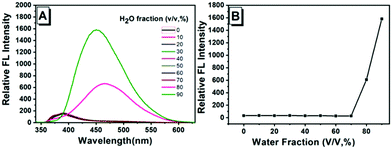
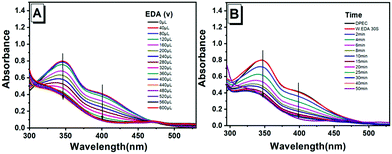
A synthesis route of the fluorescent sensor (DPEC) was performed, as shown in Scheme 3. The TPE was decorated with two hydroxyl groups to obtain the AIE molecule 4,4′-(1,2-diphenylethane-1,2-diyl)diphenol (TPE-2OH).27 Then, in the presence of potassium ferricyanide, TPE-2OH could be efficiently oxidized in toluene to afford the target compound DPEC. It should be noted that the synthesized TPE-2OH has cis and trans isomers,28 which have the same luminescence characteristics and similar polarity. After oxidation, the double bond part in tetraphenylethylene formed a single bond of DPEC, which can rotate freely. The structure of DPEC was confirmed by 1H-NMR, 13C-NMR, 2D-COSY NMR and electrospray ionization mass spectroscopic techniques (Fig. S1–S6, ESI†). First, the AIE properties of TPE-2OH were investigated in the H2O-DMSO mixed solution with different water fractions (fw, the volume percentage of H2O in the H2O-DMSO mixture). As shown in Fig. 1, extremely weak emission of TPE-2OH was observed at ca. 400 nm when the fw was ranged from 0 to 70%. It should be noted that when the fw reached 80%, a red-shifted peak at about 470 nm with a significant enhancement of fluorescence emission could be observed, which indicated that the compound had evident AIE characteristics with intense emission in the aggregate state. In contrast with the AIE property of TPE-2OH, DPEC was a non-emissive molecule under UV irradiation in DMSO and H2O-DMSO solutions (Fig. S8, ESI†).According to previous reports,29 ethylenediamine (EDA) was selected as the initiator. The changes of the absorption spectrum of DPEC titrated with EDA in the DMSO solution were recorded. As shown in Fig. 2A, with the addition of EDA, the maximum absorption wavelengths of DPEC at ca. 350 nm and 400 nm decreased, and an evident blue-shift from 350 nm to 330 nm occurred. When the EDA increased to 400 μL, the maximum absorption at 400 nm remained unchanged. Then, the reaction time was also investigated. 400 μL EDA was added into the DMSO solution of DPEC, and the absorption spectra were recorded over time (Fig. 2B). The absorbance at 350 nm and 400 nm decreased over time until 10 min, which suggested 400 μL EDA could consume 30 μM DPEC within 10 min (Fig. S9B, ESI†).
To verify the reaction mechanism, the reaction of DPEC and EDA was performed. In the presence of anhydrous potassium carbonate, excess EDA was added dropwise into the chloroform solution of DPEC, and the resulting mixture was stirred at room temperature for 1 day. The products were analysed by high performance liquid chromatography-mass spectrometry (HPLC-MS) (Fig. S13, ESI†). According to the molecular weight shown in the mass spectrum, we speculated that its composition was mainly TPE-2OH and the addition products, and TPE-2OH was the major product, while the addition products were complex, and the corresponding yields were low, as shown in Fig. S13 and Table S1 (ESI†). Considering that EDA has reducibility and the reaction was completed in the presence of excess EDA, which may be the reasonable explanation for the low yield of the addition products. Subsequently, we purified the products by column chromatography. However, due to the complexity of the addition product, the pure addition product was not separated from the reaction residue. The major product was measured by 1H-NMR (Fig. S2, ESI†), which further confirmed that the product was TPE-2OH. Moreover, in order to verify that EDA could react with DPEC to produce luminescent TPE-2OH, we measured the absorption spectrum of DPEC, TPE-2OH and the mixture of DPEC and EDA, and found that the newly generated absorption peak overlapped with that of TPE-2OH (Fig. S11, ESI†). Therefore, these results seemed to indicate that the reaction of EDA and DPEC could form TPE-2OH, which had the AIE property, and then produced the “turn-on” response for EDA.
So, according to the mechanism reported by Barbosa et al.,26 the mechanism of DPEC converted to TPE-2OH was proposed, as shown in Scheme 4. Amino-hydroquinone was generated when the Michael addition reaction happened between DPEC and EDA. Then, the redox reaction between amino-hydroquinone and DPEC generated amino-benzoquinone and TPE-2OH.
Other α,β-diamines, such as cyclohexane diamine and o-phenylenediamine and monoamines such as ethylamine, diethylamine, phenylamine and interference propanethiol, were also investigated, as shown in Fig. S10 (ESI†). Comparing with monoamines and interference, the compound DPEC was much more sensitive to α,β-diamines during the same reaction time, which consisted with the previous report.30
The test strips of solid-state fluorescent sensor
Considering the convenience for practical applications, a fluorescent test paper for the detection of amines was obtained (Fig. S12, ESI†). The blank filter paper was used as the carrier material and soaked in DPEC (30 μM) chloroform solution to prepare the test paper strips. After soaking, the filter paper was removed and placed in a clean and ventilated place to dry naturally. The aqueous solution of EDA was dipped on the test paper with the word “AIE”, and then after evaporating the solvent in air, the test paper was investigated under natural light and 365 nm UV light, respectively. It could be found that the “AIE” on the test paper could be saw by naked eyes, while under the UV light, significant blue-green emission was observed in that area, as shown in Fig. 3.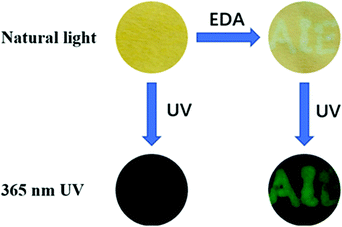 | ||
| Fig. 3 Images shown the “turn-on” process of the DPEC sensor simulated by EDA under 365 nm UV light. | ||
Then, the time-dependent fluorescence changes of the test paper to EDA vapor were investigated. About two milliliters of EDA were added to the bottles to form saturated amine vapor. After exposing the sensor to the diffused saturated amine vapor, the variation in the fluorescence spectra and photos over time was recorded, as shown in Fig. 4. DPEC on a filter paper exhibited almost no fluorescence in the absence of amines under 365 nm UV irradiation. However, a significant enhancement in the emission intensity could be observed over time after exposure to the EDA vapor. The above experiments showed that DPEC in the form of a test paper has great potential in the detection of EDA.
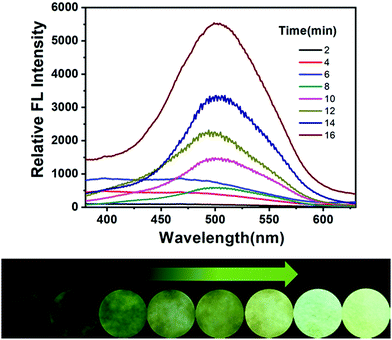 | ||
| Fig. 4 Time-dependent fluorescence spectra of DPEC (30 μM) test paper after being fumed with EDA. Inset: The fluorescence variation of the filter paper under 365 nm light. | ||
Next, to better investigate the sensitivity of the test strip towards EDA vapor, concentration-dependent fluorescence spectra were obtained after exposing the sensor to the diffused saturated EDA vapor for 20 min with increased vapor concentrations. The FL intensity of the test strip enhanced gradually with the increasing concentration of EDA vapor during the same response time as shown in Fig. 5. Furthermore, it expressed a good linear relationship (R2 = 0.9859) between the concentration of response ratio and gaseous EDA (Fig. S14, ESI†). The detection limit (DL) of the test strip toward EDA vapor was calculated to be as low as 1.991 ppm.
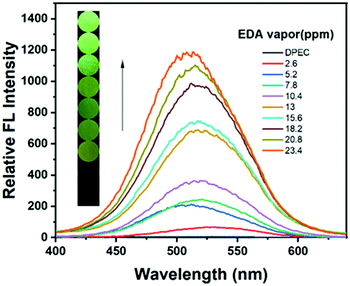 | ||
| Fig. 5 FL spectra of DPEC test paper (30 μM) after being fumed with various concentrations of EDA vapor for 20 min. Inset: The fluorescence variation of the filter paper under 365 nm light. | ||
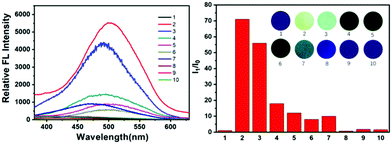
Next, to investigate whether the detection ability of DPEC was general for various amines, the experiments were extended to using other α,β-diamine and monoamines as the detection targets, and the testing results are summarized in Fig. 6. It was found that the sensors in cyclohexanediamine vapor had excellent emission ratios, which indicated that it could efficiently reduce DPEC to generate emissive TPE-2OH. However, for monoamines or other possible interferents (ethylamine, diethylamine, phenylamine and propanethiol), they cannot efficiently fluoresce the DPEC sensor, which may be due to their much lower reducibility or volatility. Evidently, the DPEC-loaded test strip could distinguish α,β-diamines from other amines, which clearly demonstrates that the DPEC test paper can be used as a portable sensor for α,β-diamine detection with the advantages of excellent portability and simple operation. To further investigate the fluorescence characteristics of DPEC as a fluorescent probe, the emission spectra of DPEC in the presence of various solvents, such as CH2Cl2, THF and EtOH, were also studied, and almost no luminescence response was observed. These experiments demonstrated that the DPEC sensor can be used for the selective detection of α,β-diamine vapor among various volatile organic compounds.
Conclusions
In summary, based on the AIE property of TPE-2OH, a new quinone solid fluorescence sensor DPEC was designed and synthesized for the optical detection of α,β-diamine vapor. The mechanism was proposed as that the DPEC could react with amines through a Michael addition to form the diphenol intermediate, which could reduce DPEC to produce the AIE compound TPE-2OH, and result in the “turn-on” response to amines. This is a novel mechanism in the design of TPE sensors. Through comparing the emission intensity of the sensor in various kinds of amines and volatile solvents, it was confirmed that the DPEC was a particular sensor for α,β-diamines. Moreover, the detection limit of the test strip towards EDA vapor was calculated as low as 1.991 ppm. As a promising diamine fluorescence detection sensor, DPEC could be conveniently applied to the detection of organic diamine pollution vapor, and realized the real-time dynamic monitoring of environmental pollution. The design strategy proposed here offers assistance for developing portable solid-state sensors for α,β-diamines vapor. More importantly, the method of the reconstruction of TPE skeleton to detect amines will stimulate the production of fluorescent sensors by the structure transformation of TPE.Author contributions
Ming Bai conceived and designed the experiments. Dongqing Liu, Qinglin Ma: performed the experiments. Ming Bai, Qiao Yan: analyzed the data. Dongqing Liu, Ming Bai and Qiao Yan wrote the manuscript.Conflicts of interest
The authors declared that they have no conflicts of interest to this work. We declare that we do not have any commercial or associative interest, that represents a conflict of interest in connection with the work submitted.Acknowledgements
Financial support was from the Shandong Provincial Natural Science Foundation (Grant No. ZR2019MB055) and the Key Research and Development Program of Shandong Province (Grant No. 2017GGX20118).Notes and references
- G. D’Andrea, G. Pizzolato, A. Gucciardi, M. Stocchero, G. Giordano, E. Baraldi and A. Leon, Sci. Rep., 2019, 9, 1–11 CrossRef PubMed.
- K. Bugda Gwilt, D. P. González, N. Olliffe, H. Oller, R. Hoffing, M. Puzan, S. El Aidy and G. M. Miller, Cell. Mol. Neurobiol., 2020, 40, 191–201 CrossRef CAS PubMed.
- T. Gao, E. S. Tillman and N. S. Lewis, Chem. Mater., 2005, 17, 2904–2911 CrossRef CAS.
- S. A. Lawrence, Amines: synthesis, properties and applications, Cambridge University Press, 2004 Search PubMed.
- L. Baliño-Zuazo and A. Barranco, Food Chem., 2016, 196, 1207–1214 CrossRef PubMed.
- V. R. Pirastu, Cancer, Causes Control, 1997, 8, 346–355 CrossRef PubMed.
- Y. J. Diaz, Z. A. Page, A. S. Knight, N. J. Treat, J. R. Hemmer, C. J. Hawker and J. Read de Alaniz, Chem. – Eur. J., 2017, 23, 3562–3566 CrossRef CAS PubMed.
- W. Stillwell, M. S. Bryant and J. S. Wishnok, Biomed. Environ. Mass Spectrom., 1987, 14, 221–227 Search PubMed.
- M. T. Salazar, T. K. Smith and A. Harris, J. Agric. Food Chem., 2000, 48, 1708–1712 CrossRef CAS PubMed.
- Y. Zhang, C. Peng, X. Ma, Y. Che and J. Zhao, Chem. Commun., 2015, 51, 15004–15007 RSC.
- X. Pei, J. Hu, H. Song, L. Zhang and Y. Lv, Anal. Chem., 2021, 93, 6692–6697 CrossRef CAS PubMed.
- S. Jeon, T.-I. Kim, H. Jin, U. Lee, J. Bae, J. Bouffard and Y. Kim, J. Am. Chem. Soc., 2020, 142, 9231–9239 CrossRef CAS PubMed.
- Y. Meng, H. Luo, C. Dong, C. Zhang, Z. He, Z. Long and R. Cha, ACS Sustainable Chem. Eng., 2020, 8, 9731–9741 CrossRef CAS.
- D. Wang and B. Z. Tang, Acc. Chem. Res., 2019, 52, 2559–2570 CrossRef CAS PubMed.
- Y. Hong, Methods Appl. Fluoresc., 2016, 4, 022003 CrossRef PubMed.
- X. Shi, Y. Chris, H. Su, R. T. Kwok, M. Jiang, Z. He, J. W. Lam and B. Z. Tang, Chem. Sci., 2017, 8, 7014–7024 RSC.
- M. Chen, R. Chen, Y. Shi, J. Wang, Y. Cheng, Y. Li, X. Gao, Y. Yan, J. Z. Sun and A. Qin, Adv. Funct. Mater., 2018, 28, 1704689 CrossRef.
- J. Qi, C. Chen, X. Zhang, X. Hu, S. Ji, R. T. Kwok, J. W. Lam, D. Ding and B. Z. Tang, Nat. Commun., 2018, 9, 1–12 CrossRef CAS PubMed.
- X. Hu, X. Zhao, B. He, Z. Zhao, Z. Zheng, P. Zhang, X. Shi, R. T. K. Kwok, J. W. Y. Lam, A. Qin and B. Z. Tang, Research, 2018, 1–12 CrossRef PubMed.
- W. Zhang, J. Kang, P. Li, H. Wang and B. Tang, Anal. Chem., 2015, 87, 8964–8969 CrossRef CAS PubMed.
- Y. Cai, L. Li, Z. Wang, J. Z. Sun, A. Qin and B. Z. Tang, Chem. Commun., 2014, 50, 8892–8895 RSC.
- S. Pramanik, H. Deol, V. Bhalla and M. Kumar, ACS Appl. Mater. Interfaces, 2017, 10, 12112–12123 CrossRef PubMed.
- P. Zhang, X. Nie, M. Gao, F. Zeng, A. Qin, S. Wu and B. Z. Tang, Mater. Chem. Front., 2017, 1, 838–845 RSC.
- T. Ryan, W. Jacky and B. ZhongáTang, Chem. Commun., 2016, 52, 10076–10079 RSC.
- K. Siddharth, P. Alam, M. D. Hossain, N. Xie, G. S. Nambafu, F. Rehman, J. W. Lam, G. Chen, J. Cheng and Z. Luo, J. Am. Chem. Soc., 2021, 143, 2433–2440 CrossRef CAS PubMed.
- L. C. Almeida Barbosa, U. Alves Pereira, C. R. Alvares Maltha, R. Ricardo Teixeira, V. M. Moreira Valente, J. R. Oliveira Ferreira, L. V. Costa-Lotufo, M. Odorico Moraes and C. Pessoa, Molecules, 2010, 15, 5629–5643 CrossRef PubMed.
- W. Guan, S. Wang, C. Lu and B. Z. Tang, Nat. Commun., 2016, 7, 1–7 Search PubMed.
- J. Wang, Q. Jiang, S. Cao, C. Sun, Y. Zhang, Y. Qiu, H. Wang, G. Yin, Y. Liao and X. Xie, Macromolecules, 2021, 54, 10740–10749 CrossRef CAS.
- M. Á. Castro, A. M. Gamito, V. Tangarife-Castaño, V. Roa-Linares, J. M. M. del Corral, A. C. Mesa-Arango, L. Betancur-Galvis, A. M. Francesch and A. San Feliciano, RSC Adv., 2015, 5, 1244–1261 RSC.
- G. Zhang, A. S. Loch, J. C. Kistemaker, P. L. Burn and P. E. Shaw, J. Mater. Chem. C, 2020, 8, 13723–13732 RSC.
Footnote |
| † Electronic supplementary information (ESI) available. See DOI: https://doi.org/10.1039/d2ma00344a |
| This journal is © The Royal Society of Chemistry 2022 |

