 Open Access Article
Electron density regulation of Pt–Co nanoalloys via P incorporation towards methanol electrooxidation†
Niuwa
Yang
ab,
Zhenya
Hu
ab,
Jing
Song
cd,
Tingyu
Lu
e,
Penglei
Cui
a,
Lin
Xu
 *e,
Hui
Liu
*af and
Jun
Yang
 *abf
*abf
aState Key Laboratory of Multiphase Complex Systems, Institute of Process Engineering, Chinese Academy of Sciences, Beijing 100190, China. E-mail: liuhui@ipe.ac.cn; jyang@ipe.ac.cn
bCenter of Materials Science and Optoelectronics Engineering, University of Chinese Academy of Sciences, Beijing 100049, China
cNational Engineering Research Center of Green Recycling for Strategic Metal Resources, Institute of Process Engineering, Chinese Academy of Sciences, Beijing 100190, China
dKey Laboratory of Green Process and Engineering, Institute of Process Engineering, Chinese Academy of Sciences, Beijing 100190, China
eSchool of Chemistry and Materials Science, Jiangsu Key Laboratory of New Power Batteries, Jiangsu Collaborative Innovation Centre of Biomedical Functional Materials, Nanjing Normal University, Nanjing 210023, P. R. China. E-mail: xulin001@njnu.edu.cn
fNanjing IPE Institute of Green Manufacturing Industry, Nanjing 211100, Jiangsu, China
First published on 12th April 2022
Abstract
The activity of Pt catalysts for the electro-oxidation of methanol can be greatly enhanced by coupling the electron effect with morphological engineering. Herein, we report the use of bimetallic Pt–Co alloys with different molar ratios/morphologies as precursors for P doping to prepare high-efficiency electrocatalysts for the methanol oxidation reaction. We will demonstrate that the P doping could not only change the electron density around Pt atoms, but also significantly alter the original morphology of the alloy precursors. The strong electron affinity of P decreases the electron cloud density around Pt atoms, favorable for weakening the adsorption of poisonous CO-like intermediates and thus enhancing their electrocatalytic activity for methanol oxidation. In particular, the as-prepared ternary Pt3CoPn nanoparticles with branched morphologies exhibit a specific activity and mass activity for methanol oxidation of up to 5.62 mA cm−2 and 1790 mA mg−1, respectively, which are 2.3 and 1.1 times those of ternary Pt3CoPn spheres, 4.8 and 1.5 times those of commercial PtRu/C catalysts and surpass those of most Pt-based electrocatalysts reported in the literature. This study thus offers a vivid example to demonstrate the alloying of a transition metal and a non-metal element into active Pt catalysts for improving their electrocatalytic properties.
1 Introduction
Direct methanol fuel cells (DMFCs) are attractive next-generation power supplies for portable electronic devices due to their high energy conversion efficiency and high energy density.1–3 The key requirement for the widespread application of DMFCs is to develop high performance and cost-effective electrocatalysts. To date, platinum (Pt)-based nanomaterials are known to be state-of-the-art electrocatalysts of DMFCs.4,5 However, it is regrettable that the Pt-based catalysts are easily poisoned by CO-like intermediates during the methanol oxidation reaction (MOR) at the anode of DMFCs.6–9 Therefore, it is necessary to improve the anti-poisoning capability of Pt-based electrocatalysts to further promote the application of DMFCs.The past several years have witnessed the introduction of non-metal elements, e.g. N,10–12 P,13,14 and Te,15 into the platinum (Pt)-based nanoalloys to address their high cost and low electrochemical stability for the methanol oxidation reaction (MOR). Theoretically, alloying a non-metal element with higher electronegativity into Pt is favorable for overcoming its susceptibility to the poisonous carbon monoxide (CO)-like intermediates generated during the MOR. The molecular orbital of CO is  , which predicts the nature of the Pt–CO bond in Pt-based alloys. In brief, the chemisorption of CO on Pt starts with the donation of an electron pair from the σ2p bonding orbitals of CO to the unfilled 5d-orbitals of Pt, followed by a back donation of electrons from the Pt metal to the CO
  anti-bonding orbitals for further enhancing their interaction. In this sense, the non-metal element will lead to a decrease in electron cloud density around Pt atoms due to its higher electron affinity so that they are not capable of back-donating the CO
  antibonding orbitals, thus improving their CO tolerance as well as intrinsic catalytic performance for the MOR.
In addition, the facile adsorption of hydrogen on phosphides could also be beneficial to the dehydrogenation during electrooxidation of methanol.16,17 Unfortunately, it is difficult to directly dope P into Pt. Recent reports suggest that introducing the metalloid phosphorous into alloys composed of Pt and transition metals (TMs) to form Pt–TM–P compounds is a promising strategy for P doping.18–20 Moreover, compared with single metal phosphides, mixed metal phosphides often exhibit a more remarkable MOR performance due to the synergistic effect of different components. Notably, the insertion of hetero-metal cations would be able to enhance the charge transfer rate and modulate the electronic structure of the active metals, which can effectively reduce the kinetic energy barriers in the electrochemical processes.21–24
Here, in this present work, we report our findings in using bimetallic Pt–Co alloys with different molar ratios/morphologies as precursors for P doping. As we will demonstrate later, we found that the P doping could significantly alter the original morphology of the alloy precursors. Typically, worm-like Pt–Co nanoalloys at 1/1 and 3/1 Pt/Co ratios turn into nanospheres after P doping. More interestingly, when we use branched Pt–Co nanoalloys as precursors, although the P doping induces apparent changes in their original overall sizes and morphologies, the branched structures could be maintained. This unique structure endows the resultant Pt–Co–P nanoparticles with additional benefits for catalyzing the MOR in an acidic medium at room temperature as the branches usually have rich tip, edge and corner atoms, which are more active for catalytic reactions.25–30 In specific, the as-prepared ternary Pt3CoPn branches exhibit a specific activity and mass activity for the MOR of up to 5.62 mA cm−2 and 1790 mA mg−1, respectively, which are 2.3 and 1.1 times those of ternary Pt3CoPn spheres, 4.8 and 1.5 times those of commercial PtRu/C catalysts, and surpass those of most Pt-based electrocatalysts reported in the literature, suggesting their application potential in catalyzing the anodic reaction in DMFCs.
2 Results and discussion
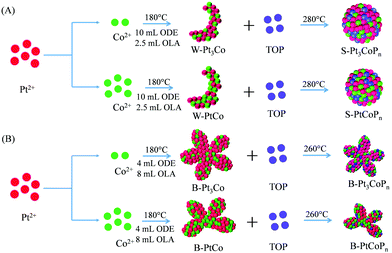
Fig. 1A shows the schematic illustration for synthesizing home-made worm-like Pt, Pt–Co alloy and spherical Pt–Co–P ternary nanoparticles. At a 4/1 volume ratio of 1-octadecene and oleylamine, both the sole Pt and Pt–Co alloy nanoparticles at 3/1 and 1/1 Pt/Co ratios are worm-like, labeled as W-Pt-HM, W-Pt3Co, and W-PtCo, respectively. Notably, after phosphating for 2 h by TOP at an elevated temperature (280 °C), the morphology of the Pt–Co alloys changes a lot, from original W-Pt3Co and W-PtCo to spherical Pt3CoPn and PtCoPn, labeled as S-Pt3CoPn and S-PtCoPn, respectively. This change is partly in line with the investigations in the Pt-Ru-P system, in which the phosphating of PtRu alloy particles leads to a reduction in their mean sizes.31–33 However, the details behind this distinct change in morphology are yet to be studied. A possible reason is that the phosphating occurs preferentially at the tips, edges and corners of the worm-like particles, resulting in smoothness or re-construction of their morphologies.The X-ray diffraction (XRD) pattern was firstly obtained to examine the crystal phases of the as-prepared Pt, Pt–Co and Pt–Co–P samples. As shown in Fig. S1 of the ESI,† the XRD pattern of home-made worm-like Pt (W-Pt-HM) nanoparticles presents face-centered cubic (fcc) phase characteristics, in which the diffraction peaks at 2θ of 39.76°, 46.24°, 67.45°, 81.29°, and 85.71° correspond to the (111), (200), (220), (311), and (222) planes of fcc Pt metal (JCPDS card No. 04-0802), respectively. For the W-Pt3Co and W-PtCo nanoparticles, their diffraction peaks are located between the fcc Pt metal and fcc Co metal (JCPDS card No. 15-0806), indicating the formation of uniform alloys.34 After phosphating by TOP at 280 °C for 2 h, the XRD patterns of the resultant S-Pt3CoPn and S-PtCoPn nanoparticles remain the fcc phase structure, manifesting the formation of a solid solution among Pt, Co and P elements, which is in agreement with the XAS analysis of the Pt–CoP system.35 It is noteworthy that the P incorporation in Pt–Co bimetallic alloys leads to a shift in the diffraction peaks to higher angles, which might be attributed to the substitution of smaller P elements for metal atoms in the space lattice that shortens the lattice distance.13,36,37
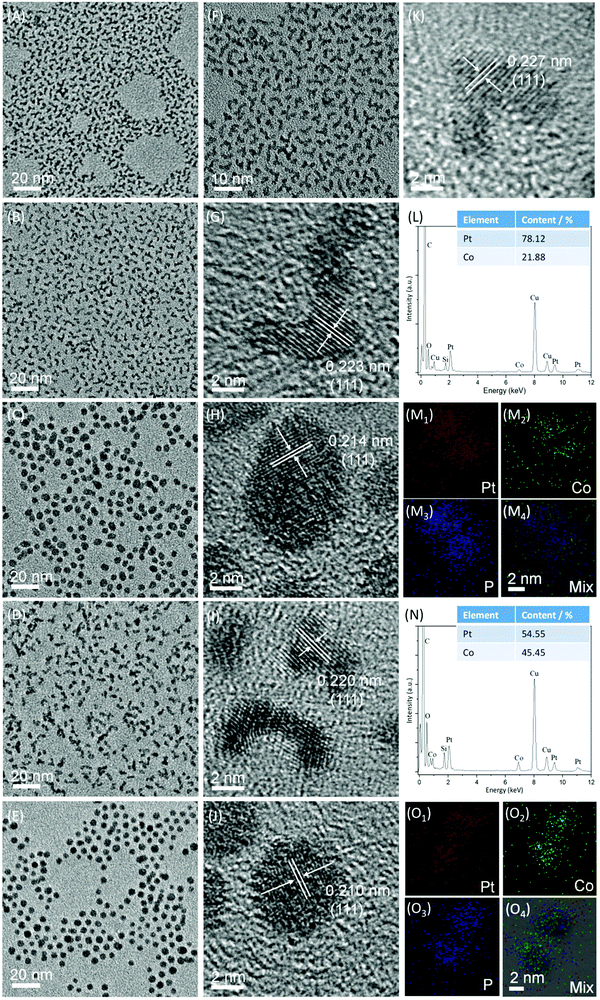
Fig. 2A and F are the transmission electron microscopy (TEM) images of W-Pt-HM nanoparticles at different magnification, in which their worm-like morphologies could be clearly observed. After alloying with Co at a 3/1 Pt/Co ratio, the as-prepared Pt3Co nanoalloys retain the same worm-like morphology as that of W-Pt-HM nanoparticles, as shown in Fig. 2B. As listed in the inserted table of Fig. 2L, the EDX analysis shows that the atomic percentages of Pt and Co in the Pt3Co nanoalloys are 78.12% and 21.88%, respectively, close to the inductively coupled plasma atomic emission spectroscopy (ICP-AES) results (3.93/1, Table S1, ESI†) and the 3/1 feeding ratio. However, the further phosphating by TOP at 280 °C induces significant change in the morphologies. As evinced by Fig. 2C, spherical Pt3CoPn nanoparticles are produced as dominant products, and their average diameter is ca. 4.48 nm with a standard deviation of 0.03 nm (Fig. S2A, ESI†). The EDX spectrum shown in the Fig. S2B (ESI†) confirms the presence of relevant elements, i.e. Pt, Co, and P in the alloy particles after phosphating, and the elemental mappings of two arbitrary S-Pt3CoPn particles obtained under scanning TEM (STEM) mode (Fig. 2M1–M4) suggest the uniform distribution of Pt, Co, and P in each particle, also corroborating the formation of ternary solid solution. Through ICP-AES measurements (Table S1, ESI†), the Pt/Co/P ratio in the S-Pt3CoPn nanoparticles is determined to be 4.2![[thin space (1/6-em)]](https://www.rsc.org/images/entities/char_2009.gif) :
:![[thin space (1/6-em)]](https://www.rsc.org/images/entities/char_2009.gif) 1.0
1.0![[thin space (1/6-em)]](https://www.rsc.org/images/entities/char_2009.gif) :
:![[thin space (1/6-em)]](https://www.rsc.org/images/entities/char_2009.gif) 2.7.
2.7.
Also, as labeled in the high-resolution TEM (HRTEM) images, the d-spacing values that are indexed to the fcc (111) planes are ca. 0.227 nm, 0.223 nm, and 0.214 nm for W-Pt-HM (Fig. 2K), W-Pt3Co (Fig. 2G), and W-Pt3CoPn nanoparticles (Fig. 2H), respectively. Obviously, alloying Co atoms into the Pt lattice leads to lattice contraction as the interplanar spacing of the Pt3Co alloy is smaller than that of sole Pt. In addition, when P is introduced into the Pt3Co alloy particles for forming a ternary solid solution, the d-spacing further decreases, which is consistent with the XRD results (Fig. S1, ESI†).
With an increase of the Co ratio, the as-prepared Pt–Co alloy nanoparticles are still worm-like, as evinced by Fig. 2D and I for the TEM and HRTEM images of the W-PtCo sample. The EDX spectrum suggests a Pt/Co ratio close to 1/1 in the W-PtCo particles, as listed by the inserted table in Fig. 2N. In comparison with that of W-Pt3Co nanoalloys, the length of the W-PtCo particles looks a little short visually. Analogous to the phenomenon occurring in the W-Pt3Co nanoalloys, the phosphating of W-PtCo by TOP also leads to a notable change in the particle morphologies, from worm-like to spherical, as proved in Fig. 2E and J of the TEM and HRTEM images of the S-PtCoPn products. The shrinkage in the d-spacing of the (111) planes due to P doping also occurs again, as indicated by the labels in Fig. 2I and J. For the S-PtCoPn ternary particles, the average diameter is ca. 4.40 ± 0.03 nm, as calculated by the Fig. S2C (ESI†) for the size distribution histogram. The presence of relevant Pt, Co, and P elements and their uniform distribution in each particle were similarly illustrated by the EDX spectrum (Fig. S2D, ESI†) and elemental mappings (Fig. 2O1–O4).
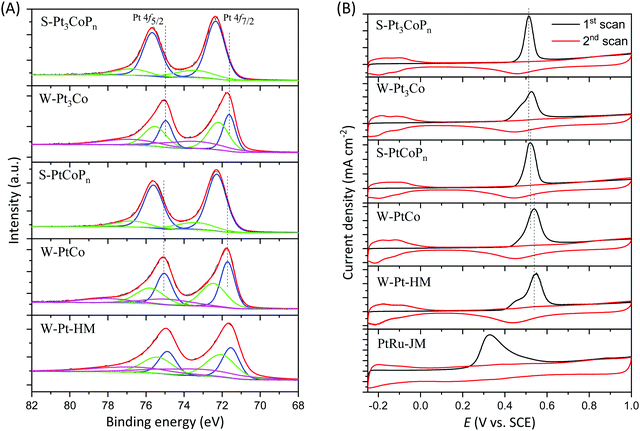
To verify the effect of P doping on the electronic feature of the Pt atoms, we conducted X-ray photoelectron spectroscopy (XPS) to characterize the as-prepared samples. Fig. 3A presents the 4f spectra of Pt in W-Pt-HM, W-Pt3Co, W-PtCo, S-Pt3CoPn, and S-PtCoPn nanoparticles. With respect to the W-Pt-HM, W-Pt3Co and W-PtCo nanoparticles, the Pt 4f spectra can be deconvoluted into three pairs of doublets, and their corresponding binding energies are summarized in the Table S2 (ESI†). The more intense doublet (71.54 and 74.87 eV for W-Pt-HM, 71.63 and 74.96 eV for W-Pt3Co, and 71.71 and 75.04 eV for W-PtCo) could be attributed to metallic Pt, while the inferior doublet (72.07 and 75.40 eV for W-Pt-HM, 72.20 and 75.53 eV for W-Pt3Co, and 72.46 and 75.79 eV for W-PtCo) and the weakest doublet (73.34 and 76.67 eV for W-Pt-HM, 73.50 and 76.83 eV for W-Pt3Co, and 74.80 and 78.13 eV for W-PtCo) are Pt2+ and Pt4+ states, respectively.38 Obviously, compared with those of the W-Pt-HM counterparts, the Pt 4f7/2 and 4f5/2 binding energies of W-Pt3Co and W-PtCo alloy nanoparticles shift to higher values due to the electronic interaction between Pt and Co atoms.39,40 Impressively, after P doping in the alloys, the Pt 4f7/2 and 4f5/2 peaks in the XPS spectra shift to higher values than those of alloy particles in the absence of the P element, as seen in Fig. 3A. In detail, as listed in the Table S2 (ESI†), the 4f7/2/4f5/2 binding energies of Pt0 and Pt2+ for S-Pt3CoPn are 72.34/75.67 eV and 74.43/76.76 eV, respectively, while for S-PtCoPn they are 72.28/75.61 eV and 73.40/76.73 eV, respectively. The more positive shift in Pt binding energies in the S-Pt3CoPn and S-PtCoPn samples could be expected as the non-metal P element has a stronger electron affinity than that of metals, inducing electron transfer from the metals to the P element.
We also analyzed the XPS spectra of Co and P in the relevant samples to examine the possible electronic interactions. For the Co in the W-Pt3Co and W-PtCo samples (Fig. S3A, ESI†), the XPS spectra suggest that the Co element is in the oxidative state, which could be attributed to the easy oxidization of small particles. When the P element is incorporated, the 2p XPS spectra of Co in the as-prepared S-Pt3CoPn and S-PtCoPn samples exhibit two additional peaks at 778.9 eV and 793.9 eV, respectively, which might be ascribed to Co-P.20,41 Correspondingly, as shown by the Fig. S3B (ESI†), the P 2p signals of S-Pt3CoPn and S-PtCoPn have two kinds of chemical states: the peaks located at 133.3 eV and 133.9 eV are indexed to oxidized phosphorus, while the peaks at 130.04 eV and 130.15 eV might be assigned to zero-valent phosphorus.42,43 Compared with red phosphorus (130.4 eV), the binding energies of zero valent P shift negatively by 0.36 eV and 0.25 eV for spherical S-Pt3CoPn and S-PtCoPn ternary nanoparticles, respectively, also suggesting the electronic interaction of P with the neighbouring Pt and Co atoms in the S-Pt3CoPn and S-PtCoPn samples.
As we have discussed, the decrease in electron density would weaken the chemisorption of CO-like intermediates on the Pt surface, favorable for catalyzing the MOR at ambient temperature. So MOR in an acidic medium was conducted to assess the activity of the Pt–Co alloys with or without P doping. First, the electrochemically active areas (ECSAs) of the as-synthesized Pt, Pt-based samples and commercial PtRu/C catalyst were calculated by integrating the Coulombic charge of the CO desorption and absorption region. As suggested by Fig. 3B and summarized in the Table S1 (ESI†), the ECSAs of W-Pt-HM, W-Pt3Co, S-Pt3CoPn, W-PtCo, S-PtCoPn, and commercial PtRu/C catalyst (PtRu-JM) are 73.5, 70.9, 66.4, 68.2, 62.3, and 100.0 m2 g−1, respectively. There are several features for the ECSAs: (1) the ECSA decreases slightly with the increase in the Co ratio in the Pt–Co alloys (i.e. W-Pt-HM > W-Pt3Co > W-PtCo), suggesting that the increase of Co ratio in the Pt–Co alloys has surface dilution of Pt; (2) doping P in the Pt–Co alloys leads to a further decrease in their ECSAs, also probably due to the surface dilution; (3) in comparison with that of the commercial PtRu/C catalyst, the lower ECSAs of the as-prepared samples are most likely due to the presence of residual impurities absorbed on their surfaces and relatively larger sizes (the average size for PtRu-JM is ca. 3 nm). Also, as shown in Fig. 3B, the CO stripping peak potentials of both S-Pt3CoPn and S-PtCoPn are smaller than those of the corresponding W-Pt3Co and W-PtCo samples, illustrating a more facile removal of the CO-like intermediates, as we have expected through the theoretical analysis. The ease of CO removal over S-Pt3CoPn and S-PtCoPn indicates the effectiveness of P doping in the Pt–Co alloys. Notably, the commercial PtRu/C catalyst has the lowest CO stripping potential among all samples, and this is because the oxophilic metal Ru could efficiently absorb and dissociate water to produce oxygen-containing species for oxidizing the CO in time.
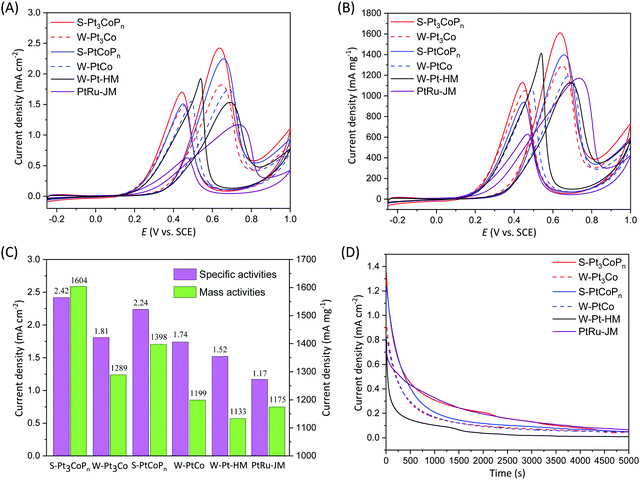
The S-Pt3CoPn and S-PtCoPn nanoparticles were examined for their activity towards the MOR at ambient conditions, and benchmarked against their alloy precursors (i.e. W-Pt3Co and W-PtCo) and commercial PtRu/C catalysts from Johnson Matthey (PtRu-JM). Cyclic voltammograms of the MOR are obtained in an acidic electrolyte (0.1 M HClO4 and 1 M CH3OH) and in the potential window of −0.25 to 1 V vs. a saturated calomel electrode (SCE) at a sweeping rate of 50 mV s−1. The current densities in the cyclic voltammograms are normalized in reference to the ECSA and Pt mass of the catalysts, as shown in Fig. 4A and B, respectively. As compared in Fig. 4C for the histograms of the peak current densities associated with the MOR in the forward scans, the S-Pt3CoPn nanoparticles exhibit not only the highest specific activity of up to 2.42 mA cm−2 but also the highest mass activity of up to 1604 mA mg−1, suggesting that the P doping in Pt–Co alloys could indeed enhance their electrocatalytic activity for acidic MOR. Electrochemical impedance spectroscopy (EIS) was employed to probe the kinetics of methanol oxidation at 0.5 V vs. a saturated calomel electrode, as shown in Fig. S4 (ESI†). As clearly observed, the order of the diameter of the semicircle is: S-Pt3CoPn < S-PtCoPn <W-Pt3Co < W-PtCo < W-Pt-HM, suggesting that S-Pt3CoPn has the lowest charge transfer resistance and fastest electrochemical kinetics, which is in agreement with the methanol oxidation activity in Fig. 4C. The long-term performance of the relevant catalysts in ambient MOR is shown in Fig. 4D for the chronoamperograms at 0.5 V. As evinced, the durability of S-Pt3CoPn nanoparticles for the MOR is comparable to that of the commercial PtRu/C catalyst, and their more gradual decay is observed, indicating that they have better tolerance toward CO-like intermediates during the MOR.
Inspired by the promotion of P doping in Pt–Co alloys for electro-catalyzing the MOR at ambient conditions, we tried to further increase their MOR performance by combining the P doping with morphology engineering. The Pt–Co nanoalloys with branched morphologies are easily prepared by changing the volume ratio of 1-octadecene and oleylamine from 4/1 to 1/2. Then, interestingly, as shown schematically by Fig. 1B, we experimentally found that although the P doping could induce apparent changes in overall sizes and morphologies, the original branched structures of the Pt–Co alloy precursors could be maintained, endowing the resultant Pt–Co–P nanoparticles with additional benefits for catalyzing electrochemical reactions.
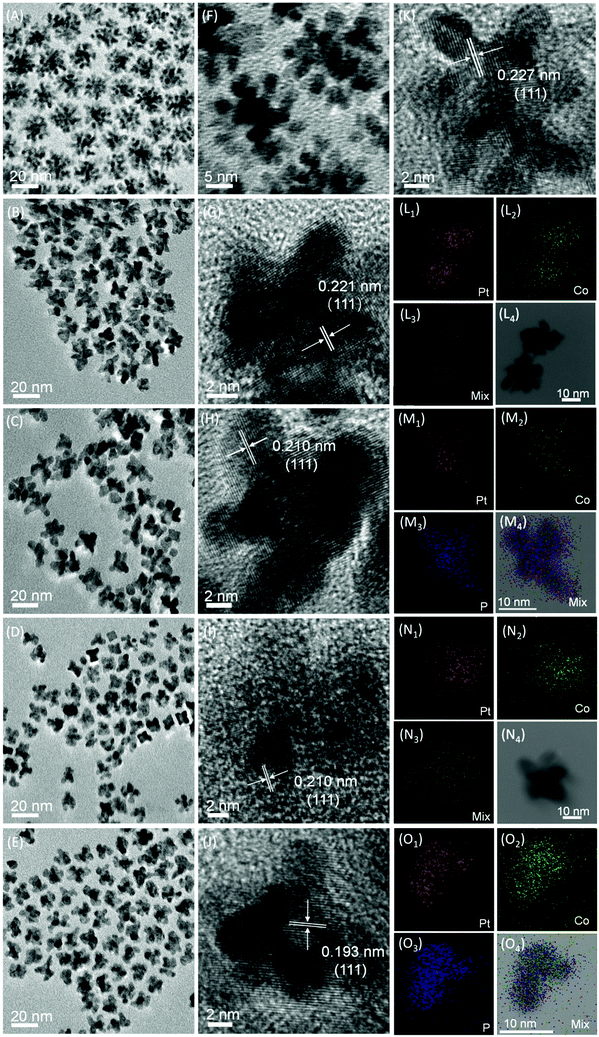
The home-made Pt nanoparticles in 1-octadecene/oleylamine with a 1/2 volume ratio were characterized by TEM images, as shown in Fig. 5A and F, where the branched morphologies are clearly observed with an overall average size of ca. 22.87 nm (Fig. S5A, ESI†). We label the branched home-made Pt nanoparticles as B-Pt-HM and hereafter, as displayed by Fig. 5A and F, the average number of branches in each B-Pt-HM particle is 7. After alloying with Co at 3/1 and 1/1 ratios, the resultant Pt3Co and PtCo alloy particles still maintain the branched morphologies, labeled as B-Pt3Co and B-PtCo, respectively, as shown by Fig. 5B and D for their TEM images, but changes occur in their average sizes (as seen in the Fig. S5B and D, ESI†) and branch numbers in each particle. For the B-Pt3Co particles, they have an overall average size of 18.97 nm and branch number of 4, while for the B-PtCo particles, the average size and branch number are 15.76 nm and 4, respectively. Interestingly, different from phosphating the worm-like Pt–Co alloys, the phosphating of branched Pt–Co alloys by TOP at an elevated temperature does not alter their original branched morphologies, as evinced by the TEM images in Fig. 5C and E. The as-prepared Pt3CoPn and PtCoPn nanoparticles with branched morphologies are therefore labeled as B-Pt3CoPn and B-PtCoPn, respectively. They have same branch numbers and slightly small sizes (ca. 18.59 and 15.26 nm) compared with their alloy precursors, i.e. B-Pt3Co and B-PtCo, respectively, as seen in the Fig. S5C and E (ESI†). The presence of relevant elements in the corresponding samples is illustrated by their EDX spectra, as shown in the Fig. S6 (ESI†), and their detailed ratios were further analyzed by ICP-AES, as listed in the Table S3 (ESI†). In addition, both the formation of alloy phases in B-Pt3Co and B-PtCo particles and solid solutions in B-Pt3CoPn and B-PtCoPn samples are proved by the element mappings obtained under the STEM mode, as shown by Fig. 5L–O, in which the uniform distributions of relevant elements in each particle are the only feature that can be observed.
As disclosed by the HRTEM images (Fig. 5G–K), the interplanar spacing changes follow the same trend as that of the worm-like counterparts, i.e. alloying with Co and further phosphating result in a contraction in lattice spacing. This phenomenon is also corroborated by the XRD patterns, as shown in the Fig. S7 (ESI†), in which the shift of the Pt diffraction peaks to higher angles after alloying with Co and phosphating by TOP appears again.
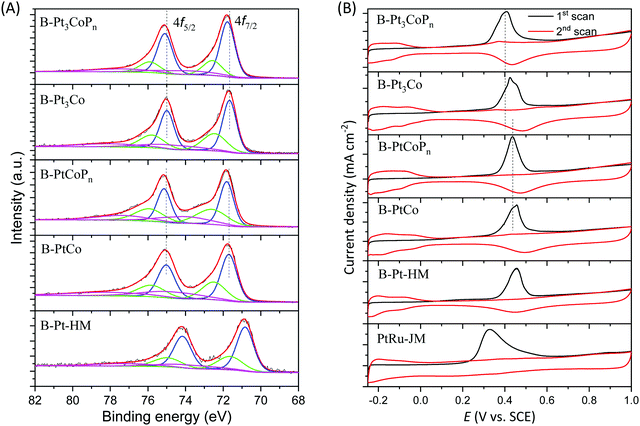
The chemical states of the branched samples were also examined using their XPS spectra. Slightly different from those of worm-like particles, the Pt 4f spectra of all the branched particles (i.e. B-Pt-HM, B-Pt3Co, B-PtCo, B-Pt3CoPn, and B-PtCoPn) could be deconvoluted into three pairs of doublets, as shown in Fig. 6A. The corresponding binding energies of these branched samples are summarized in the Table S4 (ESI†), in which the more intense doublet (70.83 and 74.16 eV for B-Pt-HM, 71.66 and 74.99 eV for B-Pt3Co, 71.69 and 75.02 eV for B-PtCo, 71.77 and 75.10 eV for B-Pt3CoPn, and 71.81 and 75.14 eV for B-PtCoPn) can be indexed to the metallic Pt, while the two weaker doublets with higher binding energies are the states of oxidized Pt, e.g. PtO or PtO2. Analogously, owing to the strong affinity of P for electrons, the P doping in the Pt–Co alloys induces a positive shift in Pt binding energies, as indicated by Fig. 6A and the data in the Table S4 (ESI†), also helpful to reduce the electron cloud density around the Pt atoms for easy removal of CO-like intermediates.
The CO stripping tests over B-Pt-HM, B-PtCo, B-PtCoPn, B-Pt3Co, B-Pt3CoPn, and commercial PtRu/C catalysts are shown in Fig. 6B, in which the commercial PtRu/C catalyst still has the lowest CO stripping potential. The trends for CO stripping potentials of B-Pt-HM, B-PtCo, B-PtCoPn, B-Pt3Co, and B-Pt3CoPn samples are also the same as those for the worm-like alloys before and after phosphating. In brief, the CO stripping potentials of B-Pt3CoPn and B-PtCoPn exhibit a negative shift in comparison with those of their alloy counterparts, i.e. B-Pt3Co and B-PtCo, indicating a weakened binding strength between CO and these ternary phosphides. The ECSAs of B-Pt-HM, B-PtCo, B-PtCoPn, B-Pt3Co, and B-Pt3CoPn based on integrating the Coulombic charge of the CO desorption and absorption region are 36.4, 29.2, 31.9, 24.5, and 28.4 m2 g−1, respectively. Their smaller values compared with those of the corresponding worm-like alloys and spherical phosphides could be ascribed to their relatively bigger sizes.
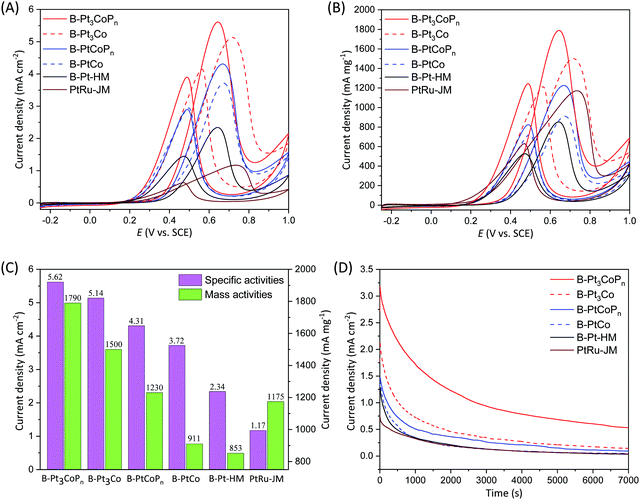
The cyclic voltammograms of the MOR over relevant branched catalysts in the same acidic electrolyte and potential window are shown in Fig. 7A and B, and the peak current densities based on ECSA and Pt mass associated with the MOR in forward scans are summarized in Fig. 7C in column form, which show that the branched B-Pt3CoPn catalyst exhibits not only the highest specific activity up to 5.62 mA cm−2 but also the highest mass activity up to 1790 mA mg−1 compared with the other branched samples (B-Pt-HM, B-Pt3Co, B-PtCo, B-PtCoPn and commercial PtRu/C). The specific activity of the B-Pt3CoPn catalyst is 1.1, 1.3, 1.5, 2.4, and 4.8 times that of the B-Pt3Co (5.14 mA cm−2), B-PtCoPn (4.31 mA cm−2), B-PtCo (3.72 mA cm−2), B-Pt-HM (2.34 mA cm−2), and commercial PtRu/C catalysts (1.17 mA cm−2), while these values for mass activity are 1.2, 1.46, 1.96, 2.1, and 1.5, respectively. The results of the EIS spectra (Fig. S8, ESI†) further show that the charge transfer resistance of B-Pt3CoPn is obviously lower than that of B-Pt3Co, B-PtCoPn, B-PtCo, and B-Pt-HM, which is also consistent with its higher MOR activities. Impressively, the excellent MOR activity of B-Pt3CoPn exceeds most of the Pt-based catalysts that have been reported in the literature, as we summarize in the Table S5 (ESI†). It is noteworthy that the MOR activity of branched Pt3CoPn particles (i.e. B-Pt3CoPn) is much higher than that of their spherical counterparts (i.e. S-Pt3CoPn), as shown by comparing Fig. 4, 7 and Table S5 in the ESI,† manifesting that the combination of phosphating with branched morphologies could further enhance the performance for electrochemical methanol oxidation. This could be expected as the branched structures are often rich in tip, edge and corner atoms, which are usually more active for catalytic reactions and therefore provide additional advantages for B-Pt3CoPn to electro-oxidize methanol in the acidic electrolyte.25–30
The chronoamperogram tests for branched samples in 0.1 M HClO4 with 1.0 M methanol at 0.5 V are shown in Fig. 7D. As exhibited, the activity declines over time for all of the catalysts, but the ternary B-Pt3CoPn nanoparticles still retain a relatively higher current density after the 7000 s test than that of the other catalysts. Fig. S9 (ESI†) shows the morphologies of B-Pt3CoPn and B-Pt3Co before and after the chronoamperogram tests. After chronoamperogram for 1 h, B-Pt3CoPn (Fig. S9C and D, ESI†) and B-Pt3Co (Fig. S9I and J, ESI†) are consistent with their original morphologies (Fig. S9A and B, S9G and H, ESI† respectively). After 2 h tests, the numbers and sizes of B-Pt3CoPn branches decrease a little, as shown in Fig. S9E and F, (ESI†) while most of the B-Pt3Co nanoparticles appear to be spherical (Fig. S9K and L, ESI†), suggesting that the P doping is helpful to improve the robustness of the alloy particles for the MOR.
3 Conclusions
In summary, we report the use of bimetallic Pt–Co alloys with different molar ratios/morphologies as precursors for P doping. The experimental results reveal that the P doping could significantly alter the original morphology of the alloy precursors. Typically, the worm-like Pt–Co nanoalloys after P doping change into spherical phosphides, while the branched Pt–Co nanoalloys after P doping maintain their original morphology but reduce in their overall sizes. The strong electron affinity of P decreases the electron cloud density around the Pt atoms, favorable for weakening the adsorption of poisonous CO-like intermediates and thus enhancing their electrocatalytic activity for methanol oxidation. In particular, benefiting from the additional advantages of a branched structure, the as-prepared ternary Pt3CoPn nanoparticles exhibit a specific activity and mass activity for the MOR of up to 5.62 mA cm−2 and 1790 mA mg−1, respectively, which are 4.8 and 1.5 times those of commercial PtRu/C catalysts and surpass those of most Pt-based electrocatalysts reported in the literature. This work provides a promising way to alloy a transition metal and a non-metal element into Pt catalysts for a high-efficiency anodic reaction in direct methanol fuel cells.Author contributions
N. Y. carried out the main materials synthesis and measurements. H. L. performed the TEM tests and analyses. Z. H., J. S., L. T. and P. C. assisted in the materials synthesis and XRD/XPS characterization. J. Y. and L. X. analyzed the data. N. Y. and H. L. wrote the original draft of the manuscript. J. Y. and L. X. conceptualized the ideas and supervised the writing of this work. All authors have given approval to the final version of the manuscript.Conflicts of interest
There are no conflicts to declare.Acknowledgements
Financial support from the National Natural Science Foundation of China (22075290, 21972068 and 21776292), the Beijing Natural Science Foundation (Z200012), the State Key Laboratory of Multiphase Complex Systems, Institute of Process Engineering, Chinese Academy of Sciences (MPCS-2021-A-05), and the Nanjing IPE Institute of Green Manufacturing Industry (E0010725) is gratefully acknowledged.References
- Y. Gao, J. Liu and S. Bashir, Catal. Today, 2021, 374, 135–153 CrossRef CAS PubMed.
- A. Kaur, G. Kaur, P. Singh and S. Kaushal, Int. J. Hydrogen Energy, 2021, 46, 15820–15849 CrossRef CAS.
- Z. Xia, X. Zhang, H. Sun, S. Wang and G. Sun, Nano Energy, 2019, 65, 104048 CrossRef CAS.
- A. A. Siller-Ceniceros, M. E. Sanchez-Castro, D. Morales-Acosta, J. R. Torres-Lubian, E. Martinez G. and F. J. Rodriguez-Varela, Appl. Catal., B, 2017, 209, 455–467 CrossRef CAS.
- V. Johanek, A. Ostroverkh and R. Fiala, Renewable Energy, 2019, 138, 409–415 CrossRef CAS.
- B. Steele and A. Heinzel, Nature, 2001, 414, 345–352 CrossRef CAS PubMed.
- M. Perry and T. Fuller, J. Electrochem. Soc., 2002, 149, S59–S67 CrossRef CAS.
- E. Antolini, Mater. Chem. Phys., 2003, 78, 563–573 CrossRef CAS.
- H. Liu, C. Song, L. Zhang, J. Zhang, H. Wang and D. Wilkinson, J. Power Sources, 2006, 155, 95–110 CrossRef CAS.
- A. Farzaneh, E. K. Goharshadi, H. Gharibi, N. Saghatoleslami and H. Ahmadzadeh, Electrochim. Acta, 2019, 306, 220–228 CrossRef CAS.
- J. Zhang, R. Wang, X. Hu, Z. Sun, X. Wang, Y. Guo, L. Yang, M. Lou and P. Wen, Appl. Surf. Sci., 2020, 533, 147319 CrossRef CAS.
- K. Huang, J. Zhong, J. Huang, H. Tang, Y. Fan, M. Waqas, B. Yang, W. Chen and J. Yang, Appl. Surf. Sci., 2020, 501, 144260 CrossRef CAS.
- Y. Ma, H. Wang, H. Li, J. Key, S. Ji and R. Wang, RSC Adv., 2014, 4, 20722–20728 RSC.
- W. Tian, Y. Wang, W. Fu, J. Su, H. Zhang and Y. Wang, J. Mater. Chem. A, 2020, 8, 20463–20473 RSC.
- W.-C. Geng, Y.-J. Zhang, L. Yu, J.-J. Li, J.-L. Sang and Y.-J. Li, Small, 2021, 17, 2101499 CrossRef CAS PubMed.
- S. Ye, W. Xiong, P. Liao, L. Zheng, X. Ren, C. He, Q. Zhang and J. Liu, J. Mater. Chem. A, 2020, 8, 11246–11254 RSC.
- J. Li, H.-X. Liu, W. Gou, M. Zhang, Z. Xia, S. Zhang, C.-R. Chang, Y. Ma and Y. Qu, Energy Environ. Sci., 2019, 12, 2298–2304 RSC.
- L. Yang, G. Li, R. Ma, S. Hou, J. Chang, M. Ruan, W. Cai, Z. Jin, W. Xu, G. Wang, J. Ge, C. Liu and W. Xing, Nano Res., 2021, 14, 2853–2860 CrossRef CAS.
- K. Deng, Y. Xu, D. Yang, X. Qian, Z. Dai, Z. Wang, X. Li, L. Wang and H. Wang, J. Mater. Chem. A, 2019, 7, 9791–9797 RSC.
- M. Zhao, K. Abe, S.-I. Yamaura, Y. Yamamoto and N. Asao, Chem. Mater., 2014, 26, 1056–1061 CrossRef CAS.
- R. Jiang, D. T. Tran, J. P. McClure and D. Chu, ACS Catal., 2014, 4, 2577–2586 CrossRef CAS.
- T. Li, Y. Wang, Y. Tang, L. Xu, L. Si, G. Fu, D. Sun and Y. Tang, Catal. Sci. Technol., 2017, 7, 3355–3360 RSC.
- S. Yin, Y. Xu, S. Liu, H. Yu, Z. Wang, X. Li, L. Wang and H. Wang, Nanoscale, 2020, 12, 14863–14869 RSC.
- S. Chen, X. Yang, X. Tong, F. Zhang, H. Zou, Y. Qiao, M. Dong, J. Wang and W. Fan, ACS Appl. Mater. Interfaces, 2020, 12, 34971–34979 CrossRef CAS PubMed.
- C. Hao, J. Gan, Y. Cao, W. Luo, W. Chen, G. Qian, X. Zhou and X. Duan, Catal. Today, 2021, 364, 157–163 CrossRef CAS.
- C. Li, X. Chen, L. Zhang, S. Yan, A. Sharma, B. Zhao, A. Kumbhar, G. Zhou and J. Fang, Angew. Chem., Int. Ed., 2021, 60, 7675–7680 CrossRef CAS PubMed.
- Y.-G. Feng, H.-J. Niu, L.-P. Mei, J.-J. Feng, K.-M. Fang and A.-J. Wang, J. Colloid Interface Sci., 2020, 575, 425–432 CrossRef CAS PubMed.
- H. J. Zhang, T. Watanabe, M. Okumura, M. Haruta and N. Toshima, Nat. Mater., 2012, 11, 49–52 CrossRef PubMed.
- J. Wu, L. Qi, H. You, A. Gross, J. Li and H. Yang, J. Am. Chem. Soc., 2012, 134, 11880–11883 CrossRef CAS PubMed.
- M. U. Khan, L. Wang, Z. Liu, Z. Gao, S. Wang, H. Li, W. Zhang, M. Wang, Z. Wang, C. Ma and J. Zeng, Angew. Chem., Int. Ed., 2016, 55, 9548–9552 CrossRef PubMed.
- H. Daimon and Y. Kurobe, Catal. Today, 2006, 111, 182–187 CrossRef CAS.
- X. Xue, J. Ge, C. Liu, W. Xing and T. Lu, Electrochem. Commun., 2006, 8, 1280–1286 CrossRef CAS.
- M.-L. Lin, M.-Y. Lo and C.-Y. Mou, Catal. Today, 2011, 160, 109–115 CrossRef CAS.
- D. Wang, H. L. Xin, R. Hovden, H. Wang, Y. Yu, D. A. Muller, F. J. DiSalvo and H. D. Abruna, Nat. Mater., 2013, 12, 81–87 CrossRef CAS PubMed.
- S. Ye, W. Xiong, P. Liao, L. Zheng, X. Ren, C. He, Q. Zhang and J. Liu, J. Mater. Chem. A, 2020, 8, 11246–11254 RSC.
- L. Zhang, M. Wei, S. Wang, Z. Li, L.-X. Ding and H. Wang, Chem. Sci., 2015, 6, 3211–3216 RSC.
- H. Lv, Y. Teng, Y. Wang, D. Xu and B. Liu, Chem. Commun., 2020, 56, 15667–15670 RSC.
- Z.-B. Wang, P.-J. Zuo, G.-J. Wang, C.-Y. Du and G.-P. Yin, J. Phys. Chem. C, 2008, 112, 6582–6587 CrossRef CAS.
- J. Sun, M. Dou, Z. Zhang, J. Ji and F. Wang, Electrochim. Acta, 2016, 215, 447–454 CrossRef CAS.
- T. Toda, H. Igarashi, H. Uchida and M. Watanabe, J. Electrochem. Soc., 1999, 146, 3750–3756 CrossRef CAS.
- L. Feng, K. Jiang, H. Xue, W.-B. Cai, C. Liu and W. Xing, J. Mater. Chem. A, 2016, 4, 18607–18613 RSC.
- X. Xue, J. Ge, T. Tian, C. Liu, W. Xing and T. Lu, J. Power Sources, 2007, 172, 560–569 CrossRef CAS.
- Y. Wang, F.-F. Shi, Y.-Y. Yang and W.-B. Cai, J. Power Sources, 2013, 243, 369–373 CrossRef CAS.
Footnote |
| † Electronic supplementary information (ESI) available: Experimental details, tables, and additional figures associated with the characterization of the samples in this study. See DOI: https://doi.org/10.1039/d2ma00357k |
| This journal is © The Royal Society of Chemistry 2022 |

