 Open Access Article
Creative Commons Attribution 3.0 Unported Licence
Preparation of MoS2@AuNP nanocomposite by a self-reduction method and its application for electrochemical glucose sensing†
Jiameng
Wang
,
Wuyi
Zhang
,
Lanlan
Chen
,
Jie
Huang
,
Xiaojia
Shi
,
Dong
Han
,
Jia
Wen
 * and
Hongyuan
Yan
 *
*
Key Laboratory of Pharmaceutical Quality Control of Hebei Province, College of Pharmaceutical Science, Institute of Life Science and Green Development, Hebei University, Baoding 071002, China. E-mail: wenjiahbu@163.com; yanhy@hbu.edu.cn
First published on 17th October 2022
Abstract
A kind of nanocomposite consisting of molybdenum disulfide (MoS2) and gold nanoparticles (AuNPs) was prepared by a simple self-reduction method. Transmission electron microscopy, X-ray diffraction and X-ray photoelectron spectroscopy were used to characterize the MoS2@AuNP nanocomposites. The as-prepared MoS2@AuNP nanocomposites were further used to modify a glassy carbon electrode to construct an electrochemical glucose biosensor. The electrochemical performance of the biosensor was evaluated using cyclic voltammetry, electrochemical impedance spectroscopy and differential pulse voltammetry. And it was found that the biosensor had prominent electrochemistry activity towards glucose. Under the optimized experimental conditions, a linear relationship in the range of 1–100 μM was detected between the difference of cathodic reduction current and the concentration of glucose, and the detection limit was 0.14 μM. The results showed that the biosensor exhibited good specificity, repeatability and reproducibility. In addition, the biosensor was also successfully applied for the determination of glucose concentrations in milk samples.
1. Introduction
The concentration of glucose has been regarded as an index of diabetes diagnosis and accordingly the accurate detection of glucose is of great significance.1 To date, there are two main kinds of glucose biosensors: enzyme-free biosensors2–5 and enzyme-based biosensors.6 Amongst various detection methods, enzyme-based glucose biosensors are widely used in different fields such as biological medicine, environmental monitoring and the food industry.6 However, the enzyme-based electrode is vulnerable to its environment, which always results in a poor selectivity and repeatability of biosensors.7 Therefore, it is still crucial to enhance the selectivity and repeatability of glucose biosensors, especially for some multicomponent complicated samples.Two-dimensional transition metal sulfides (TMDs) are one type of emerging layered nanomaterials that have attracted wide attention in recent years owing to their unique structures and properties.8,9 MoS2, as one of the most widely studied TMDs, has excellent thermal conductivity, electrical conductivity and high catalytic activity, thus showing great potential in biosensors, biocatalysis and biomedical applications.10 In particular, the large specific surface area and special electronic properties of MoS2 make it an excellent electrode material in the field of electrochemical sensors.11
And sulfur on the surface of a MoS2 layer can interact with noble metals, such as gold nanoparticles (AuNPs). AuNPs have attracted extensive attention from researchers due to their small particle size, large specific surface area and good biocompatibility.12 AuNPs can also accelerate the rate of electron transfer and are widely used as electrode modification materials in the field of electrochemistry.13,14 Nanocomposites consisting of MoS2 and AuNPs exhibit superior chemical and physical properties compared with single nanomaterials.15 For example, Lin and co-workers developed a cholesterol sensor with excellent performance based on MoS2 and AuNPs.16 Wang and colleagues prepared a rose-like AuNPs–MoS2–graphene composite and used it for the sensitive and accurate electrochemical sensing of rutin.17 According to previous literature reports, the combination of MoS2 with AuNPs is mainly achieved through the use of reducing agents,18 visible light irradiation or microwave heating in situ synthesis.19 The preparation process is usually complicated, and extra energy or additional reagents are needed. Although many studies on MoS2@AuNPs have been reported, simple and green methods to synthesize MoS2@AuNP nanocomposites are much needed.
Herein, in this work, MoS2@AuNP nanocomposites were synthesized using a simple self-reduction method. And then they were used to construct an electrochemical biosensor for the direct electrochemical detection of glucose. According to the literature,20 MoS2 nanosheets have a certain reducing ability and can directly react with metal precursors. Thereby, the loading of AuNPs on the surface of MoS2 nanosheets can be easily realized through adding HAuCl4 to a MoS2 nanosheet solution for simple mixing and stirring at normal temperature and pressure (Scheme 1a). By using different HAuCl4 concentrations, a series of MoS2@AuNP nanocomposites was prepared. The morphology and electrochemical performance of the as-prepared MoS2@AuNP nanocomposites were studied and the optimal one was selected for subsequent experiments. Firstly, the morphology and structure of the selected MoS2@AuNP nanocomposites were characterized. Then, MoS2@AuNP modified electrodes were prepared, and their electrochemical properties were explored using cyclic voltammetry (CV), electrochemical impedance spectroscopy (EIS), etc. Further, an electrochemical glucose biosensor based on MoS2@AuNP nanocomposites was constructed for the detection of glucose (Scheme 1b).
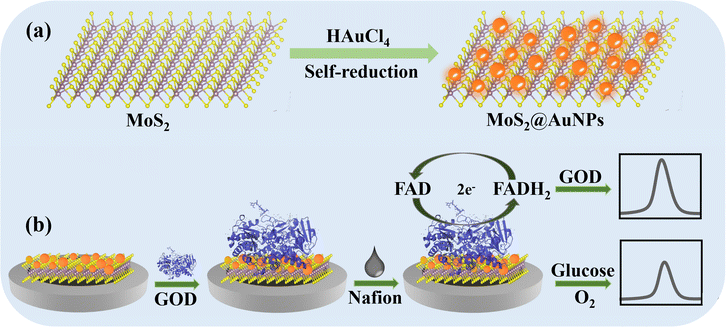 | ||
| Scheme 1 Schematic diagram of (a) the assembly of MoS2@AuNP nanocomposites and (b) the preparation process and sensing mechanism of an electrochemical glucose sensor based on MoS2@AuNPs. | ||
2. Experimental section
2.1 Reagents and apparatus
MoS2 powder (99%), disodium hydrogen phosphate (Na2HPO4), sodium dihydrogen phosphate (NaH2PO4), potassium hexacyanoferrate (III) (K3[Fe(CN)6]), potassium hexacyanoferrate (II) (K4[Fe(CN)6]), potassium chloride (KCl) and D-glucose (99%) were purchased from Innochem, Beijing. Glucose oxidase (GOD) was purchased from Aladdin, Shanghai. 5% Nafion was purchased from DuPont. HAuCl4 (98%, Au 47.8%), L-cysteine, dopamine, ascorbic acid and lactose were purchased from Energy Chemical, Shanghai. Hydrogen peroxide (H2O2) was purchased from DaMao, Tianjin.In addition, 0.1 M phosphate buffer solution (PBS) was prepared from Na2HPO4 and NaH2PO4. All aqueous solutions were prepared with ultrapure Milli-Q water (18.3 MΩ cm−1) and all chemicals were of analytical grade or better and used without further purification.
A traditional three-electrode system was used: GCE as working electrode (3 mm in diameter), platinum wire electrode as counter electrode and saturated calomel electrode (SCE) as reference electrode. The GCE, platinum wire electrode, SCE and alumina polishing powder (1.0 μm, 0.3 μm and 0.05 μm) were purchased from Shanghai Chenhua Instrument. All applied potentials were relative to the reference electrode.
All electrochemical experiments were performed on an electrochemical workstation (CHI 760E, Chenhua Instrument Co. Ltd, Shanghai, China). The morphology of the materials was characterized using transmission electron microscopy (TEM, FEI Tecnai G2 F20, USA). The elemental composition of the materials was determined by X-ray photoelectron spectroscopy (XPS, Thermo Scientific K-Alpha, USA). The crystal structure of the materials was determined by powder X-ray diffraction (PXRD, Bruker D8 ADVANCE, Germany).
2.2 Preparation of exfoliated MoS2 nanosheets
Exfoliated MoS2 nanosheets were prepared by liquid phase exfoliation according to a previously published work.21 Firstly, 250 mg of commercial MoS2 powder was added into 100 mL of NMP. The solution was treated with ultrasound at 100% (200 W) amplitude in an ice bath for 6 h. Then, the un-exfoliated MoS2 powder was separated by centrifugation (2000 rpm, 0.5 h) and could be reused for subsequent exfoliation. Finally, the supernatant was further centrifuged at 11![[thin space (1/6-em)]](https://www.rsc.org/images/entities/char_2009.gif) 000 rpm for 15 min. The precipitate was collected and washed with water and ethanol several times and then dried in a vacuum at room temperature, to obtain the exfoliated MoS2 nanosheets.
000 rpm for 15 min. The precipitate was collected and washed with water and ethanol several times and then dried in a vacuum at room temperature, to obtain the exfoliated MoS2 nanosheets.
2.3 Preparation of MoS2@AuNP nanocomposite
The MoS2@AuNP nanocomposite was prepared by using a simple and green method according to a previously published work.9 Firstly, 10 mL of exfoliated MoS2 nanosheets (0.1 mg mL−1) was added into a round-bottom flask. Then, 1 mL of HAuCl4 solution was slowly added under the stirring of magnetic stirrers (the concentration of HAuCl4 solution for different MoS2@AuNP nanocomposites was 1 mM, 3 mM, 5 mM, 7.5 mM, 10 mM, 15 mM and 20 mM, respectively) and stirred vigorously in an ice bath for 20 min continuously. The resulting mixture was centrifuged at 10![[thin space (1/6-em)]](https://www.rsc.org/images/entities/char_2009.gif) 000 rpm for 20 min, then washed with water and ethanol several times to remove the unreacted HAuCl4. Finally, the precipitate was collected and dried in a vacuum at room temperature, to obtain the MoS2@AuNP nanocomposite.
000 rpm for 20 min, then washed with water and ethanol several times to remove the unreacted HAuCl4. Finally, the precipitate was collected and dried in a vacuum at room temperature, to obtain the MoS2@AuNP nanocomposite.
2.4 Construction of electrochemical biosensors
Firstly, the GCE was mechanically polished with alumina of 1 μm, 0.3 μm and 0.05 μm. Next, the polished GCE was cleaned in a solution of 30% H2O2 at 65 °C for 15 min and then cleaned with ultrapure water. The GCE was then activated with dilute H2SO4 (0.05 M) using a CV approach with a potential range of −1 V to 2 V and a scanning rate of 50 mV s−1 for 4 cycles at room temperature. Then, 7 μL of (1 mg mL−1) MoS2@AuNP nanocomposite was drip-coated on the treated GCE and dried naturally. The obtained product was named MoS2@AuNPs/GCE, and was further washed with ultrapure water to remove the unbonded impurities. Afterward, 10 μL of GOD (10 mg mL−1) was dropped onto the surface of MoS2@AuNPs/GCE and dried overnight at 4 °C, to enable the binding of GOD to the surface of MoS2@AuNPs/GCE via physical adsorption, and then washed with ultrapure water several times to remove unbound GOD. Finally, 10 μL of Nafion (0.05%, Vwater![[thin space (1/6-em)]](https://www.rsc.org/images/entities/char_2009.gif) :
:![[thin space (1/6-em)]](https://www.rsc.org/images/entities/char_2009.gif) Vethanol = 1
Vethanol = 1![[thin space (1/6-em)]](https://www.rsc.org/images/entities/char_2009.gif) :
:![[thin space (1/6-em)]](https://www.rsc.org/images/entities/char_2009.gif) 1) was dropped onto the surface of GOD/MoS2@AuNPs/GCE to prevent enzyme leakage. The obtained Nafion/GOD/MoS2@AuNPs/GCE can be used as an electrochemical biosensor after 24 h incubation.
1) was dropped onto the surface of GOD/MoS2@AuNPs/GCE to prevent enzyme leakage. The obtained Nafion/GOD/MoS2@AuNPs/GCE can be used as an electrochemical biosensor after 24 h incubation.
2.5 Electrochemical measurements
CV and EIS data were measured in 5 mM [Fe(CN)6]3−/4− and 0.1 M KCl electrolyte. The frequency range was 0.05 Hz–100 kHz and the applied potential was the open circuit potential. Direct electrochemical measurements of GOD were conducted in 0.1 M PBS. The test voltage of CV ranged from −0.1 to −0.7 V and scanning rate was 50 mV s−1. Differential pulse voltammetry (DPV) measurements were carried out to measure the response of the biosensors in PBS (0.1 M) containing different concentrations of glucose. The test voltage of DPV ranged from −0.1 to −0.7 V.3. Results and discussion
3.1 Preparation and characteristics of MoS2@AuNPs
TEM was used to study the morphology and structure of a series of MoS2@AuNP nanocomposites formed at different HAuCl4 concentrations. As shown in Fig. S1 (ESI†), in comparison with the bare MoS2 nanosheets (Fig. S1a, ESI†), the surface of the MoS2@AuNP nanocomposites exhibited obvious black dots, indicating the successful loading of AuNPs onto the MoS2 nanosheets (Fig. S1b–h, ESI†). In addition, with the increase of HAuCl4 concentration, the size of the AuNPs increased from about 10 nm to 200 nm. Meanwhile, the AuNPs became more aggregated on the MoS2 nanosheets.Further, the electrochemical performances of a series MoS2@AuNP nanocomposites were studied using CV and EIS in 5 mM K3[Fe(CN)6]/K4[Fe(CN)6] and 0.1 M KCl solutions. The MoS2@AuNP nanocomposites were used as modified electrode materials. As depicted in Fig. 1, with increasing concentration of HAuCl4, the peak current densities of the CV curves also increased gradually, which was due to the strong conductivity of the AuNPs. The peak current density reached the maximum when the HAuCl4 concentration was 7.5 mM. However, when the HAuCl4 concentration continued to increase, the peak current density began to decrease. This was due to the fact that the presence of lots of AuNPs would increase the steric hindrance, thus inhibiting electron migration on the electrode surface. It can be seen in Fig. 1b that when the HAuCl4 concentration was 7.5 mM, the impedance value of the electrode was the lowest, which was consistent with the results of CV. In addition, it can be clearly seen that the conductivity of the electrode was the best when the concentration of HAuCl4 was 7.5 mM. Hence, the MoS2@AuNP nanocomposites synthesized using 7.5 mM HAuCl4 were selected for subsequent experiments.
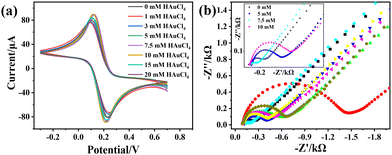 | ||
| Fig. 1 (a) CV response, (b) EIS response and (c) current response of MoS2@AuNP nanocomposites (the concentration of HAuCl4 was 1 mM, 5 mM, 7.5 mM, 10 mM, 15 mM and 20 mM, respectively). | ||
Next, the morphology and microstructure of the MoS2@AuNP nanocomposites synthesized using 7.5 mM HAuCl4 were investigated in detail using TEM. As illustrated in Fig. 2a and b, AuNPs were successfully loaded onto the surface of the MoS2 nanosheets, and the MoS2 nanosheets presented a few-layer nanosheet structure with a size of about 200 nm. The lamellar MoS2 nanosheets acted as a flexible substrate for the uniform growth of AuNPs. Fig. 2c shows a high-resolution transmission electron microscopy (HRTEM) image of the MoS2@AuNP nanocomposites. The observed lattice fringes of 0.66 nm correspond to the (002) crystal plane of the MoS2 nanosheets (JCPDS No. 37-1492).22 And lattice fringes of 0.23 nm, 0.20 nm and 0.14 nm correspond to the (111), (200) and (220) crystal planes of AuNPs (JCPDS No. 04-0784),2 which demonstrates the high crystallinity of the MoS2@AuNP nanocomposites. Fig. 2d shows that when the surface of the MoS2 nanosheets was modified with AuNPs, the color of the dispersion changed from dark grey to reddish-brown. This also illustrates the successful reduction and loading of AuNPs onto the surface of the MoS2 nanosheets. And the MoS2@AuNP dispersion was uniformly dispersed without obvious precipitation.
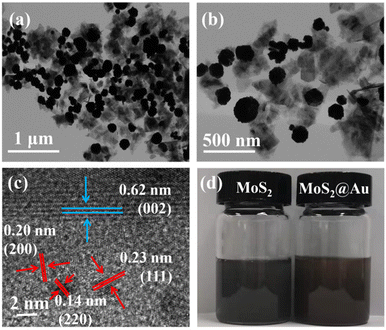 | ||
| Fig. 2 (a and b) TEM images of MoS2@AuNPs; (c) HRTEM image of MoS2@AuNPs; (d) a photo showing the dispersion of MoS2 nanosheets and MoS2@AuNPs in ultrapure water. | ||
The PXRD patterns of the MoS2@AuNP nanocomposites displayed diffraction peaks ranging from 10° to 70° (Fig. S2, ESI†). The diffraction peaks at 2θ values of 14.2°, 33° and 39.9° were ascribed to the (002), (100) and (103) planes, respectively, confirming that the hexagonal 2H-MoS2 phase formed (JCPDS No. 37-1492).22 Whereas, the diffraction peaks at 2θ values of 38.2°, 44.4° and 64.5° were assigned to the (111), (200) and (220) planes of AuNPs,6,23 which indicated the successful synthesis of the MoS2@AuNP nanocomposites. And the synthesis of AuNPs did not affect the crystal structure of MoS2.24
XPS was further used to analyze the elemental composition of the MoS2@AuNP nanocomposites and understand the exact details of the electronic state of the elements. The wide scan XPS spectrum of the MoS2@AuNP nanocomposites shows that the sample contained the elements Au, S, Mo, C and O (Fig. 3a). The two peaks at 84.2 eV and 87.9 eV in Fig. 3b correspond to the Au 4f7/2 and Au 4f5/2 binding energies, proving the formation of AuNPs.25 In particular, as can be seen from Fig. 3c and d, the binding energies of S 2p and Mo 3d were negatively shifted, while that of Au 4f was positively shifted compared with the standard XPS spectra of MoS2. This was because the electrons of the AuNPs were transferred to MoS2 and further formed Au–S bonds, indicating a strong binding force between the AuNPs and MoS2. These results also confirmed the successful synthesis of the MoS2@AuNP nanocomposites.
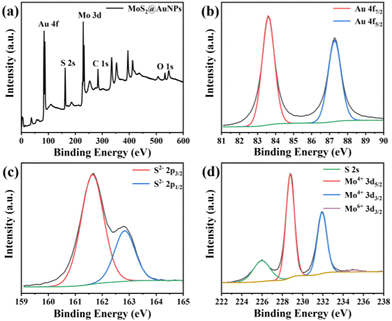 | ||
| Fig. 3 (a) Wide scan XPS spectrum of MoS2@AuNPs and high-resolution XPS spectrum of (b) Au 4f, (c) S 2p and (d) Mo 3d regions of MoS2@AuNPs. | ||
3.2 Electrochemical characterization of a glucose biosensor
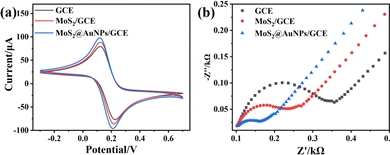
The electrochemical properties of the MoS2@AuNP modified electrodes were evaluated using CV and EIS measurements in a three-electrode system. Analysis of the redox reaction of [Fe(CN)6]3−/4− is widely used to investigate the kinetics of redox reactions and the surface features of electrodes. As shown in Fig. 4a, the conductivity of the electrode was slightly increased after the modification of exfoliated MoS2 nanosheets on the GCE compared to the bare GCE. When the electrode was decorated with the MoS2@AuNP nanocomposites, the peak current of CV reached the maximum owing to the strong conductivity of AuNPs. In addition, the results of EIS were consistent with those of CV (Fig. 4b).3.3 Optimization of experimental conditions
The modification of the MoS2@AuNP nanocomposites on the electrode can not only increase the electron transfer rate on the electrode surface, but also play an important role in loading GOD due to the large surface area of MoS2. In order to prepare a glucose electrochemical sensor with high sensitivity and specificity, the coating amounts of MoS2@AuNP nanocomposites on the electrode and the dropping concentration of GOD were explored and optimized. The current responses of the modified electrodes with different coating amounts of MoS2@AuNPs were investigated using CV. As shown in Fig. S3a (ESI†), with an increase of the coating amounts of MoS2@AuNPs, the response current of the electrode also increased continuously and reached the maximum value at 7 μL. However, when the coating amount of MoS2@AuNPs continued to increase, the response current decreased instead, showing a downward trend. This was mainly because the electrode modification layer was too thick, which led to an increase of steric hindrance on the electrode surface, thus hindering electron migration and reducing the current. Thus, 7 μL was deemed the optimal coating amount for the MoS2@AuNP nanocomposites.Next, the effect of the concentration of GOD on the performance of the glucose electrochemical sensor was studied. The concentration of GOD was varied in the range of 3–12 mg mL−1. As illustrated in Fig. S3b (ESI†), when the concentration of GOD was increased to 10 mg mL−1, the response current of the electrode reached the maximum. When the concentration of GOD was less than 10 mg mL−1, the extremely low concentration of GOD could only provide a few electrons, so the electron transfer rate on the electrode surface was low. However, when the concentration of GOD was higher than 10 mg mL−1, too much GOD would lead to an excessively thick modified layer of the electrode, which may hinder electron transfer and reduce the current response, thereby reducing the detection sensitivity of the sensor. Therefore, 10 mg mL−1 GOD was used for subsequent experiments.
3.4 Direct electrochemistry of GOD
The direct electrocatalytic activity of the MoS2@AuNP nanocomposite modified electrodes was evaluated in N2-saturated 0.1 M PBS (pH = 5.5) at a scan rate of 50 mV s−1. As shown in Fig. S4 (ESI†), in comparison with the bare GCE, MoS2/GCE and MoS2@AuNPs/GCE showed higher peak current densities because the surface area of the electrodes increased after modification with the MoS2@AuNP nanocomposites. However, after loading GOD, a slight decrease of peak current density can be observed because the redox reaction was inhibited by the resistance caused by GOD adsorption. In addition, after loading GOD, a pair of well-defined and nearly symmetric redox peaks appeared between −0.4 and −0.5, demonstrating that GOD was successfully immobilized and maintained good activity.In addition, the CV curves of Nafion/GOD/MoS2@AuNPs/GCE in N2-saturated 0.1 M PBS at pH 5.5 were recorded at different scan rates ranging from 50 to 500 mV s−1. As shown in Fig. S5a (ESI†), with increasing scan rate, the peak current also increased. Both anodic peak current (Ipa) and cathodic peak current (Ipc) showed a linear relationship with the scan rate, which indicated that the redox reaction of GOD was a reversible surface-controlled electrochemical process (Fig. S5b, ESI†).26
Since the activity of GOD is largely dependent on an appropriate pH environment, the detection performance of a glucose electrochemical sensor is closely related to the pH value of the electrolyte. Thus, the effect of pH of the electrolyte on the electrochemical behavior of GOD on the MoS2@AuNP modified electrodes was studied using CV with a scan rate of 50 mV s−1 in N2-saturated 0.1 M PBS with different pH values (Fig. 5). CV curves with stable and well-defined peaks were observed from pH 3.5 to 8.5, respectively, demonstrating that the direct electrochemistry of GOD can be achieved within the pH range of 3.5 to 8.5, which was the favorable environment for GOD. The maximum reduction current value was observed at pH 5.5. Thus, pH 5.5 was selected as the optimum pH for subsequent experiments. In addition, the formal redox potential shifted negatively with an increase of pH, indicating that the protonated process was easier at low pH than at high pH. Fig. 5c shows the relationship between pH and the formal redox potential of GOD, and it can be seen that the formal redox potential depends linearly on pH from 3.5 to 8.5 with a slope of 56.10 mV pH−1, which is close to the expected value of 58.6 mV pH−1, indicating that the direct electrochemistry of GOD occurring at the electrodes is a two proton and two electron transfer electrochemical process.27
Fig. S6 (ESI†) shows the redox reaction of GOD in N2-saturated and air-saturated 0.1 M PBS (pH = 5.5) with a scan rate of 50 mV s−1. In comparison with N2-saturated PBS, an obvious increase of cathodic peak current and decrease of anodic peak current in air-saturated PBS can be observed. This was because in the presence of O2, the reduced GOD (FADH2) was oxidized to generate oxidized GOD (FAD), leading to a reduced amount of GOD (FADH2) that can undergo oxidation reaction on the electrode, thus the oxidation current decreased. Meanwhile, the generated oxidized GOD (FAD) would participate in the next round of reduction reaction, so the reduction current increased accordingly.27 This also indicated that the Nafion/GOD/MoS2@AuNPs/GCE modified electrode had good electrocatalytic activity towards dissolved oxygen in solution.
3.5 Detection of glucose
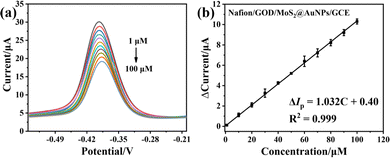
In the presence of glucose, oxidized GOD (FAD) will oxidize glucose to form reduced GOD (FADH2), resulting in a reduction of GOD (FAD), which is reflected in the decline of reduction current of an electrochemical biosensor.28 According to this characteristic, a glucose electrochemical biosensor can be developed to detect glucose. Thus, an electrochemical glucose biosensor based on MoS2@AuNPs was developed under optimal experimental conditions. The traditional DPV technology was used in this work. Fig. 6a shows the DPV responses of Nafion/GOD/MoS2@AuNPs/GCE upon successive additions of glucose in air-saturated 0.1 M PBS (pH 5.5). The reduction current decreased with increasing concentration of glucose, while the difference of cathodic reduction currents increased with increasing concentration of glucose (Fig. 6b), and a linear relation ranging from 0 to 0.1 mM was obtained. The linear regression was ΔIp (μA) = 0.40 + 1.032Cglucose (mM), and the related correlation coefficient was 0.999. From the slope, the sensitivity of Nafion/GOD/MoS2@AuNPs/GCE was calculated to be 103.2 μA·mM−1. The detection limit with a signal-to-noise ratio of 3 was calculated to be 0.14 μM according to 3N/S, where N was the standard deviation of the blank signal and S was the sensitivity. In comparison with the direct electrochemical detection of glucose by the MoS2 nanosheet modified electrode, the MoS2@AuNP nanocomposite modified electrode had a lower detection limit and was more sensitive in the detection of glucose. Overall, the electrochemical sensor based on Nafion/GOD/MoS2@AuNPs/GCE shows enhanced electrocatalytic activity towards GOD ascribed to the better electrical conductivity of the MoS2@AuNP nanocomposites, enabling the redox reaction of GOD to be maximized, thereby realizing amplification of the electrochemical signal and effectively enhancing the sensitivity in glucose detection.3.6 Specificity, repeatability and reproducibility of biosensors
The ability to exclude potential interference from co-existing electroactive species in a simulated physiological environment is an important indicator for glucose biosensing. In this paper, possible interfering factors in the determination of glucose, such as L-Cys, ascorbic acid (AA), dopamine (DA), lactose and H2O2, were studied. As shown in Fig. S7a (ESI†), amperometric responses of Nafion/GOD/MoS2@AuNPs/GCE were observed when adding 3 mM glucose. However, the addition of 5 mM L-Cys, AA, DA, lactose or H2O2 caused almost no change in amperometric response. These results suggested the good specificity of Nafion/GOD/MoS2@AuNPs/GCE for practical applications.In addition, the repeatability and reproducibility of Nafion/GOD/MoS2@AuNPs/GCE were also investigated. As shown in Fig. S7b (ESI†), the detection performance of 6 independently prepared Nafion/GOD/MoS2@AuNPs/GCE electrodes towards 0.1 mM glucose was tested under the same conditions and the obtained RSD was 1.95%, indicating that Nafion/GOD/MoS2@AuNPs/GCE had good repeatability. Moreover, the same modified electrode was tested 10 times in parallel with 0.1 mM glucose under the same detection conditions, and the RSD was 2.9% (Fig. S7c, ESI†). The results demonstrated that Nafion/GOD/MoS2@AuNPs/GCE had good reproducibility.
3.7 Real sample analysis
In order to evaluate the application potential of this sensor in real samples, glucose concentration in milk was determined by the standard addition method using the prepared Nafion/GOD/MoS2@AuNPs/GCE. Fresh sterilized milk was diluted with 0.1 M PBS (pH = 5.5). The measured results are shown in Table 1. The recoveries of 10 μM and 20 μM glucose added to milk were 103.7% ± 0.5% and 108.3% ± 0.9%, respectively. What's more, the recoveries of 10 μM and 20 μM glucose added to fetal bovine serum (FBS) were 93.1% ± 1.6% and 99.0% ± 2.9%, respectively. The satisfactory recovery rate confirmed that Nafion/GOD/MoS2@AuNPs/GCE had good practicality and could be expected to be applied to glucose detection in biological samples.| Samples | Added (μM) | Found (μM) | RSD (%) | Recover (%) |
|---|---|---|---|---|
| Milk | 10 | 10.37 ± 0.05 | 0.44 | 103.7 ± 0.5 |
| Milk | 20 | 21.67 ± 0.17 | 0.75 | 108.3 ± 0.9 |
| FBS | 10 | 9.31 ± 0.16 | 1.67 | 93.1 ± 1.6 |
| FBS | 20 | 19.79 ± 0.59 | 2.97 | 99.0 ± 2.9 |
4. Conclusions
In conclusion, MoS2@AuNP nanocomposites were synthesized by a green and facile method. The electrochemical performance of the MoS2@AuNP nanocomposites was optimized by using a series of HAuCl4 concentrations. The results showed that the MoS2@AuNP nanocomposites synthesized with 7.5 mM HAuCl4 had the strongest conductivity and they were further used to construct a glucose electrochemical sensor. The as-prepared MoS2@AuNP nanocomposites showed not only an enhanced electron transfer rate on the electrode surface, but also improved sensitivity in glucose detection. In particular, in comparison with the glucose electrochemical sensor constructed using MoS2 nanosheets alone, the biosensor constructed based on the MoS2@AuNP nanocomposites exhibited a lower detection limit for glucose, and simultaneously exhibited excellent selectivity, repeatability and reproducibility. Taken together, the synergistic effect of AuNPs and MoS2 enhanced the capability of direct electrochemical detection of glucose.Conflicts of interest
There are no conflicts to declare.Acknowledgements
This work was financially supported by the Natural Science Foundation of Hebei Province (No. B2020201012), the Advanced Talents Incubation Program of Hebei University (No. 521000981345), the fund of Innovation Capacity Improvement Plan of Hebei Province (Grant No. 20567605H), the Post-graduate's Innovation Fund Project of Hebei University (No. HBU2021ss075) and Laboratory Open Project of Hebei University (No. sy202070).Notes and references
- O. Adeniyi, N. Nwahara, D. Mwanza, T. Nyokong and P. Mashazi, Sens. Actuators, B, 2021, 348, 130723 CrossRef CAS.
- Y. Liu, X. Cao, R. Kong, G. Du, A. M. Asiri, Q. Lu and X. Sun, J. Mater. Chem. B, 2017, 5, 1901–1904 RSC.
- Y. Qiao, Q. Liu, S. Lu, G. Chen, S. Gao, W. Lu and X. Sun, J. Mater. Chem. B, 2020, 8, 5411–5415 RSC.
- M. Wei, Y. Qiao, H. Zhao, J. Liang, T. Li, Y. Luo, S. Lu, X. Shi, W. Lu and X. Sun, Chem. Commun., 2020, 56, 14553–14569 RSC.
- Z. Wang, X. Cao, D. Liu, S. Hao, R. Kong, G. Du, A. M. Asiri and X. Sun, Chem. – Eur. J., 2017, 23, 4986–4989 CrossRef CAS PubMed.
- O. Adeniyi, S. Sicwetsha and P. Mashazi, ACS Appl. Mater. Interfaces, 2020, 12, 1973–1987 CrossRef CAS PubMed.
- Y. Song, M. Xu, C. Gong, Y. Shen, L. Wang, Y. Xie and L. Wang, Sens. Actuators, B, 2018, 257, 792–799 CrossRef CAS.
- H. Yang, J. Zhou, J. Bao, Y. Ma, J. Zhou, C. Shen, H. Luo, M. Yang, C. Hou and D. Huo, Microchem. J., 2021, 162, 105746 CrossRef CAS.
- C. Hong, L. Chen, C. Wu, D. Yang, J. Y. Dai, Z. Huang, R. Cai and W. Tan, Nano Res., 2022, 15, 1587–1592 CrossRef CAS.
- M. Ahmaruzzaman and V. Gadore, J. Environ. Chem. Eng., 2021, 9, 105836 CrossRef CAS.
- K. Hu, J. Cheng, K. Wang, Y. Zhao, Y. Liu, H. Yang and Z. Zhang, Talanta, 2022, 238, 122987 CrossRef CAS PubMed.
- T. Yang, Z. Luo, Y. Tian, C. Qian and Y. Duan, TrAC, Trends Anal. Chem., 2020, 124, 115795 CrossRef CAS.
- Z. Yang and J. You, Colloids Surf., A, 2021, 612, 126064 CrossRef CAS.
- L. F. Lima, A. Freitas, A. L. Ferreira, C. C. Maciel, M. Ferreira and W. R. Araujo, Sensor. Actuator. Rep., 2022, 4, 100102 CrossRef.
- Y. Zhang, X. Li, D. Li and Q. Wei, Colloids Surf., B, 2020, 186, 110683 CrossRef CAS PubMed.
- X. Lin, Y. Ni and S. Kokot, Sens. Actuators, B, 2016, 233, 100–106 CrossRef CAS.
- Y. Wang, B. Zhang, Y. Tang, F. Zhao and B. Zeng, Microchem. J., 2021, 168, 106505 CrossRef CAS.
- Y. Wang, Y. Liang, S. Zhang, T. Wang, X. Zhuang, C. Tian, F. Luan, S. Q. Ni and X. Fu, Microchem. J., 2021, 161, 105769 CrossRef CAS.
- H. Zhang, M. Fan, J. Jiang, Q. Shen, C. Cai and J. Shen, Anal. Chim. Acta, 2019, 1064, 33–39 CrossRef CAS PubMed.
- S. Su, C. Zhang, L. W. Yu, J. Chao, X. Zuo, X. Liu, C. Song, C. Fan and L. Wang, ACS Appl. Mater. Inter., 2014, 21, 18735–18741 CrossRef PubMed.
- Vignesh, S. Kaushik, U. K. Tiwari, R. K. Choubey, K. Singh and R. K. Sinha, Mater. Today: Proc., 2020, 21, 1969–1975 CAS.
- J. Shi, Y. Zhang, P. Wang, Y. Nie and Q. Ma, Talanta, 2022, 237, 122969 CrossRef CAS PubMed.
- Y. Yao, M. Xue, X. Chi, Y. Ma, J. He, Z. Abliz and F. Huang, Chem. Commun., 2012, 48, 6505–6507 RSC.
- W. C. Hu, J. Pang, S. Biswas, K. Wang, C. Wang and X. H. Xia, Anal. Chem., 2021, 93, 8544–8552 CrossRef CAS PubMed.
- L. Jia, Y. Zhou, K. Wu, Q. Feng, C. Wang and P. He, Bioelectrochemistry, 2020, 131, 107392 CrossRef CAS PubMed.
- L. Bai, R. Yuan, Y. Chai, Y. Yuan, Y. Wang and S. Xie, Chem. Commun., 2012, 48, 10972–10974 RSC.
- B. Çakıroğlu and M. Özacar, Electroanalysis, 2017, 20, 2719–2726 CrossRef.
- S. Palanisamy, C. Karuppiah and S. M. Chen, Colloids Surf., B, 2014, 114, 164–169 CrossRef CAS PubMed.
Footnote |
| † Electronic supplementary information (ESI) available. See DOI: https://doi.org/10.1039/d2ma00819j |
| This journal is © The Royal Society of Chemistry 2022 |

