 Open Access Article
A mesoporous ternary transition metal oxide nanoparticle composite for high-performance asymmetric supercapacitor devices with high specific energy†
Nourhan M.
Deyab‡
 ab,
Manar M.
Taha‡
a and
Nageh K.
Allam
 *a
*a
aEnergy Materials Laboratory, School of Sciences and Engineering, The American University in Cairo, New Cairo 11835, Egypt. E-mail: nageh.allam@aucegypt.edu
bPhysical Chemistry Department, National Research Centre, Dokki, Giza, Egypt
First published on 18th January 2022
Abstract
We report on the optimized fabrication and electrochemical properties of ternary metal oxide (Ti–Mo–Ni–O) nanoparticles as electrochemical supercapacitor electrode materials. The structural, morphological, and elemental composition of the fabricated Ti–Mo–Ni–O via rapid breakdown anodization are elucidated by field emission scanning electron microscopy, Raman, and photoelectron spectroscopy analyses. The Ti–Mo–Ni–O nanoparticles reveal pseudocapacitive behavior with a specific capacitance of 255.4 F g−1. Moreover, the supercapacitor device Ti–Mo–Ni–O NPs//mesoporous doped-carbon (TMN NPs//MPDC) device exhibited a superior specific energy of 68.47 W h kg−1 with a corresponding power density of 2058 W kg−1. The supercapacitor device shows 100% coulombic efficiency with 96.8% capacitance retention over 11![[thin space (1/6-em)]](https://www.rsc.org/images/entities/char_2009.gif) 000 prolonged charge/discharge cycles at 10 A g−1.
000 prolonged charge/discharge cycles at 10 A g−1.
Introduction
Electrochemical supercapacitors (ESCs) are very promising energy storage devices due to their high specific power and long life cycle.1,2 Nevertheless, their specific energy still needs auxiliary enhancement.3,4 The ESC performance depends on the behavior of the electrode materials (capacitance), where the specific energy is directly proportional to the specific capacitance.5,6 The electrodes store electric energy via the established electric double layer (EDLC) at the electrode/electrolyte interface or through the electrochemical redox reactions occurring at their surfaces.7,8 To this end, a plethora of conducting polymers and transition metal oxides (TMOs) have been investigated.9,10 TMOs with various oxidation states are well-established pseudocapacitive materials compared to their carbon-based counterpart materials.11 Among these materials, TiO2 has high structural stability and a wide potential window, allowing its use as a suitable supercapacitor electrode material.9,11–13 However, TiO2 still suffers from some obstacles, such as low ionic and electronic conductivities and low practical capacity. These challenges originate from the semiconducting nature of TiO2, which makes the material not an ideal current collector for real life high-performance supercapacitor devices.12,14 To overcome these problems and improve the characteristics of TiO2, doping13 or coating with Ni15 or polymers16 has been investigated. However, the reported specific energy is still below the threshold required for real devices, mainly due to the limited operating potential window.Herein, we demonstrate the ability to synthesize Ti-based ternary oxide (Ti–Mo–Ni) nanoparticles via simple breakdown anodization and their use as supercapacitor anode materials. The presence of Ni and Mo as pseudocapacitive elements enhanced the capacitive performance, resulting in high specific capacitance and exceptional cycle lifetime. Moreover, the ternary metal oxide composite exhibits higher specific energy compared to other transition metal-based supercapacitors due to its relatively wider operating potential window.
Experimental
Synthesis of the Ti–Mo–Ni nanoparticles
Ti–0.3Mo–0.8Ni foil (99% purity, Firmetal Co. Ltd) was ultrasonically cleaned in acetone, followed by deionized (DI) water. The anodization was carried out using Ti–Mo–Ni foil as the working electrode and platinum foil as the counter electrode in an ice bath at 20 V in 0.1 M HClO4. After the breakdown anodization, the powders were rinsed thoroughly with DI water and ethanol, followed by drying in a desiccator.Electrode fabrication
The electrodes for electrochemical analysis were prepared by mixing Ti–Mn–Ni nanoparticles (TMN NPs), carbon black, and polyvinylidene difluoride (PVDF) as a binder in dimethylformamide (DMF) at an 80![[thin space (1/6-em)]](https://www.rsc.org/images/entities/char_2009.gif) :
:![[thin space (1/6-em)]](https://www.rsc.org/images/entities/char_2009.gif) 10
10![[thin space (1/6-em)]](https://www.rsc.org/images/entities/char_2009.gif) :
:![[thin space (1/6-em)]](https://www.rsc.org/images/entities/char_2009.gif) 10 weight ratio to obtain a homogeneous slurry, followed by drop-casting on the current collector (graphite sheet), which was previously cleaned with acetone to remove any impurities on the surface and then dried under vacuum.
10 weight ratio to obtain a homogeneous slurry, followed by drop-casting on the current collector (graphite sheet), which was previously cleaned with acetone to remove any impurities on the surface and then dried under vacuum.
Characterization
The morphology of the TMN NPs was elucidated using field-emission scanning electron microscopy (FESEM, Zeiss SEM Ultra 60, 5 kV), which is coupled with energy dispersive X-ray spectroscopy (EDX; Oxford ISIS 310, England spectroscopy) for the elemental analysis. X-ray diffraction (XRD) patterns were recorded on a Panalytical Empyrean X-ray Diffractometer at 30 mA and 40 kV using Cu Kα radiation (λ = 0.15418 nm). The Raman spectrum was recorded using a dispersive Raman microscope (Pro Raman-L Analyzer) with a laser power of 1 mW and an excitation wavelength of 512 nm. X-ray photoelectron spectroscopy (XPS) was carried out on an ESCALAB 250Xi, Thermo Scientific, USA, with monochromatic X-ray Al K-alpha radiation (1350 eV). Surface area analysis was performed using the Brunauer–Emmett–Teller (BET) isotherm to determine the specific surface area of the material. The vacuum degassing was performed at 80 °C with a heating rate of 5 °C min−1, and then the material was soaked for 6 h. The BET adsorption/desorption measurements were performed in N2 gas at 77.35 K bath temperature.Electrochemical measurements
All electrochemical analysis was performed using a Biologic SP-300 potentiostat. A 1 × 1 cm2 electrode was made with an average loading mass of 1 mg cm−2 and was used in a standard three-electrode system with a saturated calomel electrode as the reference electrode and a platinum sheet as the counter electrode. Cyclic voltammetry (CV), galvanostatic charge and discharge (GCD), and electrochemical impedance spectroscopy (EIS) measurements were carried out in a 0.5 M aqueous potassium sulphate electrolyte. The frequency range for EIS was 100 mHz to 100 kHz with a 5 mV applied voltage amplitude. The specific capacitance (Csp) from cyclic voltammetry and galvanostatic charge and discharge was calculated using eqn (1) and (2): | (1) |
 | (2) |
| (mCspΔV)− = (mCspΔV)+ | (3) |
Results and discussion
Fig. 1a depicts the morphology of the resulting material after the breakdown anodization of the Ti–Mo–Ni alloy sheet. Note the formation of agglomerated nanoparticles with an average diameter of 20 nm. The breakdown anodization mechanism involves several consecutive events. In the beginning, an insulating oxide layer is developed at the alloy surface. Then, upon applying a sufficiently high electric field, this passivating layer is broken down, and chloride ions would inhibit the further growth of the oxide layer. Simultaneously, the metal ions would dissolve and form complexes with chloride ions. This was accompanied by vigorous hydrogen evolution at the cathode. Note that increasing the HClO4 concentration to 0.2 M resulted in the formation of a flower-like structure (Fig. S1†). The corresponding EDX elemental mapping of the formed nanoparticles is shown in Fig. 1b–e, revealing the existence of Ti, Mo, Ni, and O elements. The EDX analysis confirms the possibility of retaining all components of the alloy after anodization.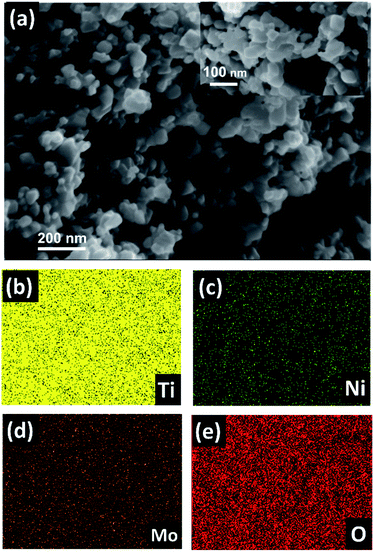 | ||
| Fig. 1 (a) FESEM image and (b–e) EDX elemental mapping of the as-prepared nanoparticles via breakdown anodization of the Ti–Mo–Ni sheet in a 0.1 M HClO4 aqueous electrolyte at 20 V. | ||
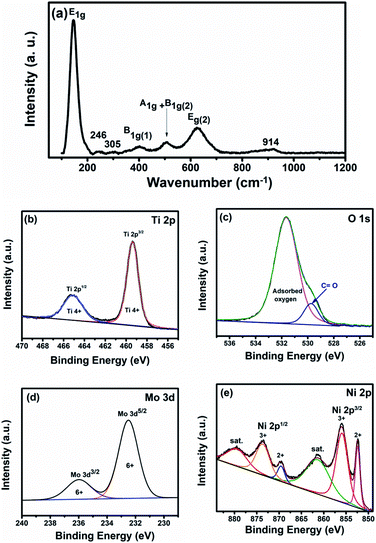
Fig. 2a shows the obtained Raman spectra of the as-prepared nanoparticles, revealing the characteristic bands of anatase: E1g at 143 cm−1, B1g at 400 cm−1, A1g + B1g at 504 cm−1, and E2g at 625 cm−1.17 From the bond length, Raman frequency, and covalency correlations, the relationship between the Ti–O bond length (L) and Raman shift frequency (T) can be elucidated according to eqn (4)18
| T = 722e−1.54946(L−1.809) | (4) |
Based on the observed Raman bands at 625, 504, and 400, the estimated Ti–O bond lengths are 2 × 1.89, 3 × 2.03, and 2.14 Å, respectively, which are consistent with the slightly distorted TiO68− octahedron in the anatase phase (the calculated Ti–O bond lengths for bulk anatase are 4 × 1.9338 Å and 2 × 1.9797 Å).19 Moreover, the sharp peak at 147 cm−1 is consistent with Ti–Ti bonding in the octahedral chain with a bond length of 2.96 Å, in agreement with the literature.18,20 Also, two different Raman bands were detected at 246 and 305 cm−1 that can be ascribed to the orthorhombic Mo oxide phase. Besides, there is another broad weak peak observed at 914 cm−1, characteristic of the stretching vibration bond between Mo and oxygen.21,22 Additionally, bulk nickel oxide displays 1TO mode at ∼440 cm−1,23 where the observed peak at 400 is broader than that usually seen for pure anatase, i.e., the two peaks might be overlapped.
To elucidate the surface chemical composition of the fabricated Ti–Mo–Ni nanoparticles (TMN NPs) and the oxidation state of each element, the material was characterized via X-ray photoelectron spectroscopy (XPS), as shown in Fig. 2. Fig. 2b depicts the high-resolution spectra of Ti 2p. The spectrum can be ascribed to Ti 2p3/2 and Ti 2p1/2 at binding energies of ∼459.4 eV and 465 eV, with a spin–orbit splitting of ∼5.7 eV, indicating the existence of titanium in the Ti4+ oxidation state.24Fig. 2c illustrates the O 1s photoemission spectra with the peak located at 530.4 eV referring to the intrinsic oxygen ions in the metal oxide lattice, and the peak at 531.8 eV refers to the loosely bound oxygen (oxygen vacancies). Note the small shift in the O 1s peak of the TMN NPs to higher binding energy compared to that of pure TiO2 (530.8 eV). This shift may be attributed to the electronegativity discrepancies between the host atom and the inserted dopants (χTi = 1.5, χMo = 2.6, and χNi = 1.9).25–27 The addition of Ni and Mo (with higher electronegativity) to Ti decreases the Ti electronic cloud, which in turn increases the binding energies of O2− and Ti4+. Additionally, the Mo 3d high-resolution spectrum can be deconvoluted into two sub-peaks at 232.2 and 236 eV, characteristic of Mo 3d5/2 and Mo 3d3/2, respectively.28 A spin–orbit splitting can be proof of the existence of Mo in a hexavalent (Mo6+) oxidation state at around 3.8 eV, as shown in Fig. 2d.29 Furthermore, Ni 2p peaks can be fitted into four peaks at ∼856 and 873.7 eV corresponding to Ni3+ as well as 852.4 and 869.6 eV assigned to Ni30,31 as shown in Fig. 2e. Therefore, the XPS analysis confirms the existence of all components of the alloy in the oxide form.
Surface analysis of the Ti–Mo–Ni nanoparticle was performed via N2 adsorption/desorption isotherms as shown in Fig. 3a. Gas adsorption starts from 0.005P/P0 relative pressure followed by steep adsorption at low relative pressure < 0.2, pointing to possible intercalation between the micropores and the adsorbate. The isotherm reveals a type IV adsorption/desorption isotherm and type H3 hysteresis loop. Additionally, the hysteresis loop between 0.58 and 0.9P/P0 indicates the presence of mesopores together with micropores.32 The BET-specific surface area was found to be 88.2 m2 g−1 with an average pore diameter of 4.3 nm and pore volume of 0.33 cm3 g−1.
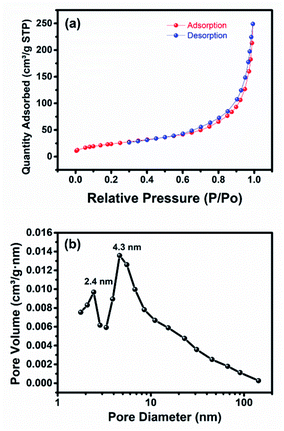 | ||
| Fig. 3 (a) N2 adsorption/desorption isotherm and (b) practical size distribution of the as-prepared Ti–Mo–Ni nanoparticles via breakdown anodization. | ||
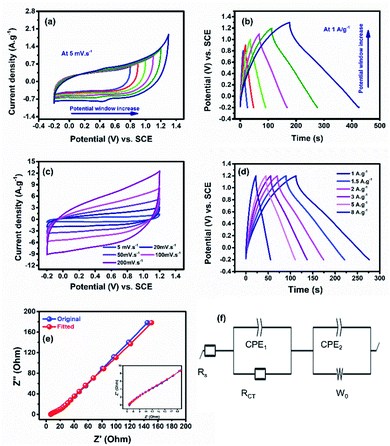
To investigate the electrochemical performance of the nanoparticles as a supercapacitor electrode in a three-electrode system, cyclic voltammetry (CV), galvanostatic charge/discharge (GCD), and electrochemical impedance spectroscopy (EIS) measurements were carried out in a 0.5 M K2SO4 electrolyte. Firstly, the electrode material was tested in different working potential regimes to optimize the potential window using CV and GCD techniques, see Fig. 4a and b. The CV curves at a low scan rate (5 mV s−1) demonstrate that the nanoparticles can work in a potential window starting from −0.2 to 0.8 up to 1.3 V vs. SCE. The peak that appeared in the potential window from −0.2 to 1.3 V vs. SCE can be ascribed to the faradaic reaction of the surface functional groups. Also, the GCDs at 2 A g−1 reveal that the safe potential window was −0.2 to 1.2 V with 100% coulombic efficiency compared to 96% in the potential window −0.2 to 1.3 V vs. SCE. Consequently, 1.2 V was chosen as the operating potential.
Note that the material exhibits pseudocapacitive charge storage nature in all tested operating potential windows (Fig. 4c), which is different from that of pure TiO2 that usually shows electric double layer behaviour.9,33 Therefore, the addition of Ni and Mo seems to strongly influence the performance of TiO2. The CVs show a deviation from EDL behaviour, proposing that the produced capacitance of the electrode is a contribution of EDL and pseudo-behaviours of Ti and Mo, respectively, with the redox of Ni as Ni2+/Ni3+. At a high scan rate, the CVs sustain the same behaviour.31,34 The calculated specific capacitance was found to be 255.4 F g−1, which is the highest among all titanium-based electrodes reported so far in the literature.9,25,33 Additionally, the galvanic charge/discharge (GCD) data plotted in Fig. 4d reveal a semi-triangular shape owing to the effect of Ni and Mo with a specific capacitance of 198.6 F g−1. Moreover, the electrode reveals rate capabilities of 37% and 44% as calculated from the GCD and CV scans, respectively, see Fig. S2.† The electrochemical impedance spectroscopy (EIS) analysis was conducted at an open-circuit voltage (OCV) in a wide frequency range (100 mHz to 100 kHz), see Fig. 3e. The Nyquist plot shows a small semicircle and a linear line at high and low frequency, respectively, ascribed to charge transfer/equivalent series resistances and diffusion resistance, respectively.35,36 Using Z-fit software, the equivalent circuit was obtained as shown in Fig. 4f. The equivalent circuit components are Rs, Rct, Wo, CPE1, and CPE2 assigned to the electrolyte/electrode, charge transfer resistance, Warburg diffusion resistance, and constant phase element, respectively. The fabricated electrode reveals a low charge transfer resistance of 4.8 Ω.
To investigate the charge storage mechanism in the fabricated material, the Randles–Sevcik plot was employed based on the relationship i = aνb,34 where i is the current response from the CV profiles and ν is the scan rate, see Fig. 5a. The b value is a key factor demonstrating the charge storage mechanism. A b value of 1 indicates a pure electric double layer mechanism, while a value of 0.5 indicates a faradaic intercalation mechanism. Note that the obtained b value is 0.66, revealing pseudocapacitive behavior. Moreover, the Trasatti method was employed to get a deeper understanding of the working charge storage mechanism.37 Based on this method, the electric double-layer capacitance (CEDL) and the pseudocapacitance (CP) contribution to the total electrode capacitance (Ctotal) can be estimated. The Ctotal and CEDL are assessed by plotting 1/C versus ν0.5 and C versus ν−0.5, respectively, as presented in Fig. 5(b and c) and the contribution of CP and CEDL to the Ctotal was found to be 89.1% and 10.9%, respectively.
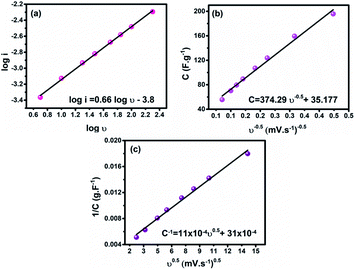 | ||
| Fig. 5 (a) Current–scan rate relationship, (b) dependence of C on ν−0.5, and (c) dependence of 1/C on ν0.5 for the as-prepared electrode. | ||
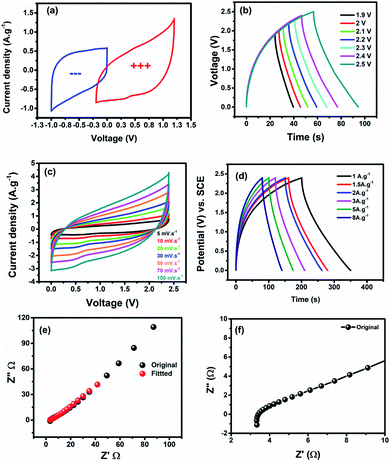
To evaluate the electrochemical performance and the real potential application of our electrode, an asymmetric supercapacitor device (ASC) was assembled and tested. The negative electrode of the cell was selected as a mesoporous doped-carbon electrode (MPDC).38 The MPDC electrode material has a high surface area of 1415 cm2 g−1 (Fig. S3†) and achieves over 200 F g−1 in a 0.5 M K2SO4 aqueous electrolyte as detailed in the ESI (Fig. S4).† The ASC cell was mass balanced using eqn (3). The loaded mass ratio between the negative and positive poles was 1.6![[thin space (1/6-em)]](https://www.rsc.org/images/entities/char_2009.gif) :
:![[thin space (1/6-em)]](https://www.rsc.org/images/entities/char_2009.gif) 1.0. Fig. 6a shows the CV profiles of the negative (MPDC) and positive (TMN NPs) electrodes. To adjust the operating voltage window, GCDs were recorded at 2 A g−1 at different voltages starting from 0–1.9 to 0–2.5 V. Consequently, 0–2.4 V was chosen as the cell voltage with high coulombic efficiency, see Fig. 6b. The CV profile of the assembled ASC cell reveals a mixed behavior of the two half cells (negative and positive electrodes), see Fig. 6c. Moreover, the CVs retained the same shape even at a high scan rate with a capacitance of 140 F g−1 at 5 mV s−1, which is moderately high compared to transition metal-based asymmetric supercapacitors.26,29 The charge/discharge analysis was performed at different current densities starting from 1 to 10 A g−1 at the same operating voltage, revealing a triangular shape as shown in Fig. 6d.
1.0. Fig. 6a shows the CV profiles of the negative (MPDC) and positive (TMN NPs) electrodes. To adjust the operating voltage window, GCDs were recorded at 2 A g−1 at different voltages starting from 0–1.9 to 0–2.5 V. Consequently, 0–2.4 V was chosen as the cell voltage with high coulombic efficiency, see Fig. 6b. The CV profile of the assembled ASC cell reveals a mixed behavior of the two half cells (negative and positive electrodes), see Fig. 6c. Moreover, the CVs retained the same shape even at a high scan rate with a capacitance of 140 F g−1 at 5 mV s−1, which is moderately high compared to transition metal-based asymmetric supercapacitors.26,29 The charge/discharge analysis was performed at different current densities starting from 1 to 10 A g−1 at the same operating voltage, revealing a triangular shape as shown in Fig. 6d.
Additionally, the cell has a moderate rate capability of 31.2% at 100 mV s−1 and 20.4% at 10 A g−1 from the CVs and GCDs, respectively, as shown in Fig. S5.† Furthermore, the equivalent series resistance (ESR, the internal resistance of the cell, and the electrolyte/electrode interface) and the charge transfer resistance (Rct) are estimated from the Nyquist plot shown in Fig. 6e. The Nyquist plot at high frequency displays a small semicircle corresponding to a Rct of ∼4.15 Ω, signifying a high specific power. Also, at low frequency, the Warburg line is related to the diffusion resistance.39 Fig. S6† depicts the equivalent circuit of the TMN NPs//MPDC device.
A long-term stability test was carried out at 10 A g−1 to investigate the durability of the assembled TMN NPs//MPDC device over 11![[thin space (1/6-em)]](https://www.rsc.org/images/entities/char_2009.gif) 000 charge/discharge cycles. Fig. 7a reveals an excellent capacitance retention of 96.8% at the end of the stability test with a 100% coulombic efficiency. To investigate the superior stability of our device, EIS was performed after the long-term stability test (Fig. 7c), revealing an increase in the charge transfer resistance by 0.65 Ω to reach 4.8 Ω, signifying good electronic conductivity, even after 11
000 charge/discharge cycles. Fig. 7a reveals an excellent capacitance retention of 96.8% at the end of the stability test with a 100% coulombic efficiency. To investigate the superior stability of our device, EIS was performed after the long-term stability test (Fig. 7c), revealing an increase in the charge transfer resistance by 0.65 Ω to reach 4.8 Ω, signifying good electronic conductivity, even after 11![[thin space (1/6-em)]](https://www.rsc.org/images/entities/char_2009.gif) 000 cycles. The near-vertical line in the low-frequency range implies low electrolyte diffusion impedance. The observed minimal slope difference from the vertical diffusion lines reveals the excellent capacitive performance of the TMN NPs//MPDC device before and after 11
000 cycles. The near-vertical line in the low-frequency range implies low electrolyte diffusion impedance. The observed minimal slope difference from the vertical diffusion lines reveals the excellent capacitive performance of the TMN NPs//MPDC device before and after 11![[thin space (1/6-em)]](https://www.rsc.org/images/entities/char_2009.gif) 000 charge/discharge cycles. Also, the GCD curves of the first and last cycles revealed a minimal decrease in capacitance with the same coulombic efficiency of 100%, see Fig. S6.†
000 charge/discharge cycles. Also, the GCD curves of the first and last cycles revealed a minimal decrease in capacitance with the same coulombic efficiency of 100%, see Fig. S6.†
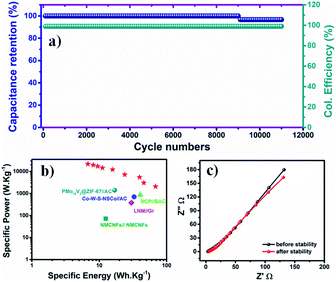 | ||
Fig. 7 (a) Capacitance retention and coulombic efficiency over 11![[thin space (1/6-em)]](https://www.rsc.org/images/entities/char_2009.gif) 000 cycles, (b) the corresponding Ragone plot, and (c) PEIS before and after the long-term stability test. 000 cycles, (b) the corresponding Ragone plot, and (c) PEIS before and after the long-term stability test. | ||
To estimate the supercapacitive performance abilities of the TMN NPs//MPDC device, the specific power (Psp) and specific energy (Esp) were calculated according to eqn (5) and (6) as illustrated in Fig. 7b in the Ragone plot.
 | (5) |
 | (6) |
The TMN NPs//MPDC cell delivered a high specific energy of 68.47 W h kg−1 at a current density of 1 A g−1 with a corresponding specific power of 2058 W kg−1, which is higher than those reported in the literature.29,31,39–41Table 1 compares the performance of transition metal-based supercapacitors to that of our fabricated supercapacitors.
| Material | Fabrication method | C sp | Negative electrode | E sp W h kg−1 | P sp W kg−1 | Stability (Csp retention)/no. of cycles | Ref. |
|---|---|---|---|---|---|---|---|
| a Three-electrode measurements only. | |||||||
| Ti–Al–B | Anodization | 110 F cm−2 at 0.1 mA cm−2 | — | — | — | — | 33 |
| rGO–TiO2 | Hydrothermal | 225 F g−1 at 0.125 A g−1 | rGO–TiO2 | 20 | 170 | 86.5% after 2000 cycles | 42 |
| TiO2 NP | Purchased | 101 F g−1 at 5 mV s−1 | — | 5.1 | 500 | — | 43 |
| TiO2/MnO2 | Mixing | 289 F g−1 at 5 mV s−1 | — | 25.3 | 1000 | 73.4% after 5000 cycles | 43 |
| PA/TiO2/GN | Multi-step | 280 F g−1 | — | — | — | — | 44 |
| Ni–TiO2 NT | Anodization | 2.5 mF cm−2 at 0.4 mA cm−2 | — | — | — | 120% after 500 cyclesa | 15 |
| Ni doped TiO2 nanowires | Multi-step | 200 F g−1 at 2 mV s−1 | — | — | — | 100% after 5000 cyclesa | 45 |
| H-TiO2 NT | Multi-step | 3.24 mF cm−2 at 100 mV s−1 | — | — | — | 96.5% after 10![[thin space (1/6-em)]](https://www.rsc.org/images/entities/char_2009.gif) 000 cyclesa 000 cyclesa |
46 |
| Ti–Mo–Ni | Breakdown anodization | 241 F g −1 at 5 mV s −1 | MPDC | 39.92 | 1200 |
100% after 11![[thin space (1/6-em)]](https://www.rsc.org/images/entities/b_char_2009.gif) 000 cycles 000 cycles
|
This work |
Conclusions
Ti–Mo–Ni ternary metal oxide nanoparticles were successfully fabricated via breakdown anodization of a Ti–Mo–Ni alloy as confirmed via FESEM, BET, Raman, and XPS analyses. A three-electrode test of the nanoparticles revealed a high specific capacitance (Csp) of 255 F g−1 at 5 mV s−1, which is the highest among all titanium-based electrodes reported so far. The material showed pseudocapacitive behavior, which was ascribed to the contribution of Ni and Mo with Ti. Charge storage mechanistic analysis showed a 10.9% electric double layer capacitance (CEDL) contribution and 89.1% pseudocapacitance (CP) contribution to the total electrode capacitance (Ctotal). An asymmetric device was assembled and tested in a K2SO4 electrolyte. The TMN NPs//MPDC device delivered ∼139 F g−1 at 5 mV s−1, a specific energy of 68.47 W h kg−1, and a specific power of 2058 W kg−1 with 96.8% capacitance retention and 100% coulombic efficiency after 11![[thin space (1/6-em)]](https://www.rsc.org/images/entities/char_2009.gif) 000 cycles.
000 cycles.
Author contributions
Nourhan M. Deyab: methodology, formal analysis, investigation, and writing – original draft. Manar M. Taha: methodology, formal analysis, investigation, and writing – original draft. Nageh K. Allam: conceptualization, formal analysis, writing – review & editing, project administration, funding acquisition, and supervision.Conflicts of interest
There are no conflicts to declare.Acknowledgements
We acknowledge the financial support from the American University in Cairo. NMD acknowleges the financial support from the National Research Centre.Notes and references
- C. An, Y. Zhang, H. Guo and Y. Wang, Nanoscale Adv., 2019, 1, 4644–4658 RSC.
- P. K. Panda, A. Grigoriev, Y. K. Mishra and R. Ahuja, Nanoscale Adv., 2020, 2, 70–108 RSC.
- A. M. Mohamed and N. K. Allam, J. Energy Storage, 2021, 103565 CrossRef.
- Y. Yan, T. Wang, X. Li, H. Pang and H. Xue, Inorg. Chem. Front., 2017, 4, 33–51 RSC.
- A. M. Mohamed, M. Ramadan and N. K. Allam, J. Energy Storage, 2021, 34, 102195 CrossRef.
- E. Lei, W. Gan, J. Sun, Z. Wu, C. Ma, W. Li and S. Liu, Energy Fuels, 2021, 35, 8295–8302 CrossRef CAS.
- V. Augustyn, P. Simon and B. Dunn, Energy Environ. Sci., 2014, 7, 1597–1614 RSC.
- I. M. Badawy, A. M. Elbanna, M. Ramadan and N. K. Allam, Electrochim. Acta, 2022, 408, 139932 CrossRef CAS.
- F. Ahmed, S. A. Pervez, A. Aljaafari, A. Alshoaibi, H. Abuhimd, J. H. Oh and B. H. Koo, Micromachines, 2019, 10, 6–13 CrossRef PubMed.
- A. Rose, K. Guru Prasad, T. Sakthivel, V. Gunasekaran, T. Maiyalagan and T. Vijayakumar, Appl. Surf. Sci., 2018, 449, 551–557 CrossRef CAS.
- H. A. Ghaly, A. G. El-Deen, E. R. Souaya and N. K. Allam, Electrochim. Acta, 2019, 310, 58–69 CrossRef CAS.
- M. Salari, S. H. Aboutalebi, K. Konstantinov and H. K. Liu, Phys. Chem. Chem. Phys., 2011, 13, 5038–5041 RSC.
- M. Madian, Z. Wang, I. Gonzalez-Martinez, S. Oswald, L. Giebeler and D. Mikhailova, Appl. Mater. Today, 2020, 20, 100676 CrossRef.
- W. A. Abbas, I. H. Abdullah, B. A. Ali, N. Ahmed, A. M. Mohamed, M. Y. Rezk, N. Ismail, M. A. Mohamed and N. K. Allam, Nanoscale Adv., 2019, 1, 2801–2816 RSC.
- J. H. Kim, K. Zhu, Y. Yan, C. L. Perkins and A. J. Frank, Nano Lett., 2010, 10, 4099–4104 CrossRef CAS PubMed.
- T.-J. Cai, Y.-H. Lo and J.-J. Wu, Mater. Today Energy, 2019, 13, 119–124 CrossRef.
- A. D. Handoko, H. Chen, Y. Lum, Q. Zhang, B. Anasori and Z. W. Seh, iScience, 2020, 23, 101181 CrossRef CAS PubMed.
- M. Samir, M. Salama and N. K. Allam, J. Mater. Chem. A, 2016, 4, 9375–9380 RSC.
- F. D. Hardcastle, H. Ishihara, R. Sharma and A. S. Biris, J. Mater. Chem., 2011, 21, 6337–6345 RSC.
- R. Kumar, R. Kumar, B. K. Singh, A. Soam, S. Parida, V. Sahajwalla and P. Bhargava, Nanoscale Adv., 2020, 2, 2376–2386 RSC.
- M. Dieterle and G. Mestl, Phys. Chem. Chem. Phys., 2002, 4, 822–826 RSC.
- I. E. Wachs and C. A. Roberts, Chem. Soc. Rev., 2010, 39, 5002–5017 RSC.
- S. Vivek, P. Arunkumar and K. S. Babu, RSC Adv., 2016, 6, 45947–45956 RSC.
- Y. Cao, P. Zhou, Y. Tu, Z. Liu, B. W. Dong, A. Azad, D. Ma, D. Wang, X. Zhang, Y. Yang, S. Da Jiang, R. Zhu, S. Guo, F. Mo and W. Ma, iScience, 2019, 20, 195–204 CrossRef CAS PubMed.
- N. M. Deyab, K. E. Salem, A. M. Mokhtar, M. Ramadan, P. Steegstra, A. Hubin, M. P. Delplancke, H. Rahier and N. K. Allam, ChemistrySelect, 2020, 5, 12151–12158 CrossRef CAS.
- N. M. Deyab, N. Ahmed and N. K. Allam, ChemNanoMat, 2020, 6, 1513–1518 CrossRef CAS.
- A. Achour, R. Lucio-Porto, M. Chaker, A. Arman, A. Ahmadpourian, M. A. Soussou, M. Boujtita, L. Le Brizoual, M. A. Djouadi and T. Brousse, Electrochem. Commun., 2017, 77, 40–43 CrossRef CAS.
- N. Joseph, P. M. Shafi and A. C. Bose, Energy Fuels, 2020, 34, 6558–6597 CrossRef CAS.
- A. M. Mohamed, M. Ramadan, N. Ahmed, A. O. Abo ElNaga, H. H. Alalawy, T. Zaki, S. A. Shaban, H. B. Hassan and N. K. Allam, J. Energy Storage, 2020, 28, 101292 CrossRef.
- H. Tian, K. Zhu, Y. Jiang, L. Wang, W. Li, Z. Yu and C. Wu, Nanoscale Adv., 2021, 3, 2924–2933 RSC.
- H. M. El Sharkawy, D. M. Sayed, A. S. Dhmees, R. M. Aboushahba and N. K. Allam, ACS Appl. Energy Mater., 2020, 3, 9305–9314 CrossRef CAS.
- M. Thommes, K. Kaneko, A. V. Neimark, J. P. Olivier, F. Rodriguez-Reinoso, J. Rouquerol and K. S. W. Sing, Pure Appl. Chem., 2015, 87, 1051–1069 CAS.
- H. Cui, W. Huang, L. Wu, S. Cao and Y. Song, J. Alloys Compd., 2019, 785, 19–24 CrossRef CAS.
- B. A. Ali, A. M. A. Omar, A. S. G. Khalil and N. K. Allam, ACS Appl. Mater. Interfaces, 2019, 11, 33955–33965 CrossRef CAS PubMed.
- H. M. El Sharkawy, A. S. Dhmees, A. R. Tamman, S. M. El Sabagh, R. M. Aboushahba and N. K. Allam, J. Energy Storage, 2020, 27, 101078 CrossRef.
- D. M. El-Gendy, I. M. Afifi and N. K. Allam, J. Energy Storage, 2019, 24, 100760 CrossRef.
- S. Ardizzone, G. Fregonara and S. Trasatti, Electrochim. Acta, 1990, 35, 263–267 CrossRef CAS.
- M. M. Taha, S. E. Anwar, M. Ramadan, H. M. Al-Bulqini, M. S. Abdallah and N. K. Allam, Desalination, 2021, 511, 115099 CrossRef CAS.
- A. M. Mohamed, A. O. Abo El Naga, T. Zaki, H. B. Hassan and N. K. Allam, ACS Appl. Energy Mater., 2020, 3, 8064–8074 CrossRef CAS.
- Y. I. Mesbah, N. Ahmed, B. A. Ali and N. K. Allam, ChemElectroChem, 2020, 7, 975–982 CrossRef CAS.
- M. Ghaemmaghami and R. Mohammadi, Sustainable Energy Fuels, 2019, 3, 2176–2204 RSC.
- C. Xiang, M. Li, M. Zhi, A. Manivannan and N. Wu, J. Mater. Chem., 2012, 22, 19161–19167 RSC.
- H. Lee, S. Jin and S. Yim, J. Phys. Chem. Solids, 2020, 138, 109264 CrossRef CAS.
- N. Parveen, M. O. Ansari, T. H. Han and M. H. Cho, J. Solid State Electrochem., 2017, 21, 57–68 CrossRef CAS.
- S. G. Krishnan, P. S. Archana, B. Vidyadharan, I. I. Misnon, B. L. Vijayan, V. M. Nair, A. Gupta and R. Jose, J. Alloys Compd., 2016, 684, 328–334 CrossRef CAS.
- X. Lu, G. Wang, T. Zhai, M. Yu, J. Gan, Y. Tong and Y. Li, Nano Lett., 2012, 12, 1690–1696 CrossRef CAS PubMed.
Footnotes |
| † Electronic supplementary information (ESI) available. See DOI: 10.1039/d1na00694k |
| ‡ These authors contributed equally. |
| This journal is © The Royal Society of Chemistry 2022 |

