 Open Access Article
Effect of manganese substitution of ferrite nanoparticles on particle grain structure†
Zichun
Yan
 a,
Anish
Chaluvadi
 ab,
Sara
FitzGerald
 c,
Sarah
Spence
 a,
Christopher
Bleyer
a,
Jiazhou
Zhu‡
b,
Thomas M.
Crawford
c,
Rachel B.
Getman
a,
Christopher
Bleyer
a,
Jiazhou
Zhu‡
b,
Thomas M.
Crawford
c,
Rachel B.
Getman
 b,
John
Watt
 d,
Dale L.
Huber
 e and
O. Thompson
Mefford
 *a
*a
aDepartment of Materials Science & Engineering, Clemson University, Clemson, SC 29634, USA. E-mail: mefford@clemson.edu
bDepartment of Chemical & Biomolecular Engineering, Clemson University, Clemson, SC 29634, USA
cDepartment of Physics and Astronomy, SmartState Center for Experimental Nanoscale Physics, University of South Carolina, Columbia, South Carolina 29208, USA
dCenter for Integrated Nanotechnologies, Los Alamos National Laboratory, Los Alamos, New Mexico 87545, USA
eCenter for Integrated Nanotechnologies, Sandia National Laboratories, Albuquerque, New Mexico 87185, USA
First published on 25th August 2022
Abstract
To investigate the influence of manganese substitution on the saturation magnetization of manganese ferrite nanoparticles, samples with various compositions (MnxFe3−xO4, x = 0, 0.25, 0.5, 0.75, and 1) were synthesized and characterized. The saturation magnetization of such materials was both calculated using density functional theory and measured via vibrating sample magnetometry. A discrepancy was found; the computational data demonstrated a positive correlation between manganese content and saturation magnetization, while the experimental data exhibited an inverse correlation. X-ray diffraction (XRD) and magnetometry results indicated that the crystallite diameter and the magnetic diameter decrease when adding more manganese, which could explain the loss of magnetization of the particles. For 20 nm nanoparticles, with increasing manganese substitution level, the crystallite size decreases from 10.9 nm to 6.3 nm and the magnetic diameter decreases from 15.1 nm to 3.5 nm. Further high resolution transmission electron microscopy (HRTEM) analysis confirmed the manganese substitution induced defects in the crystal lattice, which encourages us to find ways of eliminating crystalline defects to make more reliable ferrite nanoparticles.
Introduction
Metal substituted ferrite nanoparticles (MexFe3−xO4, Me = Mn, Co, Ni, and Zn, etc.) have been utilized in a variety of biomedical applications, including magnetic hyperthermia,1,2 drug delivery,3–6 and magnetic resonance imaging (MRI) contrast agents.7–10 MexFe3−xO4 ferrite has a spinel structure (AB2O4) that can be described as a face-centered cubic arrangement of oxygen atoms where substitute metals and iron locate in the tetrahedral (A site) and octahedral (B site) sites. Saturation magnetization is one of the most important characteristic properties of magnetic materials. It represents “how magnetic” the material can be magnetized to become and is directly proportional to the sum of the magnetic moments of the metal cations.11 As the magnetic moments in A sites and B sites are antiparallel, the total magnetic moment of the ferrite is dependent on the choice of the metal cations and the distribution of cations between A and B sites.12 Therefore, such a structure offers a great opportunity to tune the saturation magnetization of metal substituted ferrites by changing the composition via chemical manipulations.Among different transition metal ferrites, manganese substituted ferrite nanoparticles have been used for magnetic heating13–16 and extensively studied as candidates for T2 MRI contrast agents due to their high saturation magnetizations.17–23 To investigate the influence of the composition on the properties of manganese substituted ferrite nanoparticles, several variations of the structures have been synthesized and characterized.24–29 For example, Yang et al. reported that the composition of Mn0.43Fe2.57O4 offers the highest saturation magnetization (Ms = 89.5 emu g−1) and optimal T2 contrast ability of nonstoichiometric manganese ferrite nanoparticles by testing compositions from Mn0 to Mn1.06.24 Instead of having a maximum saturation magnetization, the study from Li et al. showed that for MnxFe3−xO4 (x = 0.11, 0.18, 0.29, 0.44, and 0.49), the saturation magnetization minimizes at the composition of x = 0.29 (Ms = 59.3 emu g−1).29 Another work showed that when increase the manganese content from x = 0.13 to x = 0.36 the saturation magnetization decreased from 81 to 72 emu g−1.27 Although the manganese ferrite nanoparticles in the three examples mentioned above were synthesized by similar thermal decomposition methods, there is no consistent relationship between the composition and the saturation magnetization of the manganese ferrite nanoparticles. Therefore, in this study, we wish to better understand how the composition of manganese ferrite influences its saturation magnetization and attempt to explain the discordance with analysis of the nanostructures in the nanoparticles.
Herein, manganese ferrite nanoparticles with precisely controlled size and composition were synthesized via thermal decomposition method and magnetic properties were measured afterwards. Density functional theory (DFT) was used to calculate the saturation magnetizations of manganese ferrites with the Mn cations arranged in different interstitial sites within the bulk crystal structure and the results were compared with the experimental results.
Experimental
Materials for particle synthesis
Iron(III) acetylacetonate, manganese(II) acetylacetonate, styrene (≥99%), and divinylbenzene (tech. 80%) were purchased from Sigma Aldrich; oleic acid (90%) was purchased from Fisher Scientific; 1-octadecene (90%), docosane (90%) were purchased from Acros Organics. Ethanol, hexane, acetone, and nitric acid were purchased from BDH. All reagents were used without any further purification.Synthesis of manganese ferrite nanoparticles using acetylacetonates
The synthetic procedure was adopted from a reported method with adjustment.30 Briefly, to synthesize manganese ferrite nanoparticles (Acac sample, targeted 10 nm), iron acetylacetonate and manganese acetylacetonate (3 mmol in total) were mixed in 3 mL oleic acid and 5 mL 1-octadecene. The mixture was mechanically stirred and refluxed at 325 °C under constant flow (0.2 L m−1) of nitrogen for 2 hours before cooling down to room temperature. The composition of the nanoparticles was changed by changing the ratio between iron and manganese precursors while keeping the total molarity constant to ensure similar final sizes. The compositions for each batch were aimed at MnxFe3−xO4 (x = 0, 0.25, 0.5, 0.75, and 1) and were thus named Mnx–Acac (x = 0, 0.25, 0.5, 0.75, and 1).Synthesis of manganese ferrite nanoparticles using oleates
The synthetic method of choice may significantly change the property of the material. It was shown iron oxide nanoparticles can be synthesized with different precursors and the properties of the resulting products can be significantly different.31 Therefore, in this study, we chose oleate precursors to synthesize 10 nm manganese ferrite nanoparticles besides using acetylacetonate precursors.The synthetic procedure was adopted from a previous study with changes.24,32 Briefly, iron(III) oleate (or manganese(II) oleate) were made by reacting 40 mmol ferric chloride (or manganese(II) chloride) salts with 120 mmol sodium oleate (80 mmol for manganese oleate) in a refluxing solvent mixture of hexane (140 mL), ethanol (80 mL), and water (60 mL) for 4 hours. The metal oleates were obtained by evaporating hexane from the upper layer and precipitated by washing with acetone. The final waxy solid was dried in a vacuum oven overnight at room temperature before use. To synthesize 10 nm manganese ferrite nanoparticles, iron(III) oleate and manganese(II) oleate (3 mmol in total) were mixed in 3 mL oleic acid and 15 mL 1-octadecene. The mixture was refluxed and mechanically stirred under nitrogen at 365 °C for 1.5 hours. This series is named Mnx–oleate-1 (x = 0, 0.25, 0.5, 0.75, and 1).
The size of nanoparticles plays a critical role in affecting the magnetic properties of the ferrite nanoparticles.33,34 Therefore, larger particles were synthesized with the same oleate precursors. To synthesize 20 nm manganese ferrite particles, 9 mmol metal oleates, 9 mL oleic acid, and 9 mL 1-octadecene were used, and this series is named Mnx–oleate-2 (x = 0, 0.25, 0.5, 0.75, and 1). After the reaction, the product was washed by mixing the product with 60 mL ethanol and centrifuged at 10![[thin space (1/6-em)]](https://www.rsc.org/images/entities/char_2009.gif) 000 rpm for 3 min to precipitate the particles. The washing process was repeated until the supernatant became clear.
000 rpm for 3 min to precipitate the particles. The washing process was repeated until the supernatant became clear.
Transmission electron microscopy (TEM) analysis
Electron microscopy was conducted at the AMRL EM facility, Clemson University, and the Center for Integrated Nanotechnologies, Sandia National Laboratories. TEM images for size analysis were taken using Hitachi H7830 at 120 kV with 200 mesh carbon-coated copper grids. High-resolution transmission electron microscopy (HRTEM) images were taken on an FEI Titan ETEM 80-300 (FEI, Hillsboro, Oregon) with Image Cs corrector, operating at 300 kV. Energy dispersive X-ray spectroscopy (EDS) mapping was done using Hitachi SU9000 under 60 kV. The images were further analyzed through Image J (NIH, open source). Size distribution was obtained by randomly selecting more than 300 distinct particles from images with a magnification of ×100k.Vibrating sample magnetometry (VSM)
VSM was done using a physical property measurement system (PPMS, Quantum Design, Inc.) The samples were prepared by fixing the particles in the matrix of poly styrene-divinylbenzene.35,36 The monomer mixture was cured at 90 °C with azobisisobutyronitrile (AIBN) as initiator and the high temperature and convection will keep the particles evenly distributed. Magnetization curve was measured with a maximum field of 20![[thin space (1/6-em)]](https://www.rsc.org/images/entities/char_2009.gif) 000 Oe (1595.4 kA m−1) at 5 K and 300 K, respectively. Inductively coupled plasma optic emission spectroscopy (ICP-OES) was used to determine the mass of metal elements in each sample with sample digestion. The mass of particles was then calculated by assuming the particles have a MnxFe3−xO4 structure. The mass of particles was further used for converting measured magnetic moment (emu) to magnetization (emu g−1, A m2 kg−1). The measured magnetization versus field curves were fitted to the Langevin function weighted using a log-normal size suggested by Chantrell et al.37 This method is also described in previous studies.38–40 In this study, the fitting was done using SPfit, a MATLAB based program that was developed by GM Saladino.41,42 The temperature was set to 300 K and the bulk saturation magnetization was set to 446 kA m−1.43 It should be noted that this model assumes non-interacting particles.
000 Oe (1595.4 kA m−1) at 5 K and 300 K, respectively. Inductively coupled plasma optic emission spectroscopy (ICP-OES) was used to determine the mass of metal elements in each sample with sample digestion. The mass of particles was then calculated by assuming the particles have a MnxFe3−xO4 structure. The mass of particles was further used for converting measured magnetic moment (emu) to magnetization (emu g−1, A m2 kg−1). The measured magnetization versus field curves were fitted to the Langevin function weighted using a log-normal size suggested by Chantrell et al.37 This method is also described in previous studies.38–40 In this study, the fitting was done using SPfit, a MATLAB based program that was developed by GM Saladino.41,42 The temperature was set to 300 K and the bulk saturation magnetization was set to 446 kA m−1.43 It should be noted that this model assumes non-interacting particles.
Inductively coupled plasma optic emission spectroscopy (ICP-OES)
Samples were placed into 20 mL scintillation vials and incubated at 500 °C overnight under ambient air. The resulting solids were then dissolved with 70% nitric acid (1 mL) at 100 °C and kept heating until completely dry. Then 10 mL 2% nitric acid was added into each vial and vortexed for 3 min to ensure solvation. The sample solutions were filtered through 0.2 μm syringe filters before measurement. Standard solutions (100 ppm, 50 ppm, 10 ppm, 5 ppm, 1 ppm, and 0.5 ppm) containing iron and manganese were prepared by diluting a standard purchased from VWR. The measurement was conducted with a Thermo Scientific iCAP 7200 ICP-OES in radial mode using the standard instrument operating conditions. Optical emission was monitored at the wavelengths of 259.940 nm (Fe) and 257.610 nm (Mn).X-ray diffraction (XRD)
Powder X-ray diffraction was performed with a Rigaku Ultima diffractometer. The particles were dispersed in n-hexane (approximately 50 mg mL−1) and then dropped on a glass substrate. The particles were then deposited by the evaporation of the solvent. All samples were scanned with 0.5° min−1 from 25° to 65° with a copper Kα X-ray (λ = 1.54 Å). The results were analyzed using PANalytical X'Pert HighScore Plus. The peak broadening caused by the size effect were roughly estimated using Scherrer's equation. More explanation will be found in the results and discussion section.DFT calculations
Simulated structures were based on the bulk structure of Fe3O4 (magnetite). We specifically employed a supercell with an initial stoichiometry of Fe24O32. A total of up to eight Mn ions were substituted for Fe in the Fe24O32 structure to obtain compositions of Mn2Fe22O32, Mn4Fe20O32, Mn6Fe18O32, Mn8Fe16O32 for both inverse and normal spinel structures (see Fig. S3†). Magnetic moments were calculated with the VASP (Vienna Ab initio Simulation Package) software.44–47 Electron exchange and correlation were treated using the Perdew–Burke–Ernzerhof (PBE)48 functional with the energies of core electrons being simulated using the projector augmented wave (PAW) pseudopotentials49,50 to a cut-off energy of 520 eV. All calculations included spin-polarization. The DFT + U formalism51–54 was utilized to capture the strong coulombic repulsion for 3d electrons on the Mn and Fe atoms and to further prevent the delocalization of electrons in these semiconducting materials. Electronic structures were converged self-consistently until the difference in electronic energies between subsequent steps fell below 10−5 eV. Unit cell geometries were converged iteratively until the difference in energy between subsequent steps fell below 10−4 eV. Full details about model development, DFT calculations, and conversion of the calculated magnetic moment to saturation magnetization are provided in the ESI.†Results and discussion
Experimental particle size and composition analysis
To study the influence of manganese content on the magnetic properties of manganese substituted ferrite nanoparticles, we need to have good control of particle size and morphology since these factors also influence the magnetic properties of ferrite nanoparticles. The sizes of the particles were determined by TEM. The results are shown in Table 3 and plotted in Fig. 1 (right). Although the composition of each batch varied, for each series of samples, the particle diameters stayed relatively close to the target. It seems that changing the ratio between the iron precursor and manganese precursor did not play a significant role in changing the overall particle sizes. It is important to exclude the size effect on the magnetic properties to find the relationship between the magnetic properties and the compositions of the particles, thus, the synthetic methods provided good materials for further measurements.| Mn0 | Mn0.25 | Mn0.5 | Mn0.75 | Mn1 | |
|---|---|---|---|---|---|
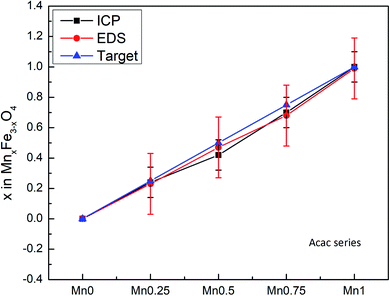
| Acac | 0.00 (0.00) | 0.24 (0.23) | 0.42 (0.47) | 0.70 (0.68) | 1.00 (0.99) |
| Oleate-1 | 0.07 | 0.18 | 0.32 | 0.47 | 0.64 |
| Oleate-2 | 0.01 | 0.20 | 0.35 | 0.69 | 0.78 |
| Mn0 | Mn0.25 | Mn0.5 | Mn0.75 | Mn1 | |
|---|---|---|---|---|---|
| Acac | 45.59 | 42.61 | 22.67 | 19.87 | 12.45 |
| Oleate-1 | 56.69 | 56.40 | 43.34 | 32.40 | 23.45 |
| Oleate-2 | 72.89 | 62.84 | 44.99 | 27.37 | 25.42 |
| TEM mean diameter (nm) | XRD crystallite diameter (nm) (311) | Magnetic diameter (nm) | Lattice parameter (Å) (3 1 1) | ||
|---|---|---|---|---|---|
| Acac | Mn0 | 11.0 ± 3.1 | 3.5 | 7.3 ± 0.3 | 8.3 |
| Mn0.25 | 7.7 ± 2.1 | 3.9 | 5.8 ± 0.1 | 8.4 | |
| Mn0.5 | 7.4 ± 1.5 | 3.1 | 4.6 ± 0.2 | 8.5 | |
| Mn0.75 | 8.3 ± 2.5 | 3.5 | 4.2 ± 0.8 | 8.4 | |
| Mn1 | 7.6 ± 2.1 | 2.7 | N/A | 8.6 | |
| Oleate-1 | Mn0 | 9.5 ± 0.7 | 4.9 | 8.1 ± 0.2 | 8.3 |
| Mn0.25 | 10.1 ± 0.7 | 4.6 | 7.8 ± 0.3 | 8.4 | |
| Mn0.5 | 9.4 ± 0.8 | 3.9 | 6.4 ± 0.5 | 8.4 | |
| Mn0.75 | 9.9 ± 0.7 | 3.7 | 4.7 ± 0.9 | 8.5 | |
| Mn1 | 9.8 ± 0.8 | 4.1 | N/A | 8.4 | |
| Oleate-2 | Mn0 | 20.5 ± 1.3 | 10.9 | 15.1 ± 0.6 | 8.3 |
| Mn0.25 | 21.0 ± 1.4 | 9.4 | 11.0 ± 1.3 | 8.4 | |
| Mn0.5 | 17.8 ± 1.1 | 7.6 | 3.5 ± 0.2 | 8.4 | |
| Mn0.75 | 23.8 ± 2.8 | 6.8 | N/A | 8.5 | |
| Mn1 | 20.3 ± 1.6 | 6.3 | N/A | 8.5 |
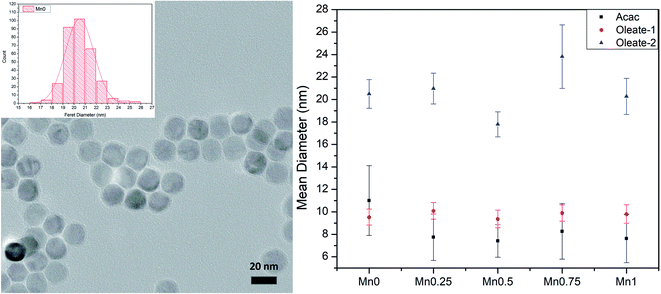 | ||
| Fig. 1 TEM image and size distribution histogram of Mn0–oleate-2 (left); the size summary of three series (right). Error bars represent 1 standard deviation from the mean. | ||
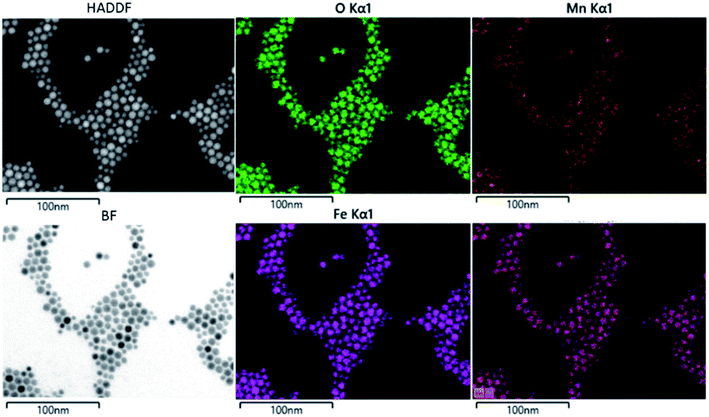
The composition of the nanoparticle samples was measured with EDS and ICP-OES. The two measurements have their own merits. We used EDS mapping to analyze the elemental distribution in the particles, as shown in Fig. 2. Based on the mapping, it appears that both iron and manganese are evenly distributed in all the particles of Mn0.75–Acac. ICP-OES measures the overall mass of metal elements in the digested sample, while EDS gives the relative amount of each element at a microscopic level. This means that both ICP-OES and EDS can be used for calculating the composition of the particle samples if we assume a MnxFe3−xO4 formula. Taking the Acac series as an example, as shown in Table 1 and Fig. 3, both ICP-OES and EDS data are close to the targeted composition with differences within acceptable error. Therefore, later on, for the two oleate series, we used ICP-OES as a standard method to analyze the composition of each sample, and the results are shown in Table 1. The manganese content in the oleate-1 and oleate-2 series was lower than the targeted level, which was also observed previously by other authors.27–29 García-Soriano et al. provided a nice comparison to other authors demonstrating this phenomena28 as well as Lasheras et al. using X-ray absorption near edge structure (XANES) to determine the oxidative state of the Mn and Fe ions.27 The measurement of ICP-OES on the VSM sample is critical to the analysis of the VSM data because the measured magnetic moment is proportional to the total quantity of the magnetic particles in each measured sample. With ICP-OES, the total mass of iron, manganese, and ferrite particles, can be calculated, and the mass of particles was then used to normalize the magnetic moment.
Magnetic measurement
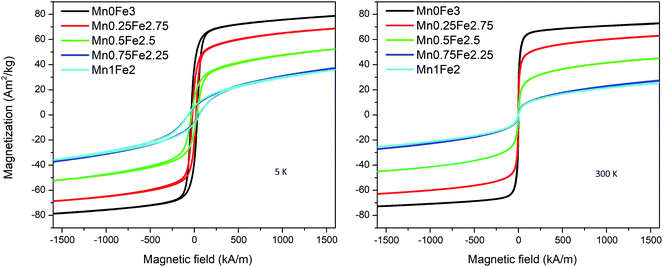
The magnetic moment value measured by VSM is proportional to the total mass of magnetic particles. To know the accurate mass of particles in each sample, the VSM samples are digested and measured by ICP-OES. The magnetization curves are measured with a maximum field of around 1600 kA m−1. An example of the magnetization curves of the 20 nm oleate-2 series is shown in Fig. 4. The magnetization at 5 K is slightly larger than the magnetization at 300 K for each sample. At 300 K, there is no obvious coercivity for the samples measured at 300 K showing a typical superparamagnetic behaviour. As seen in Fig. 4, the saturation magnetization of each sample differed significantly, and the saturation magnetization values at 300 K for all samples are presented in Table 2. To better draw a saturation magnetization–composition relationship, the data are plotted in Fig. 5, along with saturation magnetization values from the DFT calculations (lowest energy structures). It should be noted that the DFT calculations indicate normal spinel structures are lower in energy than inverse spinel at all compositions (see section S4 of the ESI†). In addition, calculations were only made for the extreme cases of purely normal and inverse structures, whereas it is known that Mn substitutions typically occur 80% in the A site and 20% in the B site leading to a mix spinel structure.11 The experimental data showed that for each composition, particles with larger sizes generally had higher saturation magnetizations and for the same size particles the saturation magnetization had a downward trend with the increase of manganese content. The fitted lines are used to show the general trend of the saturation magnetization–composition relationship (does not necessarily mean a linear relationship) for each series of particle samples. In theory, because Mn2+ gives the highest magnetic moment among the 3d metals, the incorporation of manganese into the ferrite structure should provide a higher saturation magnetization. However, the experiment produced values were not agreement with the DFT calculations. This finding motivated us to further investigate the influence of composition on saturation magnetization in comparison with the experimental results.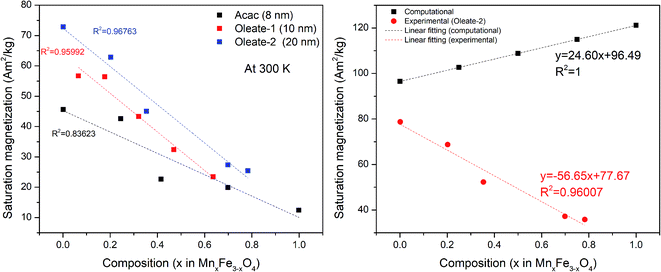 | ||
| Fig. 5 Saturation magnetization at 300 K of different samples (left). Comparison between computational and experimental (oleate-2, 20 nm) data of different levels of Mn substitution (right). | ||
A comparison between computational and experimental (20 nm oleate-2) results is shown in Fig. 5 (right). While the calculated results indicate that the saturation magnetization increases with increasing manganese substitution, consistent with theoretical bulk literature values11 for manganese ferrites, the opposite relationship is shown for experimental results. As the computational results are based on pristine bulk structures, this led us to investigate the microstructures of the nanoparticles to seek possible explanations for the discrepancy between the computational results and experimental results.
Crystallographic analysis
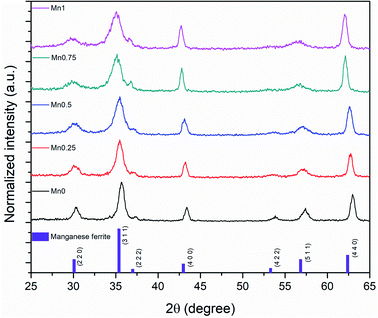
The origin of the reduction of magnetization of iron oxide was analyzed and reported previously.31 It seems that the reduction of magnetization is due to the impurities in the crystalline structures of the nanoparticles. To further study the crystal structure of the nanoparticles and explain the discrepancy between the computational and experimental results, the particles were measured by XRD and HRTEM.The XRD showed that all the samples with different Mn content have a spinel structure (manganese ferrite or magnetite) as shown in Fig. 6. The nano-size of the particles contributes to the peak broadening in the diffractogram significantly, and the crystallite size can be estimated by applying Scherrer's equation: crystallite size = Kλ/(FWHM × cos(θ)), where K is the shape factor and K = 0.94 for this case. FWHM is the full width at the half maximum of the selected peak. λ is the wavelength of the X-ray (Cu Kα, 1.54 Å), and θ is the diffraction angle. The lattice parameters can be calculated using Bragg's equation: d = nλ/(2![[thin space (1/6-em)]](https://www.rsc.org/images/entities/char_2009.gif) sin(θ)), where d is the interplanar distance and n is the diffraction order. For a face-centered cubic structure, the lattice parameter:
sin(θ)), where d is the interplanar distance and n is the diffraction order. For a face-centered cubic structure, the lattice parameter:  , where (h k l) is the corresponding Miller index of the diffraction plane. The most intense peak at the (311) plane was selected to estimate the crystallite size and lattice parameter, and the results are listed in Table 3. The TEM measured particle sizes, and the fitted magnetic diameters are also shown in Table 3. In general, for each series (Acac, oleate-1, and oleate-2), the crystallite size and the magnetic diameter decrease when the manganese content increases. Some of the samples with high manganese content were unable to properly fit with the program, which is probably due to the extremely small crystallite size and the magnetization curves are too paramagnetic for the program to fit (see ESI† for more information).
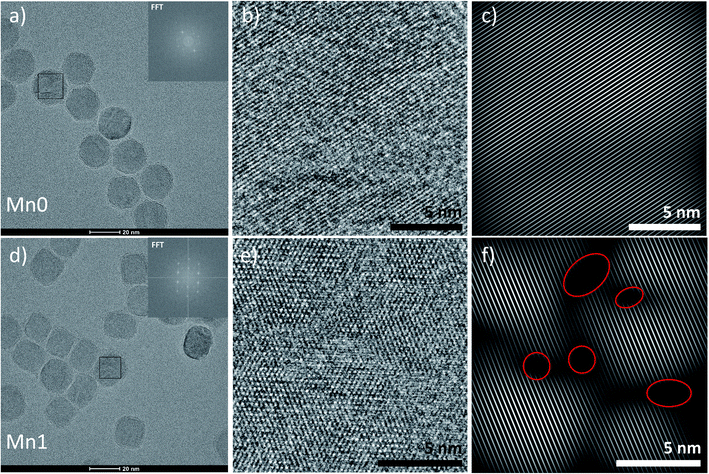
The plots in Fig. 7 showed the influence of composition on the crystallite size and the lattice parameter. The fitted lines are only for drawing the general trends and they do not necessarily mean the relationships are linear. Although, there are other factors that may also contribute to the peak broadening, such as microstrain, or instrumental broadening, the broadening caused by crystallite size effect is the most remarkable one and the general trend will be the same if other factors are considered. As seen in Fig. 7, regardless of the synthetic method and the size of the particles, for each series, when increasing manganese content, the crystallite size decreased, and the lattice parameters increased. The lattice parameter increase with the metal substitution was previously reported for zinc substitution,55–57 and for manganese substitution.29 Comparing to the particle sizes measured by TEM, the crystallite sizes are much smaller. The particles either have very low crystallinity or have polycrystalline structures. Fig. 8 revealed the microstructures inside the 20 nm oleate-2 particles. Fast Fourier Transformation (FFT) of a selected particle showed that the particles are highly crystalline, and the Inverse Fast Fourier Transformation (IFFT) operation on the brightest spot enabled us to see the lattice planes in the particles, as shown in Fig. 8c and f. In the IFFT images, Fig. 8c and f, lattice defects are seen especially for the samples with manganese substitution. It seems that the addition of manganese during the synthesis induced the formation of defects in the crystals and this explains the increase of lattice parameters with manganese substitution. The lattice parameters were calculated from the peak shift in the XRD diffractograms, which exhibits the overall value of the sum of particles instead of a single particle. Such defects also resulted in smaller crystallite sizes and larger microstrain of the crystals which explains the peak broadening in the XRD results and could also explain the reduction of magnetization of the manganese substituted ferrite particles. Unfortunately, in the previous studies related to substituted ferrite materials, insufficient attention was paid into the control of microstructures of the nanoparticles via chemical synthesis, which led to the inconsistency concerning the composition–property relationships as discussed in the introduction. Undoubtedly, more efforts on improving the crystallinity of the synthesized particles are needed to reconcile the experimental results with the computational results. With better control of the crystallinity of the synthesized nanoparticles, more understandings of the structure–property relationship will be explored in the future.
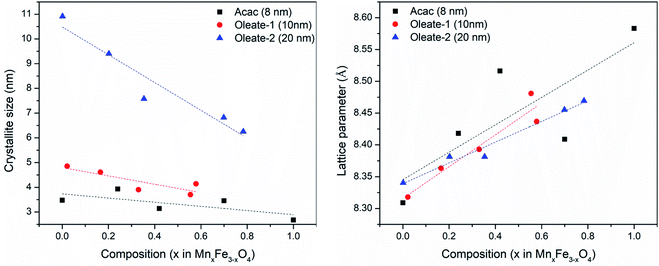 | ||
| Fig. 7 Crystallite sizes (left) and lattice parameters (right) of different samples calculated from XRD results. | ||
Conclusions
In this study, to study the correlation between the composition of manganese substituted ferrite nanoparticles and their saturation magnetization, nanoparticles were synthesized and characterized with precisely controlled size and compositions. The saturation magnetization was experimentally measured by VSM and calculated with DFT. The computational data suggested that the saturation magnetization increases with increasing the manganese content, while the experimental saturation magnetization becomes lower at higher manganese substitution levels. Further analysis of structure of the nanoparticles indicates that the incorporation of manganese results in the formation of defects in the crystalline structure and the shrinkage of the crystallite size, which lead to the reduction of saturation magnetization of the ferrite particles. This unexpected structure encourages us to put in more efforts to the synthesis of ferrite nanoparticles with minimized crystalline imperfections.Author contributions
Zichun Yan: project administration, conceptualization, methodology, investigation, data curation, formal analysis, writing – original draft, writing – review & editing. Anish Chaluvadi: conceptualization, methodology, investigation, data curation, writing – original draft, writing – review & editing. Sara FitzGerald: data curation. Sarah Spence: data curation. Christopher Bleyer: data curation, formal analysis. Jiazhou Zhu: conceptualization, methodology. Thomas M. Crawford: supervision, funding acquisition. Rachel B. Getman: supervision, funding acquisition, writing, review, and editing. John Watt: data curation, resources. Dale L. Huber: resources. O. Thompson Mefford: supervision, project administration, funding acquisition, writing – review & editing.Conflicts of interest
There are no conflicts to declare.Acknowledgements
This work was performed, in part, at the Center for Integrated Nanotechnologies, an Office of Science User Facility operated for the U.S. Department of Energy (DOE) Office of Science. Los Alamos National Laboratory, an affirmative action equal opportunity employer, is managed by Triad National Security, LLC for the U.S. Department of Energy's NNSA, under contract 89233218CNA000001. Sandia National Laboratories is a multimission laboratory managed and operated by National Technology & Engineering Solutions of Sandia, LLC, a wholly owned subsidiary of Honeywell International, Inc., for the U.S. DOE's National Nuclear Security Administration under contract DE-NA-0003525. The views expressed in the article do not necessarily represent the views of the U.S. DOE or the United States Government. ZY and OTM would like to thank the support by Materials Assembly and Design Excellence in South Carolina (MADE in SC), National Science Foundation award no. OIA-1655740 Grants for Exploratory Academic Research (GEAR). RG and OTM would like to thank the support of National Science Foundation award no. CBET-2146591. The imaging was funded by Clemson Core Incentivized Access (CU-CIA). TMC and SLF acknowledge support from NSF DMR award no. 1808426 and OIA award no. 1655740.References
- I. M. Obaidat, B. Issa and Y. Haik, Nanomaterials, 2014, 5, 63–89 CrossRef PubMed.
- C. E. Demirci Dönmez, P. K. Manna, R. Nickel, S. Aktürk and J. Van Lierop, ACS Appl. Mater. Interfaces, 2019, 11, 6858–6866 CrossRef PubMed.
- A. K. Hauser, R. J. Wydra, N. A. Stocke, K. W. Anderson and J. Z. Hilt, J. Contr. Release, 2015, 219, 76–94 CrossRef CAS PubMed.
- E. G. Fuller, H. Sun, R. D. Dhavalikar, M. Unni, G. M. Scheutz, B. S. Sumerlin and C. Rinaldi, ACS Appl. Polym. Mater., 2019, 1, 211–220 CrossRef CAS.
- E. Amstad, J. Kohlbrecher, E. Müller, T. Schweizer, M. Textor and E. Reimhult, Nano Lett., 2011, 11, 1664–1670 CrossRef CAS PubMed.
- M. Pernia Leal, A. Torti, A. Riedinger, R. La Fleur, D. Petti, R. Cingolani, R. Bertacco and T. Pellegrino, ACS Nano, 2012, 6, 10535–10545 CrossRef CAS PubMed.
- I. Fernández-Barahona, M. Muñoz-Hernando, J. Ruiz-Cabello, F. Herranz and J. Pellico, Inorganics, 2020, 8, 1–22 CrossRef.
- K. R. Hurley, H. L. Ring, M. Etheridge, J. Zhang, Z. Gao, Q. Shao, N. D. Klein, V. M. Szlag, C. Chung, T. M. Reineke, M. Garwood, J. C. Bischof and C. L. Haynes, Mol. Pharm., 2016, 13, 2172–2183 CrossRef CAS PubMed.
- T. H. Shin, Y. Choi, S. Kim and J. Cheon, Chem. Soc. Rev., 2015, 44, 4501–4516 RSC.
- H. Bin Na, I. C. Song and T. Hyeon, Adv. Mater., 2009, 21, 2133–2148 CrossRef.
- G. C. Cullity BD, B. D. Cullity and C. D. Graham, Introduction to magnetic materials, John Wiley & Sons, 2nd edn, 2011 Search PubMed.
- D. S. Mathew and R. S. Juang, Chem. Eng. J., 2007, 129, 51–65 CrossRef CAS.
- J. H. Lee, J. T. Jang, J. S. Choi, S. H. Moon, S. H. Noh, J. W. G. Kim, J. W. G. Kim, I. S. Kim, K. I. Park and J. Cheon, Nat. Nanotechnol., 2011, 6, 418–422 CrossRef CAS PubMed.
- M. Sanna Angotzi, V. Mameli, C. Cara, A. Musinu, C. Sangregorio, D. Niznansky, H. L. Xin, J. Vejpravova and C. Cannas, Nanoscale Adv., 2020, 2, 3191–3201 RSC.
- Q. Zhang, I. Castellanos-Rubio, R. Munshi, I. Orue, B. Pelaz, K. I. Gries, W. J. Parak, P. Del Pino and A. Pralle, Chem. Mater., 2015, 27, 7380–7387 CrossRef CAS PubMed.
- L. Del Bianco, F. Spizzo, G. Barucca, M. R. Ruggiero, S. Geninatti Crich, M. Forzan, E. Sieni and P. Sgarbossa, Nanoscale, 2019, 10896–10910 RSC.
- S. Xiao, X. Yu, L. Zhang, Y. Zhang, W. Fan, T. Sun, C. Zhou, Y. Liu, Y. Liu, M. Gong and D. Zhang, Int. J. Nanomed., 2019, 14, 8499–8507 CrossRef CAS PubMed.
- G. Huang, H. Li, J. Chen, Z. Zhao, L. Yang, X. Chi, Z. Chen, X. Wang and J. Gao, Nanoscale, 2014, 6, 10404–10412 RSC.
- J. Lu, S. Ma, J. Sun, C. Xia, C. Liu, Z. Wang, X. Zhao, F. Gao, Q. Gong and B. Song, Biomaterials, 2009, 30, 2919–2928 CrossRef CAS PubMed.
- J. T. Jang, H. Nah, J. H. Lee, S. H. Moon, M. G. Kim and J. Cheon, Angew. Chem., Int. Ed., 2009, 48, 1234–1238 CrossRef CAS PubMed.
- M. Zhang, Y. Cao, L. Wang, Y. Ma, X. Tu and Z. Zhang, ACS Appl. Mater. Interfaces, 2015, 7, 4650–4658 CrossRef CAS PubMed.
- X. Qian, X. Han, L. Yu, T. Xu and Y. Chen, Adv. Funct. Mater., 2020, 30(3), 1907066 CrossRef CAS.
- Y. Fu, X. Li, H. Chen, Z. Wang, W. Yang and H. Zhang, ACS Appl. Bio Mater., 2019, 2, 3613–3621 CrossRef CAS PubMed.
- L. Yang, L. Ma, J. Xin, A. Li, C. Sun, R. Wei, B. W. Ren, Z. Chen, H. Lin and J. Gao, Chem. Mater., 2017, 29, 3038–3047 CrossRef CAS.
- A. Pardo, B. Pelaz, J. Gallo, M. Bañobre-López, W. J. Parak, S. Barbosa, P. Del Pino and P. Taboada, Chem. Mater., 2020, 32, 2220–2231 CrossRef CAS.
- J. Amighian, E. Karimzadeh and M. Mozaffari, J. Magn. Magn. Mater., 2013, 332, 157–162 CrossRef CAS.
- X. Lasheras, M. Insausti, J. M. De La Fuente, I. Gil De Muro, I. Castellanos-Rubio, L. Marcano, M. L. Fernández-Gubieda, A. Serrano, R. Martín-Rodríguez, E. Garaio, J. A. García and L. Lezama, Dalton Trans., 2019, 48, 11480–11491 RSC.
- D. García-Soriano, R. Amaro, N. Lafuente-Gómez, P. Milán-Rois, Á. Somoza, C. Navío, F. Herranz, L. Gutiérrez and G. Salas, J. Colloid Interface Sci., 2020, 578, 510–521 CrossRef PubMed.
- D. Li, H. Yun, B. T. Diroll, V. V. T. Doan-Nguyen, J. M. Kikkawa and C. B. Murray, Chem. Mater., 2016, 28, 480–489 CrossRef CAS.
- S. Sun, H. Zeng, D. B. Robinson, S. Raoux, P. M. Rice, S. X. Wang and G. Li, J. Am. Chem. Soc., 2004, 126, 273–279 CrossRef CAS PubMed.
- Z. Nedelkoski, D. Kepaptsoglou, L. Lari, T. Wen, R. A. Booth, S. D. Oberdick, P. L. Galindo, Q. M. Ramasse, R. F. L. Evans, S. Majetich and V. K. Lazarov, Sci. Rep., 2017, 7, 1–8 CrossRef PubMed.
- J. Park, K. An, Y. Hwang, J. E. G. Park, H. J. Noh, J. Y. Kim, J. H. Park, N. M. Hwang and T. Hyeon, Nat. Mater., 2004, 3, 891–895 CrossRef CAS PubMed.
- Q. Song and Z. J. Zhang, J. Am. Chem. Soc., 2004, 126, 6164–6168 CrossRef CAS PubMed.
- A. G. Kolhatkar, A. C. Jamison, D. Litvinov, R. C. Willson and T. R. Lee, Tuning the magnetic properties of nanoparticles, Int. J. Mol. Sci., 2013, 14(8), 15977–16009 CrossRef PubMed.
- Z. Yan, S. FitzGerald, T. M. Crawford and O. T. Mefford, J. Phys.: Mater., 2021, 4, 034013 CAS.
- S. H. Petrosko and E. S. Day, Biomedical nanotechnology: methods and protocols, Springer, 2017 Search PubMed.
- R. W. Chantrell, J. Popplewell and S. W. Charles, IEEE Trans. Magn., 1978, 14, 975–977 CrossRef.
- O. L. Lanier, O. I. Korotych, A. G. Monsalve, D. Wable, S. Savliwala, N. W. F. Grooms, C. Nacea, O. R. Tuitt and J. Dobson, Int. J. Hyperther., 2019, 36, 687–701 Search PubMed.
- M. Unni, A. M. Uhl, S. Savliwala, B. H. Savitzky, R. Dhavalikar, N. Garraud, D. P. Arnold, L. F. Kourkoutis, J. S. Andrew and C. Rinaldi, ACS Nano, 2017, 11, 2284–2303 CrossRef CAS PubMed.
- L. Maldonado-Camargo, M. Unni and C. Rinaldi, in Biomedical Nanotechnology, Springer, 2017, pp. 47–71 Search PubMed.
- G. M. Saladino, B. Hamawandi, C. Vogt, G. K. Rajarao and M. S. Toprak, Appl. Nanosci., 2020, 10, 1861–1869 CrossRef CAS.
- G. M. Saladino, SPfit – Superparamagnetic Fit (v1.0), Zenodo, 2019, DOI:10.5281/zenodo.3244439r.
- R. M. Ferguson, K. R. Minard, A. P. Khandhar and K. M. Krishnan, Med. Phys., 2011, 38, 1619–1626 CrossRef PubMed.
- G. Kresse and J. Furthmüller, Phys. Rev. B, 1996, 54, 11169 CrossRef CAS PubMed.
- G. Kresse and J. Furthmüller, Comput. Mater. Sci., 1996, 6, 15–50 CrossRef CAS.
- G. Kresse and J. Hafner, Phys. Rev. B, 1994, 49, 14251 CrossRef CAS PubMed.
- G. Kresse and J. Hafner, Phys. Rev. B, 1993, 47, 558 CrossRef CAS PubMed.
- J. P. Perdew, K. Burke and M. Ernzerhof, Phys. Rev. Lett., 1996, 77, 3865 CrossRef CAS PubMed.
- J. J. Mortensen, L. B. Hansen and K. W. Jacobsen, Phys. Rev. B, 2005, 71, 35109 CrossRef.
- G. Kresse and D. Joubert, Phys. Rev. B: Condens. Matter Mater. Phys., 1999, 59, 1758 CrossRef CAS.
- A. Rohrbach, J. Hafner and G. Kresse, J. Phys.: Condens. Matter, 2003, 15, 979 CrossRef CAS.
- O. Bengone, M. Alouani, P. Blöchl and J. Hugel, Phys. Rev. B, 2000, 62, 16392 CrossRef CAS.
- A. I. Liechtenstein, V. I. Anisimov and J. Zaanen, Phys. Rev. B, 1995, 52, R5467 CrossRef CAS PubMed.
- S. L. Dudarev, G. A. Botton, S. Y. Savrasov, C. J. Humphreys and A. P. Sutton, Phys. Rev. B, 1998, 57, 1505 CrossRef CAS.
- V. Mameli, A. Musinu, A. Ardu, G. Ennas, D. Peddis, D. Niznansky, C. Sangregorio, C. Innocenti, N. T. K. Thanh and C. Cannas, Nanoscale, 2016, 8, 10124–10137 RSC.
- D. V. Kurmude, R. S. Barkule, A. V. Raut, D. R. Shengule and K. M. Jadhav, J. Supercond. Nov. Magnetism, 2014, 27, 547–553 CrossRef CAS.
- A. H. Monfared, A. Zamanian, M. Beygzadeh, I. Sharifi and M. Mozafari, J. Alloys Compd., 2017, 693, 1090–1095 CrossRef CAS.
Footnotes |
| † Electronic supplementary information (ESI) available. See https://doi.org/10.1039/d2na00200k |
| ‡ Present address: Suzhou Novartis Technical Development Co., Ltd, Changshu, China. |
| This journal is © The Royal Society of Chemistry 2022 |

