 Open Access Article
New insight into the kinetic study on the different loadings of the CuO/CNT catalyst and its optimization for p-chloroaniline photodegradation†
Nur
Farahain binti Khusnun
 a,
Aishah Abdul
Jalil
 ab,
Arshad
Ahmad
*ab,
Muhammad
Ikram
 *c,
Nurul Sahida
Hassan
a,
Walid
Nabgan
 d,
Mahadi
Bahari
e,
Rafiziana
Kasmani
ab and
Norafneeza
Norazahar
ab
aSchool of Chemical and Energy Engineering, Faculty of Engineering, Universiti Teknologi Malaysia, 81310 UTM Johor Bahru, Johor, Malaysia. E-mail: arshad@utm.my
bCentre of Hydrogen Energy, Institute of Future Energy, Universiti Teknologi Malaysia, 81310 UTM Johor Bahru, Johor, Malaysia
cSolar Cell Applications Research Lab, Department of Physics, Government College University Lahore, 54000, Punjab, Pakistan. E-mail: dr.muhammadikram@gcu.edu.pk
dDepartament d’Enginyeria Química, Universitat Rovira I Virgili, Av Països Catalans 26, 43007, Tarragona, Spain
eFaculty of Science, Universiti Teknologi Malaysia, 81310 UTM Johor Bahru, Johor, Malaysia
First published on 18th May 2022
Abstract
The effect of the copper (Cu) content on Cu oxide loaded onto a carbon nanotube (CuO/CNT) catalyst on the mechanistic, kinetic, and photonic efficiency of the photodegradation of p-chloroaniline (PCA) under visible (Vis) and ultraviolet (UV) light irradiation has been explored. For low-loading (1–5 wt%) CuO/CNTs, photodegradation performed better under UV (>84%) rather than the Vis system; this may be due to the presence of abundant defect sites on both CuO and CNTs, which allowed the multielectron reduction of oxygen at their impurity levels to generate more hydrogen peroxide and subsequent ·OH radicals. The active species under UV were in the following order: h+ ≫ e− > ·OH, while it was vice versa for the Vis system with a well-balanced 50 wt% CuO/CNT catalyst that exhibited a similar performance. The kinetic study showed the transition of the kinetic order from the zeroth to the first order on increasing the PCA concentration under the Vis system and vice versa for the UV system. The Thiele modulus (ϕ) further confirmed that the effect of internal mass transfer was negligible under UV light. In contrast, the transition from mass transfer to kinetic control limitation was observed under the Vis system. The optimum PCA degradation predicted from the response surface analysis was 97.36% at the reaction pH of 7.3, catalyst dosage of 0.45 g L−1, and initial PCA concentration of 11.02 mg L−1. The condition obtained was fairly close to the forecasted value with an error of 0.26%.
Introduction
Over the last decades, advanced oxidation processes (AOPs) have been broadly industrialized to remediate water containing persistent organic pollutants.1,2 Among AOPs, semiconductor photocatalysis is applicable to a wide variety of applications. It can resolve environmental issues economically and safely, and has attracted increasing interest.3–6 However, conventional photocatalysis still faces unsolved problems such as the narrow spectral response range (λ < 365 nm) and low photon utilization efficiency. Many strategies, such as the modification of the crystal structure of metal oxides, exposed facet-engineering, morphology tuning, constructing heterojunction structures, and improving carbon materials, have been investigated on the studied semiconductors to enhance charge separation.7 Recently, the use of smaller band gap semiconductors such as copper oxide (CuO) has become a matter of great significance because its light absorption is expected to be extended to the visible light (Vis) region. CuO is a p-type semiconductor with exciting properties such as high stability, direct bandgap (1.2–1.7 eV), plentiful sources, easy preparation, less harmful, inexpensive, and ecofriendly. CuO has been used as an active photocatalyst by many researchers previously.8–10 However, using CuO has some limitations; its narrow band gap causes the recombination of the photogenerated electrons and holes.11Innovative carbon materials, especially carbon nanotubes (CNTs) that have a metal oxide surface built into them to improve the photocatalytic activity, have become a hot topic.12 CNTs have been shown to exhibit superior conductivity and electron mobility, high specific surface area, and stability that have become a component of semiconductors in various environmental applications.13,14 They also modify the light absorption properties due to changes in the dynamics of charge carriers and increase in the surface electrical charge of metal oxides in the composite.15 Niyaz et al. found out that the dyes Reactive Red 120 and Direct Red 31 from colored wastewater were successfully degraded by the CuO/CNT nanocomposite photocatalyst.16 Moreover, previous studies have also proved that combining CuO and CNTs can achieve the highest photodegradation efficiency of PCA under both Vis and UV light irradiation systems.17,18
However, not many attempts have been made to quantify the activity in terms of photon efficiency for synthesized CNT semiconductor photocatalysts in recent years. In addition, most researchers have aimed at studying the effect of operating parameters on the degradation rate and design aspects of the reactor.19,20 To the best of our knowledge, the detailed work has been rarely reported in the literature. Hence, this study investigated those aspects thoroughly on the CuO/CNT catalyst towards the photodecomposition of PCA under both Vis and UV light irradiation systems. Optimization using the response surface methodology (RSM) was also examined to determine the optimal conditions for the degradation of PCA by the best catalyst.
Materials and methods
Materials, synthesis of the catalyst, and characterization
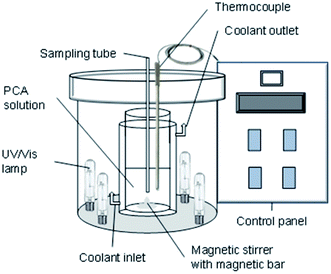
Multiwalled carbon nanotubes (MWCNTs) (CAS Num. 308068-56-6) with a diameter of 10–20 nm and a length of 10–50 nm were purchased from Chengdu Organic Chemicals Co., Ltd (China). N,N-Dimethylformamide (DMF) (CAS Num. 4472-41-7) was obtained from J. T. Baker and naphthalene (CAS Num. 91-20-3) was obtained from Fluka. Copper (Cu) (CAS Num. 7440-50-8) and platinum (Pt) (CAS Num. 7440-06-4) plates were purchased from Nilaco, Japan. Sodium hydroxide (NaOH) (CAS Num. 1310-73-2) and hydrochloric acid (HCl) (CAS Num. 7647-01-0) were obtained from Merck. p-Chloroaniline (PCA) (CAS Num. 7647-01-0) was obtained from Acros. Deionized water was used for the preparation of the pH solution. All chemicals and solvents used were guaranteed or analytical grade reagents commercially available and used without further purification. In this work, a 36 W UV lamp (254 nm) and 39 W metal halide lamp (400 nm) were used for UV and visible light sources, respectively. The schematic of the reactor used is illustrated in Fig. 1. The details of the synthesis of the CuO/CNT photocatalysts, characterization, and the degradation of para-chloroaniline (PCA) were discussed in the previous paper.17,18Photonic efficiency
The photonic efficiency is introduced to quantify the efficiency of the reaction process in this study. The description of photonic efficiency proposed by Serpone as the number of molecules converted in relation to the total number of incident photons is shown in eqn (1).21 | (1) |
Experimental design and optimization
In this study, a combination of mathematical and statistical methods by response surface methodology (RSM) was applied on the photodegradation of PCA to find the optimum value of the process variable. The main purpose of RSM was to find out a suitable model to predict and optimize the reactions. The optimum value of the independent variable is determined by finding a point known as the stationary point. A standard RSM analysis is used in conjunction with a central composite design (CCD) to generate reasonable experimental runs and to analyze the interaction between the variables. An analysis of variance (ANOVA) was also performed for the generated regression model to ensure its statistical significance.22,23Results and discussion
Photocatalytic performance and proposed mechanism of PCA under UV and Vis light irradiation
Fig. 2A exhibits the performance of all catalysts on the photodegradation of PCA after 300 min irradiation of light. The 40% photodegradation (not shown in the figure) from the photolysis result evidently showed that the presence of the catalyst was important in this study. It was observed that under Vis light, pristine CNTs exhibited almost similar activity as the lower CuO loading (<3 wt%) under UV light. However, increasing the CuO loading up to 50 wt% enhanced the degradation to 97%, verifying that the CuO/CNT composite with a band gap of 1.7 eV is indeed a Vis light-driven photocatalyst. At the same time, the activity of pristine CNTs was slightly lower under UV irradiation but increased with the increase in the CuO loading up to 3 wt% CuO/CNTs to give the highest degradation of PCA (96%). A further addition to 5 wt% CuO seems to inhibit degradation due to the excess dispersion of less active CuO on the surface of CNTs.17 From these results, it can be concluded that there is an optimum amount of CuO, which should be loaded on CNTs for the best Cu-CNT interaction for the enhanced degradation of PCA in both Vis and UV irradiation systems. For evaluation, an additional experiment on the photodegradation of PCA was conducted using commercial TiO2 under the same conditions to compare the performance with the synthesized catalyst. As shown in Fig. S3,† the percentages of PCA degradation obtained by commercial TiO2 under UV and Vis systems are only 38.4% and 56%, respectively. It is proved that the synthesized CuO/CNT catalyst has higher activity towards PCA photodegradation.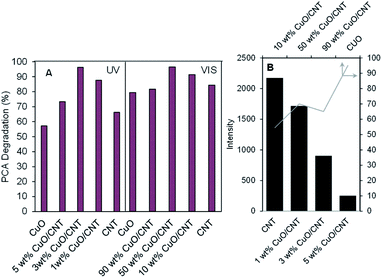 | ||
| Fig. 2 (A) Performance of the CuO/CNT catalyst toward the photodegradation of PCA under both light irradiation systems. (B) Summary of ESR peaks for all catalysts. | ||
The unpaired electrons inside the catalyst were investigated previously by electron spin resonance (ESR) spectroscopy,17,18 and their peak intensities are summarized in Fig. 2B. It can be clearly observed that low CuO loading (1–5 wt%) onto CNTs, particularly 1 wt% CuO/CNTs, possessed more than twenty three times higher number of unpaired electrons than the higher CuO loading (10–90 wt%) catalysts. This is certainly due to the interaction between the Cu species with –OH– and –COOH–enriched CNTs, which led to the formation of excess oxygen vacancies (OVs) or oxygen atom defects.1,24 Comparing 1 wt% CuO/CNTs with 3 wt% CuO/CNTs and 5 wt% CuO/CNTs, the number of unpaired electrons dropped about six folds, indicating that the charge compensation by the higher loading of Cu species fixed the defect sites of CNT backbones25 In contrast, further introduction of Cu species from 10 to 90 wt% demonstrated an increasing amount of unpaired electrons, and this most probably came from the excess defect sites of Cu species (Cu2+, Cu+), which were unfulfilled by the low amount of CNTs. These variations in the defect sites undoubtedly offer an interesting impact that may lead to different PCA degradation pathways under both Vis and UV light irradiation.
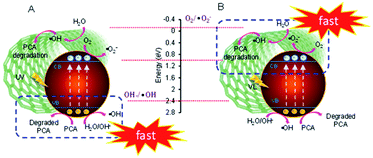
Based on the abovementioned and previous data,17 the mechanism of PCA degradation over both ranges of CuO loaded onto CNTs under both UV and Vis light irradiation is proposed, as shown in Fig. 3. In fact, the energy potentials to reduce O2 to generate O2˙− and ·OH radicals are −0.046 eV (as shown in the figure) and 2.4 eV, respectively.26 Thus, the excited electrons in the conduction band (CB) position of CuO (1.0 eV vs. NHE) can merely possibly generate ·OH under both systems. For low CuO loading, it is obviously observed from Fig. 2A that generally, photodegradation performed better under Vis than UV irradiation. In addition, the performance under Vis light over low-loading CuO/CNTs is also similar when using CNTs under the UV light. This may be due to the higher number of defects where CNTs with a smaller bandgap (1.5 eV) than CuO was the main component, and this enabled the excitation of electrons not only from the valence band (VB) to the CB of CNTs and CuO but also between both the positions of its impurity levels. However, at a certain level of hybridization of Cu with CNTs, specifically, 3 wt% CuO/CNTs, the high energy of UV may exploit maximum electron excitation, while the optimum interaction between Cu–CNT may give adequate defect sites as well as oxygen vacancies (OV), which act as electron acceptors to suppress the e−–h+ recombination thus preserving the degradation. The holes (h+) generated in both VBs of CNTs and CuO then react with water or hydroxyl anions (−OH) to generate ·OH or directly react with PCA to degrade it.27 This is in line with the scavenger results, which confirm that the active species that play an important role in UV degradation are in the following order: h+ ≫ e− > ·OH.17
In the case of high-loading CuO/CNTs under Vis light, the electrons on the CB position of CuO and CNTs also faced the same circumstances for being unable to generate O2˙− radicals. Still, they could be involved in the multielectron reduction of oxygen to generate hydrogen peroxide that finally gave ·OH radicals.28 The effect of the scavenger study proved that the important active species order was: e− ≥ ·OH > h+, which signified that the impurity levels of both CNTs and CuO were significant in PCA degradation by exciting and accepting electrons, particularly in the well-balanced CuO-CNT ratio of 50 wt%.18 Further addition of copper may block the surface contact of CNTs, thus reducing the synergistic effect of both CuO-CNT and PCA degradation.
Kinetic study
Based on the abovementioned results, the two best catalysts, 3 wt% CuO/CNTs and 50 wt% CuO/CNTs were used to investigate the kinetics of PCA degradation under UV and Vis light irradiation, respectively. In fact, the effect of the initial concentration (10–100 mg L−1) on the degradation of PCA under UV and Vis systems is shown in Fig. S1.† Herein, three kinetic models were used: zeroth-, first-, and second-order, and are expressed from eqn (2) to eqn (4),29 | (2) |
 | (3) |
 | (4) |
| (Ct) = (C0) − kapp0t | (5) |
 | (6) |
 | (7) |
The linear plots of these kinetic models under both UV and Vis systems are shown in Fig. S2.† The kapp and coefficient linear regression (R2) values were obtained from the slopes of the resulting straight line and are tabulated in Table S1.† From the values, it is clearly observed that at a lower concentration range of 10–50 mg L−1, degradation under the UV system followed the first-order kinetic model, and this seems to deviate to the zeroth-order kinetic model when the concentration increased up to 100 mg L−1 (although the fitting to eqn (4) is still remarkable) and vice versa for degradation under the Vis system (Fig. 4). These kinetic transitions could be explained based on the schematic shown in Fig. 4. For the UV-irradiated system, the low concentration of PCA is supposed to be easily oxidized directly or indirectly via ·OH radicals generated by holes, particularly in the VB of a major component of CNTs.17
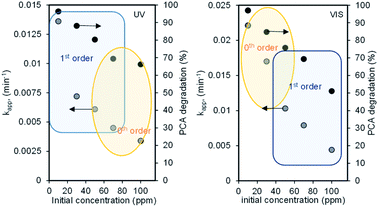 | ||
| Fig. 4 Effect of the initial concentration on the reaction order under (A) UV and (B) Vis light irradiation systems. | ||
A similar phenomenon occurred in the VB of CuO but increasing the concentration of PCA proportionally increased the generation of ·OH radicals, including ·OH generated from oxygen, which then acted as limiting reactants in the system and caused the reaction to be controlled by lower-order kinetics.30 In contrast, the defect site-rich high CuO content-loaded CNTs allowed the excess excitation of electrons when irradiated by VL not only from the VB to CB of both CNTs and CuO but also from their impurity levels, and this led to the electrons with high energy to generate more ·OH radicals, which became the limiting reactant at a lower PCA concentration and the degradation is not controlled by any concentration in the system. However, a higher concentration of PCA decreased the degradation rate and caused the transition from kinetic-controlled reaction to mass transfer limitation.31
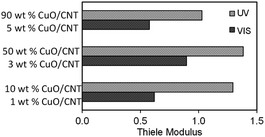
Next, mass transfer studies were also done to determine the rate-limiting step for the adsorption of PCA from the aqueous solution on the catalyst. The influence of internal mass transfer was estimated by the Thiele modulus (ϕ) using eqn (8),32
 | (8) |
Effect of CuO loading on initial rates and photonic efficiency
The photon efficiency (Φ) of PCA photodegradation was further investigated by relating the initial reaction rates of PCA (r0) to the rates of the incident photons, reaching the reactor (I) by an actinometer (eqn (1)). As shown in Table 1, in the case of the UV system, r0 increased proportionately with Φ up to 3 wt% CuO/CNTs, and then decreased when 5 wt% CuO was added. A similar trend was observed from 10 wt% CuO/CNTs to 50 wt% CuO/CNTs under the Vis system, but Φ considerably increased for 90 wt% CuO/CNTs. In both cases, the higher degree of defect sites or/and Cu–O–C interaction probably triggered more adsorption sites for PCA, which facilitated the photogenerated e−–h+ transfer and enhanced the photodegradation efficiency.17,18| Catalyst | Initial rate, r0 (×10−5 mmol L−1 s−1) | Photonic efficiency, Φ (%) |
|---|---|---|
| UV | ||
| 1 wt% CuO/CNTs | 1.50 | 0.96 |
| 3 wt% CuO/CNTs | 2.10 | 1.34 |
| 5 wt% CuO/CNTs | 1.26 | 0.83 |
| CuO | 0.81 | 5.27 |
![[thin space (1/6-em)]](https://www.rsc.org/images/entities/char_2009.gif) |
||
| Vis | ||
| 10 wt% CuO/CNTs | 1.83 | 2.01 |
| 50 wt% CuO/CNTs | 2.14 | 6.39 |
| 90 wt% CuO/CNTs | 1.39 | 45.7 |
| CuO | 2.17 | 21.0 |
Photonic efficiency for hydroxyl radical generation
To quantify the rate of ·OH radicals generated by the photogenerated holes on the catalyst surface, a known hydroxyl radical scavenger, methanol, was used and the reaction was performed with 3 wt% CuO/CNTs and 50 wt% CuO/CNTs under the UV and Vis systems, respectively.33 As shown in Fig. 6A, the reduction trend of the methanol concentration as a function of time is similar under both UV and Vis systems. The degree of reduction is slightly higher for the latter, demonstrating that the rate of ·OH generation under Vis is higher than that under UV irradiation. Considering the reaction following the pseudo-first-order Langmuir–Hinshelwood model, the initial rate of methanol reduction (r0) could be calculated using eqn (7) by multiplying the value of kapp with the corresponding initial methanol concentration (Fig. 6B).34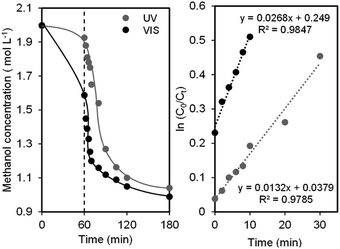 | ||
| Fig. 6 (A) The evolution of methanol oxidation as a function of time and (B) pseudo-first order Langmuir–Hinshelwood model fitting. | ||
As tabulated in Table S2,†r0 values are 4.40 and 8.93 × 10⁻⁷ mmol L−1 s−1, while the photonic efficiencies (Φ) obtained during the photocatalytic oxidation of 2 M methanol in aqueous suspension of the catalysts are 2.81 and 2.67 × 10⁻³ mmol Einstein−1 for UV and VL system, respectively. These values were calculated by assuming the relation Φmethanol = 2Φ·OH, which agrees with the oxidation mechanism reported in the literature.35 Due to the initial methanol concentration of 2 M, which can trap all photogenerated ·OH, these values can be taken as the maximum Φ obtainable in an ·OH-mediated photocatalytic oxidation.
Both values in both systems are relatively smaller than the corresponding values listed in Table 2, confirming a part of the role of ·OH in photodegradation. Although Φ for UV and Vis systems are almost similar, r0 under Vis is two times higher than that under UV, further verifying the vital role of ·OH under the former than that under the latter.
| Condition | UV 3 wt% CuO/CNTs | Vis 50 wt% CuO/CNTs | ||
|---|---|---|---|---|
| Initial rate, (×10−5 mmol L−1 s−1) | Photonic efficiency, Φ (%) | Initial rate, r0 (×10−5 mmol L−1 s−1) | Photonic efficiency, Φ (%) | |
| pH | ||||
| 3 | 1.08 | 0.69 | 1.63 | 4.86 |
| 5 | 1.18 | 0.75 | 1.68 | 5.02 |
| 7 | 2.10 | 1.34 | 2.14 | 6.39 |
| 9 | 1.89 | 1.21 | 1.79 | 5.37 |
| 11 | 2.06 | 1.31 | 1.22 | 3.64 |
![[thin space (1/6-em)]](https://www.rsc.org/images/entities/char_2009.gif) |
||||
| Catalyst dosage (g L −1 ) | ||||
| 0.125 | 1.78 | 1.15 | 1.40 | 4.19 |
| 0.25 | 2.15 | 1.37 | 2.14 | 6.39 |
| 0.375 | 2.10 | 1.34 | 2.14 | 6.39 |
| 0.5 | 1.65 | 1.05 | 1.55 | 4.63 |
| 0.625 | 1.93 | 1.23 | 1.14 | 3.41 |
![[thin space (1/6-em)]](https://www.rsc.org/images/entities/char_2009.gif) |
||||
| Initial concentration (mg L −1 ) | ||||
| 10 | 2.10 | 1.34 | 2.14 | 6.39 |
| 30 | 2.83 | 1.81 | 6.69 | 2.00 |
| 50 | 4.00 | 2.55 | 6.76 | 2.02 |
| 70 | 4.13 | 2.64 | 7.17 | 2.14 |
| 100 | 4.46 | 2.85 | 7.22 | 2.16 |
Optimization by response surface methodology (RSM)
In order to study the effect of reaction parameters on the catalytic performance of 50 wt% CuO/CNTs, a statistical approach was employed to design the experiments using CCD interface of RSM. All 16 experimental runs of CCD were performed. CCD was adopted to develop a model that predicts the interaction between the process parameters and response (PCA degradation percentage) (Sadhukhan et al., 2016; Saeed et al., 2015). As shown in Table S3,† three important parameters, pH (A), catalyst dosage (B), and PCA initial concentration (C) were considered as independent variables. At the same time, the photodegradation percentage (Y) was selected as the study's response (dependent variable). Based on the RSM result, the obtained data were matched into the general quadratic polynomial (eqn (9)) and the final model is stated in eqn (10): | (9) |
| Y = 96.5983 + 8.68A + 5.36B + 3.84C − 30.2448A2 − 12.6448B2 − 18.6448C2 − 4.85AB − 15.45AC + 14.9BC | (10) |
Fig. S4† shows the parity plot comparing the observed values of percentage degradation (%) with the predicted values. The coefficient of determination (R2) is 0.9301, indicating that the model accounts for 93.01% of data variability. Haaland (1989) stated that the empirical model should be more than 0.75 in order to adequately explain most of the variability in reading the essay.36 Table S4† shows the variance (ANOVA) analysis of the regression parameters for the predicted response surface quadratic model. According to the ANOVA results, the model was significant, as evidenced by a larger calculated F-value (F-model = 5.38) than a tabulated F-value (F-table = 4.099) for the respective degrees of freedom and probability (p = 0.05).37
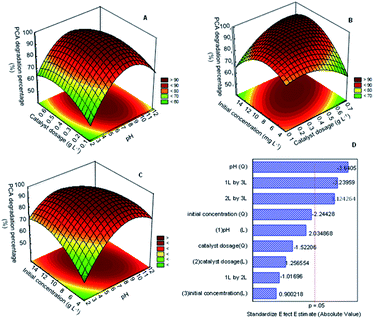
Simple approaches for studying and optimizing the efficiency of the reaction process include response surfaces and contour graphs. To better understand the relationship between the degradation of PCA and studied variables A, B, and C, three-dimensional surface graphs based on polynomial functions were plotted. Fig. 7A displays the relationship between the catalyst dosage and pH, while Fig. 7B and C correspond to the initial concentration and catalyst dosage and initial concentration and pH. All the response surface plots have an elliptical shape, indicating a good interaction between the variables studied.37
Fig. 7A shows the relationship between catalyst dosage and pH on PCA degradation onto the best catalyst. The result shows that the catalyst dosage did not give a much significant effect on the PCA degradation at low pH (<5), but the degradation increased on increasing pH up to pH 9. This finding matched with the analysis of variance (ANOVA) in Table S4† and pareto chart in Fig. 7D, for which the mean square value (47.045) and t-value (−1.02) for 1 L by 2 L was lower compared to other variables, supporting that the relationship of these variables had less significant factor for PCA degradation. It might be due to excess catalyst covering the active surface and impeding light penetration. On the other hand, the rise in the number of hydroxyl groups competes with the PCA ions in the system. These phenomena would decrease the efficiency of the photodegradation of PCA.
The relationship between the initial concentration and the catalyst dosage is displayed in Fig. 7B. The result shows that the increase in the catalyst dosage up to 0.5 g L−1 and initial concentration up to 10 mg L−1 increased the PCA degradation. The relationship between these parameters gave quite a significant impact on the PCA degradation as the mean square value reached 444.04 and the t-value was 1.12. Nevertheless, a further increase in the catalyst dosage to more than 0.5 g L−1 and 10 mg L−1 of the PCA initial concentration decreased the PCA degradation. As mentioned before, the surplus amount of the catalyst used and high initial concentration of PCA could inhibit light penetration to the surface of the catalyst and thus reduce the formation of radicals that plays such an important role in degradation.
Fig. 7C shows the relationship between the initial concentration and pH. As shown, PCA degradation occurred when both the pH and initial concentration increased more than 10 mg L−1 and pH 5, respectively. However, the degradation decreased with the decrease in both parameters. From this result, it could be seen that both these parameters have a significant impact on the degradation of PCA. This finding matched with the analysis of variance (ANOVA) in Table S4† and Pareto chart in Fig. 6D, for which the mean square value (477.405) and t-value (−3.24) for 1 L by 3 L was higher compared to the other variables, supporting that the relationship of these variables had a highly significant factor in PCA degradation.
The t-distribution values in a Pareto chart, as well as the related p-values of the variables for the PCA degradation using CuO/CNTs are shown in Fig. 7D. The relevance of the related parameter was determined using the p-value and t-value, with the smaller p-value and larger figure of the t-value representing the more vital parameter. According to Fig. 7D, pH (Q) (A2 = 3.6405), interaction pH (A) with initial concentration (C) (AC = 3.23959) and interaction catalyst dosage (B) with initial concentration (C) (BC = 3.124264) are the most significant variables for PCA degradation, followed by initial concentration (Q) (C2 = 2.24428), owing to the p-value < 0.05.
The optimum PCA degradation predicted from the response surface analysis was 97.36% at pH 7.3, catalyst dosage of 0.45 g L−1, and initial concentration of 11.01 mg L−1. A confirmation experiment was performed to validate the optimization results obtained from the response surface analysis. The PCA degradation of the experiment under optimal conditions was 97.1% and the difference between the predicted and observed values was 0.26%.
Conclusions
In this study, a low- (1–5 wt%) and high-loading (10–90 wt%) of CuO in a CuO/CNT catalyst were studied in detail for their mechanistic, kinetics, and photonic efficiency. From the results, the low-loading of CuO achieved higher degradation under UV compared to Vis. The excess defect sites from CuO and CNTs were found to be the cause for the multielectron reduction of oxygen at their impurity levels to generate more hydrogen peroxide and subsequent ·OH radicals. However, 3 wt% CuO/CNTs reached the highest degradation (96%) under UV irradiation due to the creation of more Cu-CNT interaction, oxygen vacancies, and defect sites, which act as electron acceptors to hinder the recombination of electrons and holes. In contrast, the same achievement was obtained by the high-loading of CuO (50 wt% CuO/CNTs) under Vis irradiation. It can be alleged that an optimum amount of CuO should be loaded on CNTs to enhance the performance under both UV and Vis systems. The kinetic study showed the transition of the kinetic order from the first to zeroth order under the UV system on increasing the PCA concentration, and vice versa for the Vis system. The effect of internal mass transfer was found to be negligible under the UV light as the value of the Thiele modulus (ϕ) obtained was less than 1 (ϕVis > 1). Hence, it supports the fact that under the UV system, the reaction is controlled by kinetics rather than mass transfer and vice versa for the VIS system. Optimization by response surface methodology over the best catalyst of 50 wt% CuO/CNTs indicated that pH was the main parameter affecting the reaction with a 97.36% degradation at pH 7.3, catalyst dosage of 0.45 g L−1, and PCA initial concentration of 11.02 mg L−1. The condition obtained was fairly close to the predicted value with an error of 0.26%.Author contributions
Nur Farahain Khusnun: formal analysis; investigation; methodology; validation; writing – original draft, Aishah Abdul Jalil: conceptualization; funding acquisition; supervision; writing – original draft, Ahmad Arshad: conceptualization; supervision Muhammad Ikram: conceptualization; resources, Nurul Sahida Hassan: validation; writing – review & editing, Mahadi Bahari: writing – original draft, Walid Nabgan: writing – original draft, Rafiziana Kasmani: supervision Norafneeza Norazahar: validation.Conflicts of interest
There are no conflicts to declare.Acknowledgements
This research study was sponsored by the Universiti Teknologi Malaysia through UTM High Impact grant (Grant No. 08G92) and Professional Development Research University Grant (No. 05E55).Notes and references
- C. N. C. Hitam, A. A. Jalil and Y. O. Raji, Top. Catal., 2020, 63, 1169–1181 CrossRef CAS.
- C. N. C. Hitam, A. A. Jalil, S. M. Izan, M. S. Azami, M. H. Hassim and N. Chanlek, Powder Technol., 2020, 375, 397–408 CrossRef CAS.
- A. Fauzi, A. Jalil, C. Hitam, F. Aziz and N. Chanlek, J. Environ. Chem. Eng., 2020, 8, 104484 CrossRef CAS.
- L. Gnanasekaran, R. Pachaiappan, P. S. Kumar, T. K. A. Hoang, S. Rajendran, D. Durgalakshmi, M. Soto-Moscoso, L. Cornejo-Ponce and F. Gracia, Environ. Pollut., 2021, 287, 117304 CrossRef CAS PubMed.
- S. Rajendran, R. Pachaiappan, T. K. A. Hoang, S. Karthikeyan, L. Gnanasekaran, S. Vadivel, M. Soto-Moscoso and M. A. Gracia-Pinilla, J. Hazard. Mater., 2021, 416, 125989 CrossRef CAS PubMed.
- G. Ramalingam, R. Pachaiappan, P. S. Kumar, S. Dharani, S. Rajendran, D.-V. N. Vo and T. K. A. Hoang, Chemosphere, 2022, 288, 132448 CrossRef CAS PubMed.
- M. Azami, A. Jalil, N. Hassan, I. Hussain, A. Fauzi and M. Aziz, J. Hazard. Mater., 2021, 414, 125524 CrossRef CAS PubMed.
- R. Katal, S. Masudy-panah, E. Y. J. Kong, N. Dasineh Khiavi, M. H. D. Abadi Farahani and X. Gong, Catal. Today, 2020, 340, 236–244 CrossRef CAS.
- D. C. T. Nguyen, K. Y. Cho and W.-C. Oh, Sep. Purif. Technol., 2019, 211, 646–657 CrossRef CAS.
- A. Jalil, M. Satar, S. Triwahyono, H. Setiabudi, N. Kamarudin, N. Jaafar, N. Sapawe and R. Ahamad, J. Electroanal. Chem., 2013, 701, 50–58 CrossRef CAS.
- S. S. Hossain, M. Tarek, T. D. Munusamy, K. M. Rezaul Karim, S. M. Roopan, S. M. Sarkar, C. K. Cheng and M. M. Rahman Khan, Environ. Res., 2020, 188, 109803 CrossRef CAS PubMed.
- Z. Liu, X. Cui, C. Piao, J. Tang, S. Li, D. Fang and J. Wang, Powder Technol., 2020, 368, 213–226 CrossRef CAS.
- S. Bargozideh, M. Tasviri and M. Ghabraei, Environ. Sci. Pollut. Res. Int., 2020, 27, 36754–36764 CrossRef CAS PubMed.
- Y. Chen, J. Qian, N. Wang, J. Xing and L. Liu, Inorg. Chem. Commun., 2020, 119 Search PubMed.
- I. Ahmad, S. Shukrullah, M. Y. Naz, M. A. Rasheed, M. Ahmad, E. Ahmed, M. S. Akhtar, N. R. Khalid, A. Hussain and S. Khalid, Int. J. Hydrogen Energy, 2021, 46, 26711–26724 CrossRef CAS.
- N. M. Mahmoodi, P. Rezaei, C. Ghotbei and M. Kazemeini, Fibers Polym., 2016, 17, 1842–1848 CrossRef CAS.
- N. Khusnun, A. Jalil, S. Triwahyono, N. Jusoh, A. Johari and K. Kidam, Phys. Chem. Chem. Phys., 2016, 18, 12323–12331 RSC.
- N. Khusnun, A. Jalil, S. Triwahyono, C. Hitam, N. Hassan, F. Jamian, W. Nabgan, T. Abdullah, M. Kamaruddin and D. Hartanto, Powder Technol., 2018, 327, 170–178 CrossRef CAS.
- T. A. Kandiel, R. Dillert, L. Robben and D. W. Bahnemann, Catal. Today, 2011, 161, 196–201 CrossRef CAS.
- L. A. Al-Hajji, A. A. Ismail, M. Faycal Atitar, I. Abdelfattah and A. M. El-Toni, Ceram. Int., 2019, 45, 1265–1272 CrossRef CAS.
- N. Serpone, J. Photochem. Photobiol., A, 1997, 104, 1–12 CrossRef CAS.
- M. A. Bezerra, R. E. Santelli, E. P. Oliveira, L. S. Villar and L. A. Escaleira, Talanta, 2008, 76, 965–977 CrossRef CAS PubMed.
- H. Chaker, A. E. Attar, M. Djennas and S. Fourmentin, Chem. Eng. Res. Des., 2021, 171, 198–212 CrossRef CAS.
- N. S. Hassan, A. A. Jalil, F. F. A. Aziz, A. A. Fauzi, M. S. Azami and N. W. C. Jusoh, Top. Catal., 2020, 63, 1145–1156 CrossRef CAS.
- A. V. Sidorenko, P. A. Rodnyi, O. Guillot-Noel, D. Gourier and C. W. E. Van Eijk, Phys. Solid State, 2003, 45(9), 1676–1678 CrossRef CAS.
- Z. Cai, Y. Song, X. Jin, C. C. Wang, H. Ji, W. Liu and X. Sun, Sci. Total Environ., 2021, 781, 146754 CrossRef CAS PubMed.
- F. Aziz, A. Jalil, N. Hassan, C. Hitam, A. Rahman and A. Fauzi, J. Hazard. Mater., 2021, 401, 123277 CrossRef CAS PubMed.
- A. Zada, M. Khan, M. A. Khan, Q. Khan, A. Habibi-Yangjeh, A. Dang and M. Maqbool, Environ. Res., 2021, 195, 110742 CrossRef CAS PubMed.
- M. Shaban, M. R. Abukhadra, A. Hamd, R. R. Amin and A. Abdel Khalek, J. Environ. Manage., 2017, 204, 189–199 CrossRef CAS PubMed.
- D. Dimitrakopoulou, I. Rethemiotaki, Z. Frontistis, N. P. Xekoukoulotakis, D. Venieri and D. Mantzavinos, J. Environ. Manage., 2012, 98, 168–174 CrossRef CAS PubMed.
- D. Klauson, J. Babkina, K. Stepanova, M. Krichevskaya and S. Preis, Catal. Today, 2010, 151, 39–45 CrossRef CAS.
- M. V. Martin, O. M. Alfano and M. L. Satuf, J. Environ. Chem. Eng., 2019, 7, 103478 CrossRef CAS.
- R. Gao, J. Stark, D. W. Bahnemann and J. Rabani, J. Photochem. Photobiol., A, 2002, 148, 387–391 CrossRef CAS.
- D. Jiang, H. Zhao, Z. Jia, J. Cao and R. John, J. Photochem. Photobiol., A, 2001, 144, 197–204 CrossRef CAS.
- J. Marugán, D. Hufschmidt, M.-J. López-Muñoz, V. Selzer and D. Bahnemann, Appl. Catal., B, 2006, 62, 201–207 CrossRef.
- P. D. Haaland, Experimental Design in Biotechnology, CRC press, 2020 Search PubMed.
- N. F. Khusnun, A. A. Jalil, T. A. T. Abdullah, S. S. M. Latip, C. N. C. Hitam, A. A. Fauzi, N. S. Hassan, M. A. H. Aziz, A. F. A. Rahman, F. F. A. Aziz, M. Bahari, R. H. Adnan and R. Saravanan, J. CO2 Util., 2022, 58, 101901 CrossRef CAS.
Footnote |
| † Electronic supplementary information (ESI) available. See https://doi.org/10.1039/d2na00216g |
| This journal is © The Royal Society of Chemistry 2022 |

