
 Open Access Article
 This Open Access Article is licensed under a Creative Commons Attribution-Non Commercial 3.0 Unported Licence
Thermosensitive textiles made from silver nanoparticle-filled brown cotton fibers
Sunghyun
Nam
 *a,
In-Suck
Baek
b,
Matthew B.
Hillyer
a,
Zhongqi
He
a,
Jinyoung Y.
Barnaby
c,
Brian D.
Condon
a and
Moon S.
Kim
b
*a,
In-Suck
Baek
b,
Matthew B.
Hillyer
a,
Zhongqi
He
a,
Jinyoung Y.
Barnaby
c,
Brian D.
Condon
a and
Moon S.
Kim
b
aU.S. Department of Agriculture, Agricultural Research Service, Southern Regional Research Center, New Orleans, LA 70124, USA. E-mail: sunghyun.nam@usda.gov; Fax: +1 504 286 4390; Tel: +1 504 286 4229
bU.S. Department of Agriculture, Agricultural Research Service, Environmental Microbial and Food Safety Laboratory, Beltsville, MD 20705, USA
cU.S. Department of Agriculture, Agricultural Research Service, Floral and Nursery Plant Research Unit, Beltsville, MD 20705, USA
First published on 20th June 2022
Abstract
Filling fibers with nanomaterials can create new functions or modify the existing properties. However, as nanocomposite formation for natural cellulosic fibers has been challenging, little information is available on how the embedded nanomaterials alter the properties of cellulosic fibers. Here we filled brown cotton fibers with silver nanoparticles (Ag NPs) to examine their thermosensitive properties. Using naturally present tannins in brown cotton fibers as a reducing agent, Ag NP-filled brown cotton fibers (nanoparticle diameter of about 28 nm, weight fraction of 12![[thin space (1/6-em)]](https://www.rsc.org/images/entities/char_2009.gif) 500 mg kg−1) were produced through a one-step process without using any external agents. The in situ formation of Ag NPs was uniform across the nonwoven cotton fabric and was concentrated in the lumen of the fibers. The insertion of Ag NPs into the fibers shifted the thermal decomposition of cellulose to lower temperatures with increased activation energy and promoted heat release during combustion. Ag NPs lowered the thermal effusivity of the fabric, causing the fabric to feel warmer than the control brown cotton. Ag NP-filled brown cotton was more effectively heated to higher temperatures than control brown cotton under the same heating treatments.
500 mg kg−1) were produced through a one-step process without using any external agents. The in situ formation of Ag NPs was uniform across the nonwoven cotton fabric and was concentrated in the lumen of the fibers. The insertion of Ag NPs into the fibers shifted the thermal decomposition of cellulose to lower temperatures with increased activation energy and promoted heat release during combustion. Ag NPs lowered the thermal effusivity of the fabric, causing the fabric to feel warmer than the control brown cotton. Ag NP-filled brown cotton was more effectively heated to higher temperatures than control brown cotton under the same heating treatments.
1. Introduction
Embedding nanoparticles into fibers has been practiced for decades. The resulting nanocomposite fibers have properties widely different from those of host fibers.1–6 The filled nanoparticles enhance the existing properties of fibers or add new functionalities to fibers. The most commonly used approach for making nanocomposite fibers is to mix nanoparticles in a polymer solution (or melt) and spin the mixture into fibers. In some cases, nanoparticles are in situ produced in a polymer matrix before spinning. These approaches, however, are inappropriate for natural fibers such as cotton, silk, and wool, since they destroy the naturally occurring structure, which mostly contributes to the unique aesthetic characteristics, comfort, and performance. As a result, the incorporation of nanoparticles for natural fibers has been typically implemented on or near the surface of fibers.7–9 The nanoparticles located near the fiber surface are not durable, however. They easily detach by external forces during use and washing. For example, commercial textiles applied with silver nanoparticles (Ag NPs) lost up to 20–30% of the total silver in the first washing.10–12Another hurdle to the fabrication of nanocomposite fibers is the aggregation of nanoparticles.13 Due to the high surface energy of nanoparticles, a good dispersion of the particles in the polymer host is a great challenge. Moreover, the enthalpic and entropic interactions of nanoparticles with polymer chains play a key role in determining the spatial distribution of nanoparticles.13 The modification of the surface of nanoparticles or polymers has been used as one of the approaches to mediate their interactions and achieve the desirable dispersion of nanoparticles.14,15 Cellulose is no exception—it is not readily compatible with inorganic nanoparticles. In a study for fabricating nanocomposite cellulosic fibers, most of the magnesium hydroxide nanoparticles aggregated when they were mixed with cellulose in an ionic liquid.16 The lack of feasible methods for filling natural fibers with inorganic solids without aggregation while preserving their naturally occurring structure has led to little success in fabricating true nanocomposite natural fibers and thus little knowledge on the properties of nanoparticle-filled natural fibers.
In this study, we dispersed silver nanoparticles (Ag NPs) inside a natural cellulosic fiber—brown cotton fiber—without disturbing its hierarchical internal structure or modifying any composite components. As a result, a pure nanocomposite fiber consisting only of brown cotton fiber and Ag NPs was obtained. Our approach was to utilize brown cotton fiber as a nano-reactor, allowing the fiber to generate nanoparticles on its own. The natural component of tannins served as a reducing agent and the internal structure of the fiber served as a submicron reaction chamber to control the reduction reaction and the particle growth. The goal of this study is to examine how the embedded Ag NPs alter the thermal decomposition of cotton cellulose and thermal response of cotton fibers. Thermal decomposition and combustion of Ag NP-filled brown cotton fibers under both nitrogen and air environments were studied using thermogravimetric (TG) and microscale combustion calorimetric (MCC) analyses, respectively. The thermal decomposition kinetics was conducted using an isoconversional Friedman method. The thermal effusivity was used to quantitively measure the effect of Ag NPs on the warm feel of brown cotton nonwoven fabrics. The thermal response of the fabrics from different heat treatments was also monitored. The results help to elucidate how Ag NP insertion in the microfibrillar structure influences the macroscopic thermal properties of cotton.
2. Experimental
2.1. Materials
Brown cotton fiber was purchased from Foxfibre (Brooks, CA). Silver nitrate (AgNO3, 99.9%) was purchased from J. T. Baker. Triton X-100, methyl methacrylate, butyl methacrylate, and methyl ethyl ketone were purchased from Sigma-Aldrich. All chemicals were used as received without further purification. Deionized (DI) water was used as a solvent. For some characterization experiments, brown cotton fibers were transformed into a hydroentangled nonwoven fabric, whose fabrication procedure has been described in the literature.17 The area density of the fabric measured according to ASTM D 6242-98 was 105 ± 5 g m−2.2.2. Preparation of Ag NP-filled brown cotton
About 0.25 g of brown cotton fiber or nonwoven fabric was immersed in 25 mL aqueous solution of AgNO3 (5 mM). To enhance the wettability of raw brown cotton fibers, Triton X-100 (0.05 wt%) was added. The immersed sample was heated at 100 °C for 2 hours. After the treatment, the sample was washed in DI water multiple times and air-dried.2.3. Characterization
The optical microscopy images of fibers in the longitudinal and cross-sectional directions were obtained in the transmission mode using a digital microscope (KH-8700, Hirox). To prepare the cross-section of fibers, a randomly collected bundle of fibers was combed and embedded in a mixture of methyl methacrylate and butyl methacrylate, which was then polymerized using a UV cross-linker (UVP, CL-1000) for 30 min following the published techniques.18,19 A block of the embedded sample was cut into about 300 nm-thick slices using a PowerTome Ultramicrotome (Boeckeler Instruments, Inc.). The obtained section was placed on a glass slide, and the embedding medium was removed using methyl ethyl ketone.Scanning electron microscopy (SEM), energy-dispersive X-ray spectroscopy (EDS), and elemental mapping analyses were conducted using field-emission SEM (Quanta 3D FEG FIB/SEM, FEI) equipped with an EDS detector (Apollo XL, EDAX). The field emission gun was operated at an accelerating voltage of 5 kV and gun current of 3.0 pA. The sample was mounted on the stub using double-sided carbon tape, and a platinum coating was sputtered onto the surface of the sample to reduce the build-up of electrons. The fiber was cross-sectioned by focused ion beam (FIB) milling with gallium as the ion source. From the sliced fiber surface, EDS and elemental maps were acquired. The size of Ag NPs on the cross-section of the fiber was determined using ImageJ software.20 The selected area electron diffraction (SAED) measurement on the cross-section of fibers was conducted using a transmission electron microscope (TEM, JEM-2010, Jeol) operating at 200 kV.
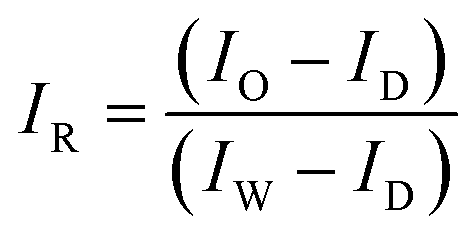
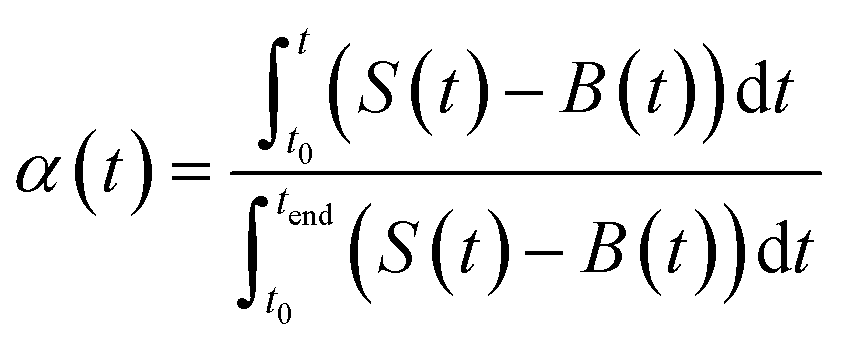
Hyperspectral reflectance and fluorescence images were acquired using a custom-built laboratory-based hyperspectral line-scan imaging system.21 The system consists of an electron-multiplying charge-coupled device (EMCCD: Luca R DL-604M, 14-bit, Andor Technology), an imaging spectrograph (VNIR Concentric Imaging Spectrograph, Headwall Photonics), a programmable linear moving stage, a pair of 150 W halogen lamps with DC power supplied for reflectance imaging, and a pair of 365 nm LEDs (model XX-15A; Spectronics Corp) for fluorescence imaging. Samples placed on the moving stage were scanned line by line at 0.5 mm steps to acquire the hyperspectral image data. To calibrate the spatial information and eliminate basic camera noise in the images, the calibration processes detailed in eqn (1) and (2) were applied to the reflectance and fluorescence images, respectively:
 | (1) |
| IF = (IO − ID) × IC | (2) |
The concentration of Ag in the fiber was determined using an inductively coupled plasma mass spectrometer (ICP-MS) in the ICP-MS Metals Laboratory at the University of Utah. Approximately 0.05 g of the sample was treated with 2 mL of 16 M nitric acid (trace metal grade) and digested in a Milestone Ethos microwave system. The digest was diluted by weight (1:10), and 10 ppb of indium as an internal standard was added. The digested solution was analyzed with an external calibration curve obtained using a silver single element standard (Inorganic Ventures).
Thermogravimetric (TG) and differential thermogravimetric (DTG) analyses were performed using a TGA Q500 thermal gravimetric analyzer (TA Instruments) under a nitrogen or an air atmosphere at a flow rate of 90 mL min−1. Approximately 4 mg of the sample was placed in a platinum pan and heated from 25 ± 3 °C to 1000 °C with a heating rate of 10 °C min−1. TG and DTG thermograms were analyzed using Universal Analysis 2000 software (TA Instruments). Five measurements were performed.
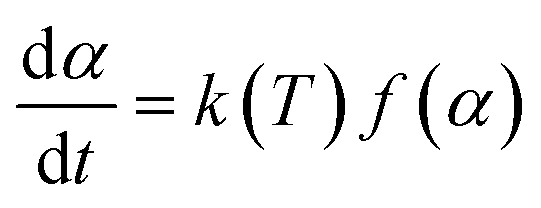
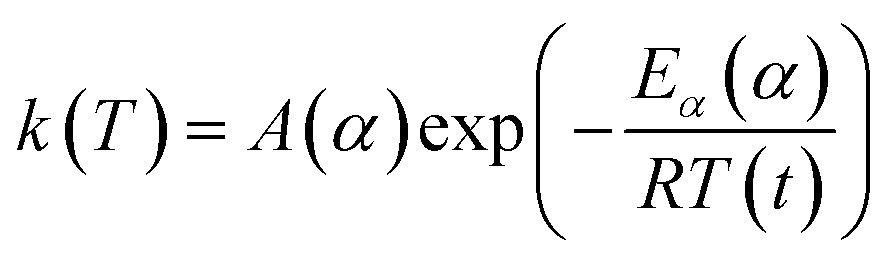
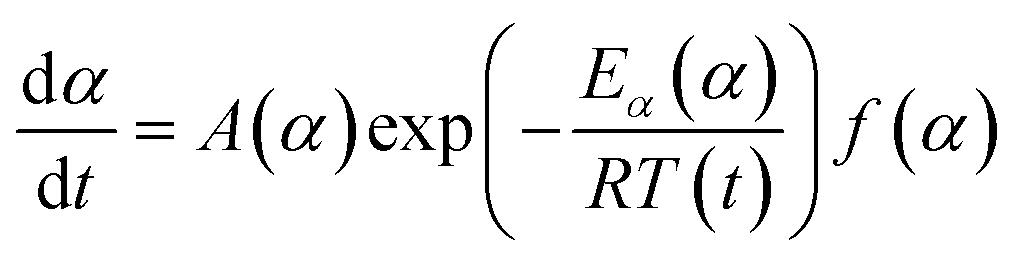
A thermal kinetics study was conducted using four heating rates of 1, 2, 5, and 10 °C min−1 to measure the activation energy (Ea) for the thermal decomposition. The Ea was determined by the isoconversional differential Friedman method22 using AKTS-Thermokinetics software (version 4.46). This method is based on the fundamental kinetic equation (eqn (3)), which describes the rate of conversion, dα/dt, as a function of two time-dependent variables—temperature (T) and the conversion of reaction (α). The value of α varies from 0 to 1 from initiation to completion.
 | (3) |
 | (4) |
 | (5) |
 | (6) |
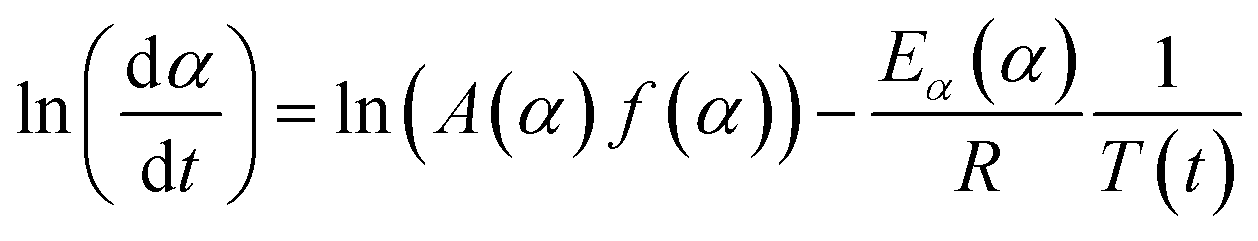
Applying the logarithm to both sides of eqn (6) yields the following equation, which expresses dα/dt as a function of the reciprocal temperature at any α:
 | (7) |
Plotting ln(dα/dt) as a function of 1/T(t) at a given α leads to a straight line. The Ea can be calculated from the slope of the straight line (−Ea(α)/R).
Combustion properties were evaluated using a microscale combustion calorimeter (MCC) (MCC-2, Deatak) according to ASTM D 7309-13. Approximately 4 mg of the sample was heated to 650 °C at a heating rate of 1 °C s−1 in a nitrogen flow at 80 cm3 min−1. The thermal decomposition products formed in a pyrolyzer were mixed with an oxygen stream at 20 cm3 min−1 in a combustor and completely oxidized at 900 °C for 10 s. The oxygen depletion involved in the combustion was determined by the oxygen concentration and flow rate of the combustion gases to measure the heat release rate (HRR). The parameters obtained by the MCC Curve Fit v.2 software (Deatak) are: the specific HRR (W g−1) obtained by dividing the HRR by the initial sample mass; the peak heat release rate (PHRR, W g−1), which is the maximum specific HRR; temperature at PHRR (TPHRR, °C); the heat release capacity (HRC, J g−1 K−1) obtained by dividing PHRR by the heating rate; the total heat release (THR, J g−1), which is the area under the specific HRR peak; and char content determined by weighing the sample before and after pyrolysis. The average value of five measurements was presented.
Thermal effusivity at ambient temperature was measured using a thermal conductivity analyzer (C-Therm TCi, Thermal Analysis Labs) in the modified transient plane source configuration, which was operated in accordance with ASTM D7984. A rectangular sample (5 cm × 5 cm) was placed on the sensor coil, and a 500 gF compressive force was applied onto the sample. A known current was then applied to the sensor, resulting in a rise in temperature at the interface between the sensor and sample. The increase in temperature was monitored with the sensor voltage, which was used to determine the thermal effusivity, i.e., the thermal effusivity is inversely proportional to the rate of increase in the sensor voltage.
The heat response of samples was measured using a thermal infrared imaging analyzer (228 GRD, Fotric Thermal Intelligence). A rectangular nonwoven fabric (5 cm × 5 cm) was placed vertically such that one side of the fabric was in contact with the hot plate. While the temperature of the hot plate was increased from room temperature to 70 °C, the thermal infrared image of the sample was recorded. The sample was also heated using a microwave oven (Whirlpool Corporation) with an output of 700 watts at 2450 MHz. The sample was heated for 4 min and removed from the microwave oven. The thermal infrared image of the sample was immediately obtained. The average temperature for all pixels of the sample was determined.
3. Results and discussion
3.1. Ag NP-filled brown cotton fibers
Brown cotton is a naturally colored cotton (Gossypium hirsutum L.). With a growing market for eco-friendly materials of natural occurrence, naturally colored cotton products have been gaining attention. Fig. 1a and 2b show the optical microscopy images of brown cotton fibers before and after filling the fibers with Ag NPs. Like white cotton fibers, control brown cotton fibers are twisted and flattened. This ribbon conformation with a kidney-like cross-section is formed as the central vacuole (lumen) dries and collapses during fiber maturation. The twists (or convolutions) allow fibers to be readily spinnable into yarns. The brown color, which is more obvious in the longitudinal view, is developed when the seed pod opens, and the fibers are exposed to oxygen and sunlight.23 The brown color is not uniform across the fiber diameter but darker in the lumen area. This is because condensed tannins (proanthocyanidins), which are known to be responsible for the brown color, are concentrated in the lumen.24–26 After the in situ synthesis of Ag NPs inside brown cotton fibers, the fibers turned brown-black. When observed under the optical microscope, they appear to be redder in color. It is obvious that the color intensity is greater in the lumen than the rest of the fiber. The condensed tannins acted as a reducing agent for Ag ions, promoting the formation of Ag NPs in the lumen. The acidic phenol hydroxyl groups of tannins reduce cationic Ag ions to metallic Ag atoms through oxidation into diketones.27 Polyol molecules have been popularly used to synthesize Ag NPs.28 The dendritic structure of tannins helps to cage Ag ions and stabilize the interaction with Ag ions for the reduction reaction.27,29 Following nucleation and nuclei growth by the addition of Ag atoms, Ag particles rapidly grow by particle coalescence.30 The swollen microfibrillar network in water not only allows Ag ions to diffuse into the cotton fiber but also creates nanosized fluidic channels to promote the reduction reaction and to control the particle growth.30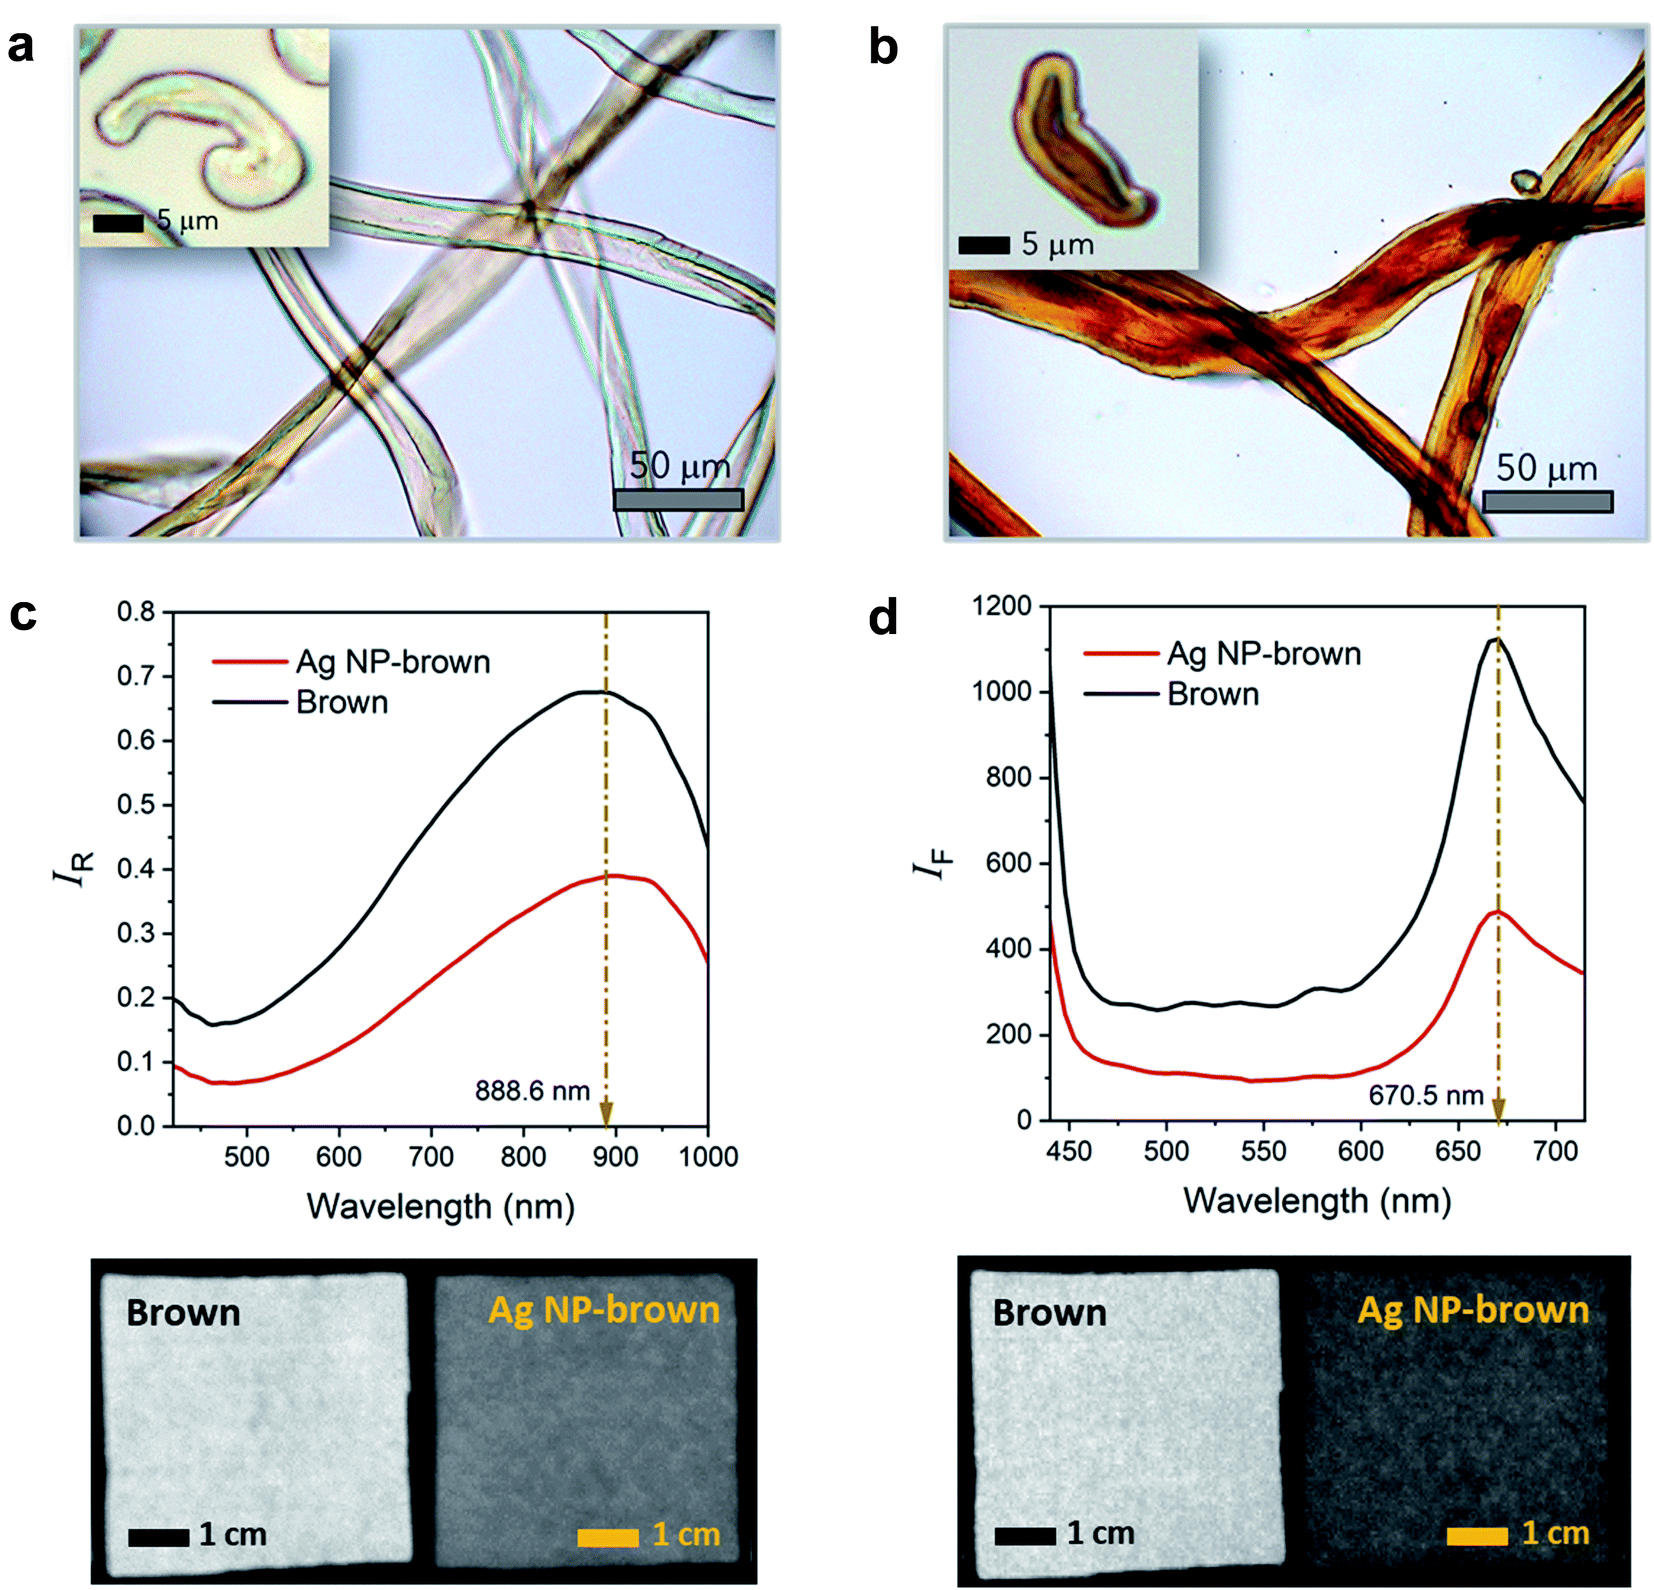 | ||
| Fig. 1 Optical microscopy images of the longitudinal views for (a) control brown cotton fibers and (b) Ag NP-filled brown cotton fibers. The insets show the respective images of cross-sectional views. (c) Vis/NIR reflectance spectra (top) and hyperspectral images (bottom) collected at 889 nm and (d) fluorescence emission spectra (top) and hyperspectral images (bottom) collected at 671 nm for control brown cotton and Ag NP-filled brown cotton nonwoven fabrics. | ||
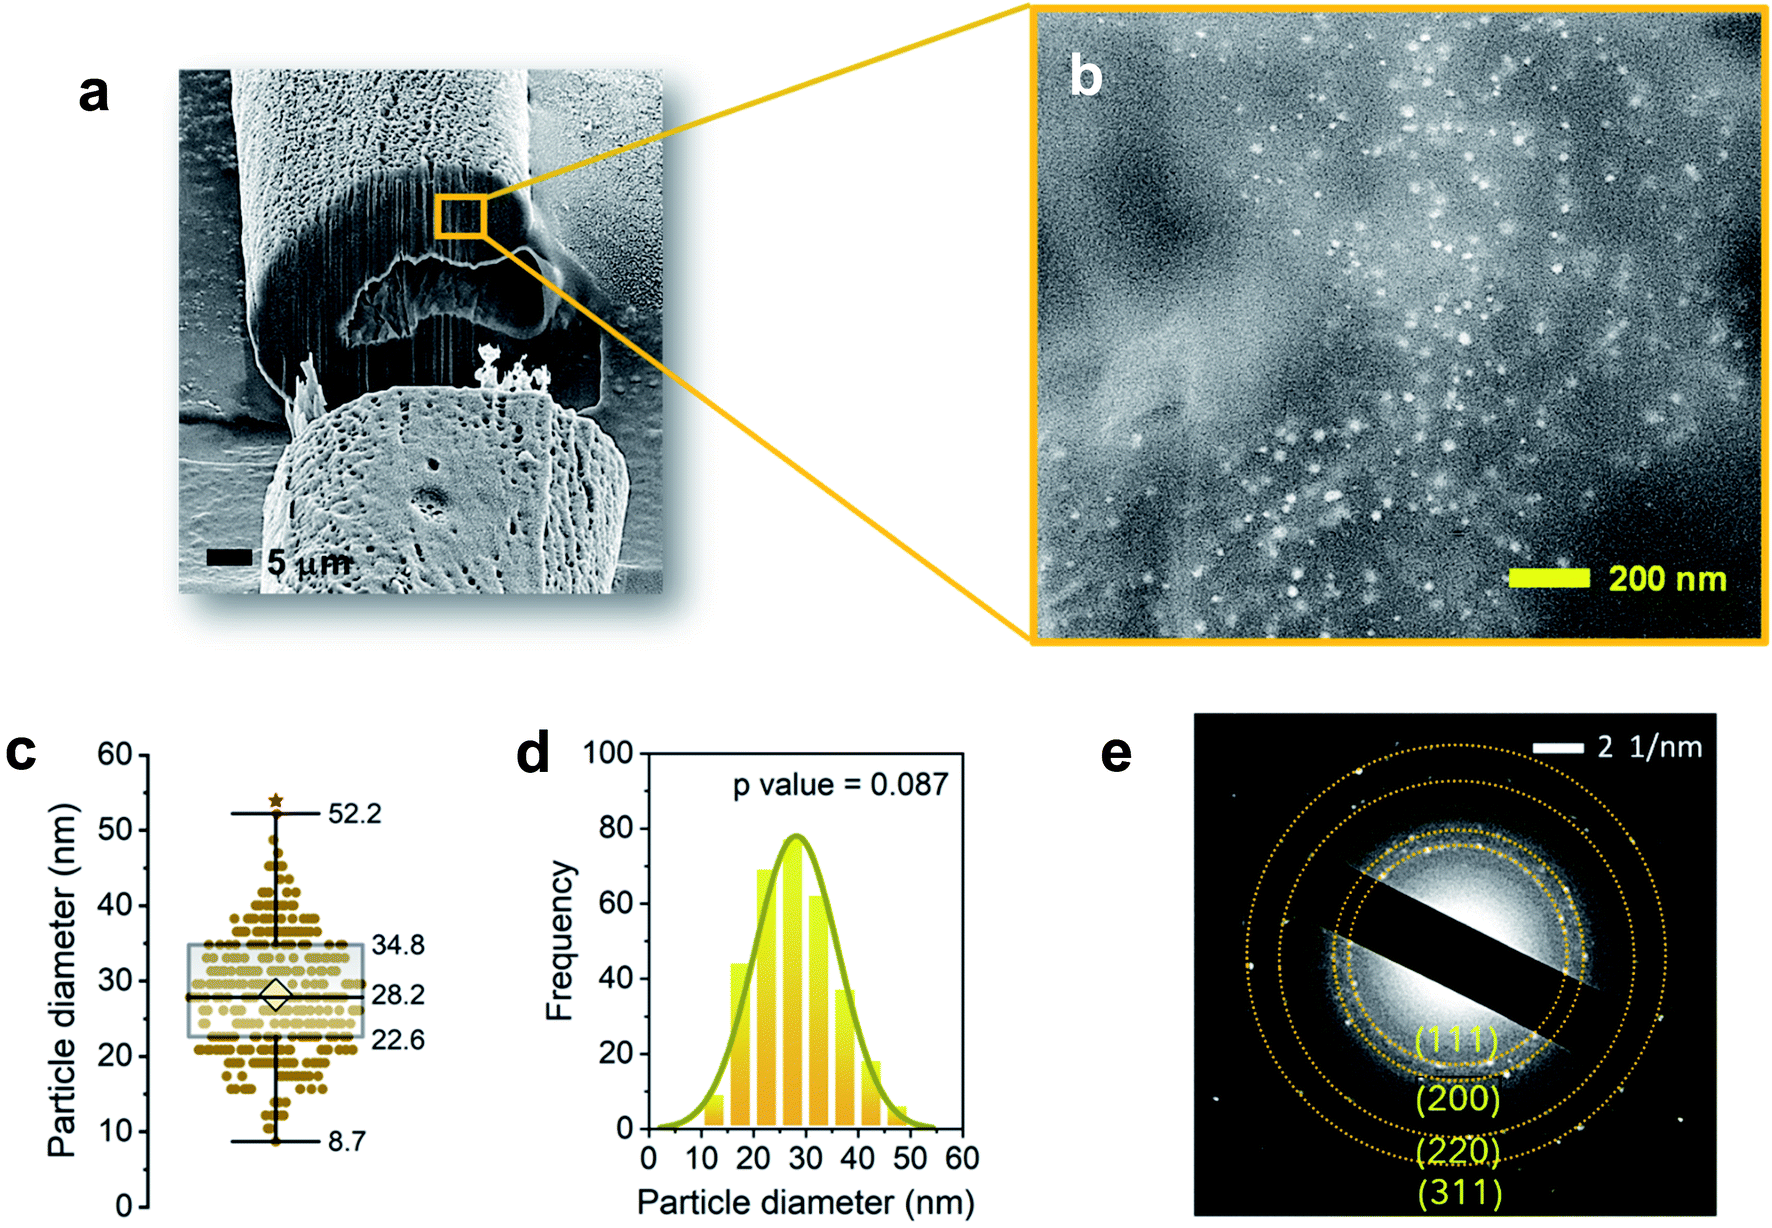 | ||
| Fig. 2 FE-SEM images of the cross-sectioned cotton fiber by a focused ion beam (FIB) at (a) low and (b) high magnifications showing Ag NPs formed inside the fiber. (c) Box plot and (d) histogram for the Ag NP diameter. The average diameter is 28.2 ± 8.0 nm. The solid line is a Gaussian fit to the distribution of the size. (e) SAED pattern taken on the cross-sectioned fiber. | ||
The surface plasmon resonance of Ag NPs induced by the interaction of the conduction electrons of nanoparticles with the electromagnetic wave of incoming light gives rise to intense color. As a result, the insertion of Ag NPs inside the fiber can introduce a variety of shades of brown color for coloration. The intrinsic twisted morphology was maintained after the fiber was filled with Ag NPs. A previous study showed that Ag NPs formed within a cotton fiber reinforced fiber, increasing the breaking strength of a single fiber by about 9.4%.31Fig. 1c shows the Vis/NIR reflectance spectra and corresponding hyperspectral images for control brown and Ag NP-filled brown cotton nonwoven fabrics. The control fabric exhibited greater reflectance with increasing wavelength starting from 460 nm and reached a maximum reflectance at about 889 nm. The native brown coloration of the fiber was attributed to the spectral feature in the visible range from 460 to 750 nm. The broad NIR peak at 889 nm was due to the C–H third overtone (800–1100 nm) and O–H second overtone (800–100 nm) of cotton cellulose.32 The Vis/NIR reflectance spectral feature of the Ag NP-filled brown cotton nonwoven fabric was nearly the same, but with lower intensity than that of the control fabric. The reduction of the reflectance intensity reflects the substantial integration of Ag NPs to the fiber. The uniform, darker hyperspectral image for the Ag NP-filled brown cotton fabric, as compared with the image of the control fabric, demonstrates that Ag NPs were uniformly formed throughout the fabric from the one-step synthetic process. Fig. 1d shows the fluorescence emission spectra and corresponding hyperspectral images for control brown and Ag NP-filled brown cotton nonwoven fabrics. With the fluorescence excitation wavelength of 365 nm, the control fabric exhibited an emission peak at around 671 nm. This peak was considered to arise from the condensed tannins present in the brown cotton fibers.33 Ag NPs in aqueous solution were shown to produce two emissions at 490 nm and 450 nm at the excitation wavelength of 390 nm.34 For Ag NP-filled brown cotton, no fluorescence emissions from Ag NPs were detected. The brown cotton medium, where Ag NPs were fully embedded, quenched the fluorescence of Ag NPs. Consistently, the reduction of the fluorescence intensity of tannins and corresponding hyperspectral image showing a uniform and darker color of the Ag NP-filled fabric demonstrate the feasibility of the in situ synthetic method used in this study.
The internal formation of Ag NPs was confirmed by cross-sectioning the fiber under a FIB and imaging it using an FE-SEM. Fig. 2a and b show the low and high magnification images of the lumen area. It can be seen that a significant number of Ag NPs were formed without aggregation within the fiber. Most nanoparticles are sphere-like. The average diameter was determined to be 28.2 ± 8.0 nm (Fig. 2c). The distribution of particle size was fitted to a Gaussian function (Fig. 2d), whose goodness of fit was verified using the Kolmogorov–Smirnov test (p value = 0.087). The SAED measurement on the cross-sectioned fiber (Fig. 2e) shows the characteristic lattice spacing for metallic Ag. The four concentric patterns with intermediate bright dots correspond to the (1 1 1), (2 0 0), (2 2 0), and (3 1 1) planes of the face-centered cubic (fcc) structure of elemental Ag. The elemental composition of the Ag NP-filled brown cotton fiber was examined by EDS analysis (Fig. 3). The EDS spectrum collected from the highlighted area in Fig. 3a shows strong Ag signals (Fig. 3b). The Ga signal originates from the ion source for milling, and the Pt signal from the sputter coating of the sample. The tabulated result presented in the inset of Fig. 3b provides a semi-quantitative comparison of the elemental composition in the lumen in units of weight percent and atomic percent. Since the sample was mounted onto carbon tape, the percentage amount of Ag was compared with that of oxygen. The weight percent of Ag is about 25 times greater, and its atomic percent is more than three times greater than the respective percentages of oxygen. The color-coded element map for carbon, oxygen, and Ag clearly shows the higher density of Ag in the lumen (Fig. 3c). The map constructed for a single element of Ag shows the presence of Ag in other parts of the fiber as well, such as the cuticle, primary cell wall and secondary cell wall (Fig. 3d).
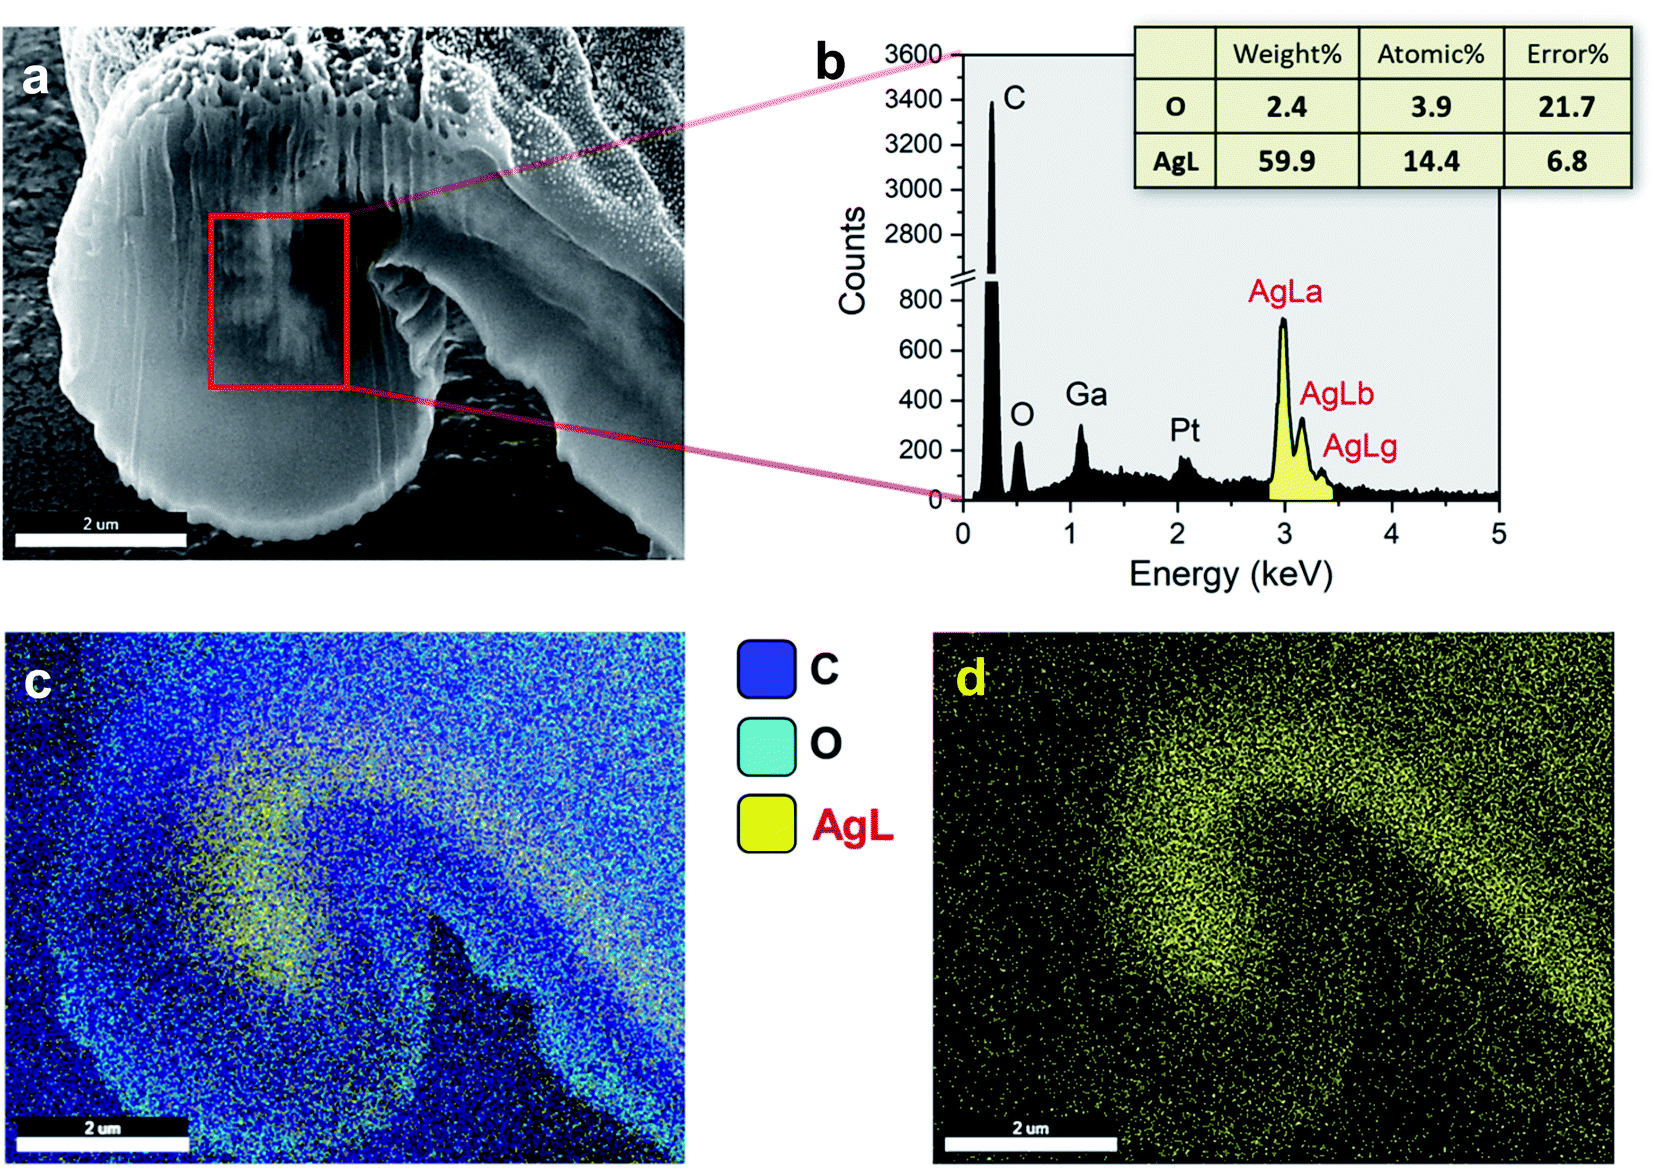 | ||
| Fig. 3 (a) FE-SEM image of the cross section of the Ag NP-filled brown cotton fiber. (b) EDS spectrum taken at the area highlighted by a red rectangle in (a). The inset shows the elemental composition in the inspection field in units of both weight percent and atomic percent. (c) Corresponding color-coded map of C, O, and Ag element distributions. (d) Element map of Ag. | ||
3.2. Thermal decomposition
The effect of internally formed Ag NPs on the thermal decomposition of cotton cellulose was examined by TG/DTG analysis. Fig. 4a and b show the TG and DTG thermograms for control brown cotton and Ag NP-filled brown cotton under a nitrogen environment at a heating rate of 10 °C min−1. The corresponding thermal decomposition parameters are summarized in Table 1. Control brown cotton exhibited a three-stage weight loss: (1) loss of moisture at about 100 °C, (2) decomposition of cellulose at about 310–380 °C and (3) decomposition of char above 380 °C. The insertion of Ag NPs lowered the onset decomposition of cellulose by about 20 °C (To = 288 °C as compared with 309 °C for control cotton). In the DTG thermogram, both control and Ag NP-filled brown cottons exhibited a single peak. This peak temperature at the maximum decomposition rate (Tm) shifted to an 18 °C lower temperature (from 358 °C to 340 °C) after the in situ synthesis of Ag NPs. The thermal decomposition of cellulose for Ag NP-filled cotton also ended at a temperature 12 °C lower than that of control cotton. Moreover, the presence of Ag NPs increasingly facilitated the weight loss over the thermal decomposition, resulting in reduction in char yield. The char yields measured at 700 °C were 14.6% for Ag NP-filled brown cotton and 20.4% for control brown cotton.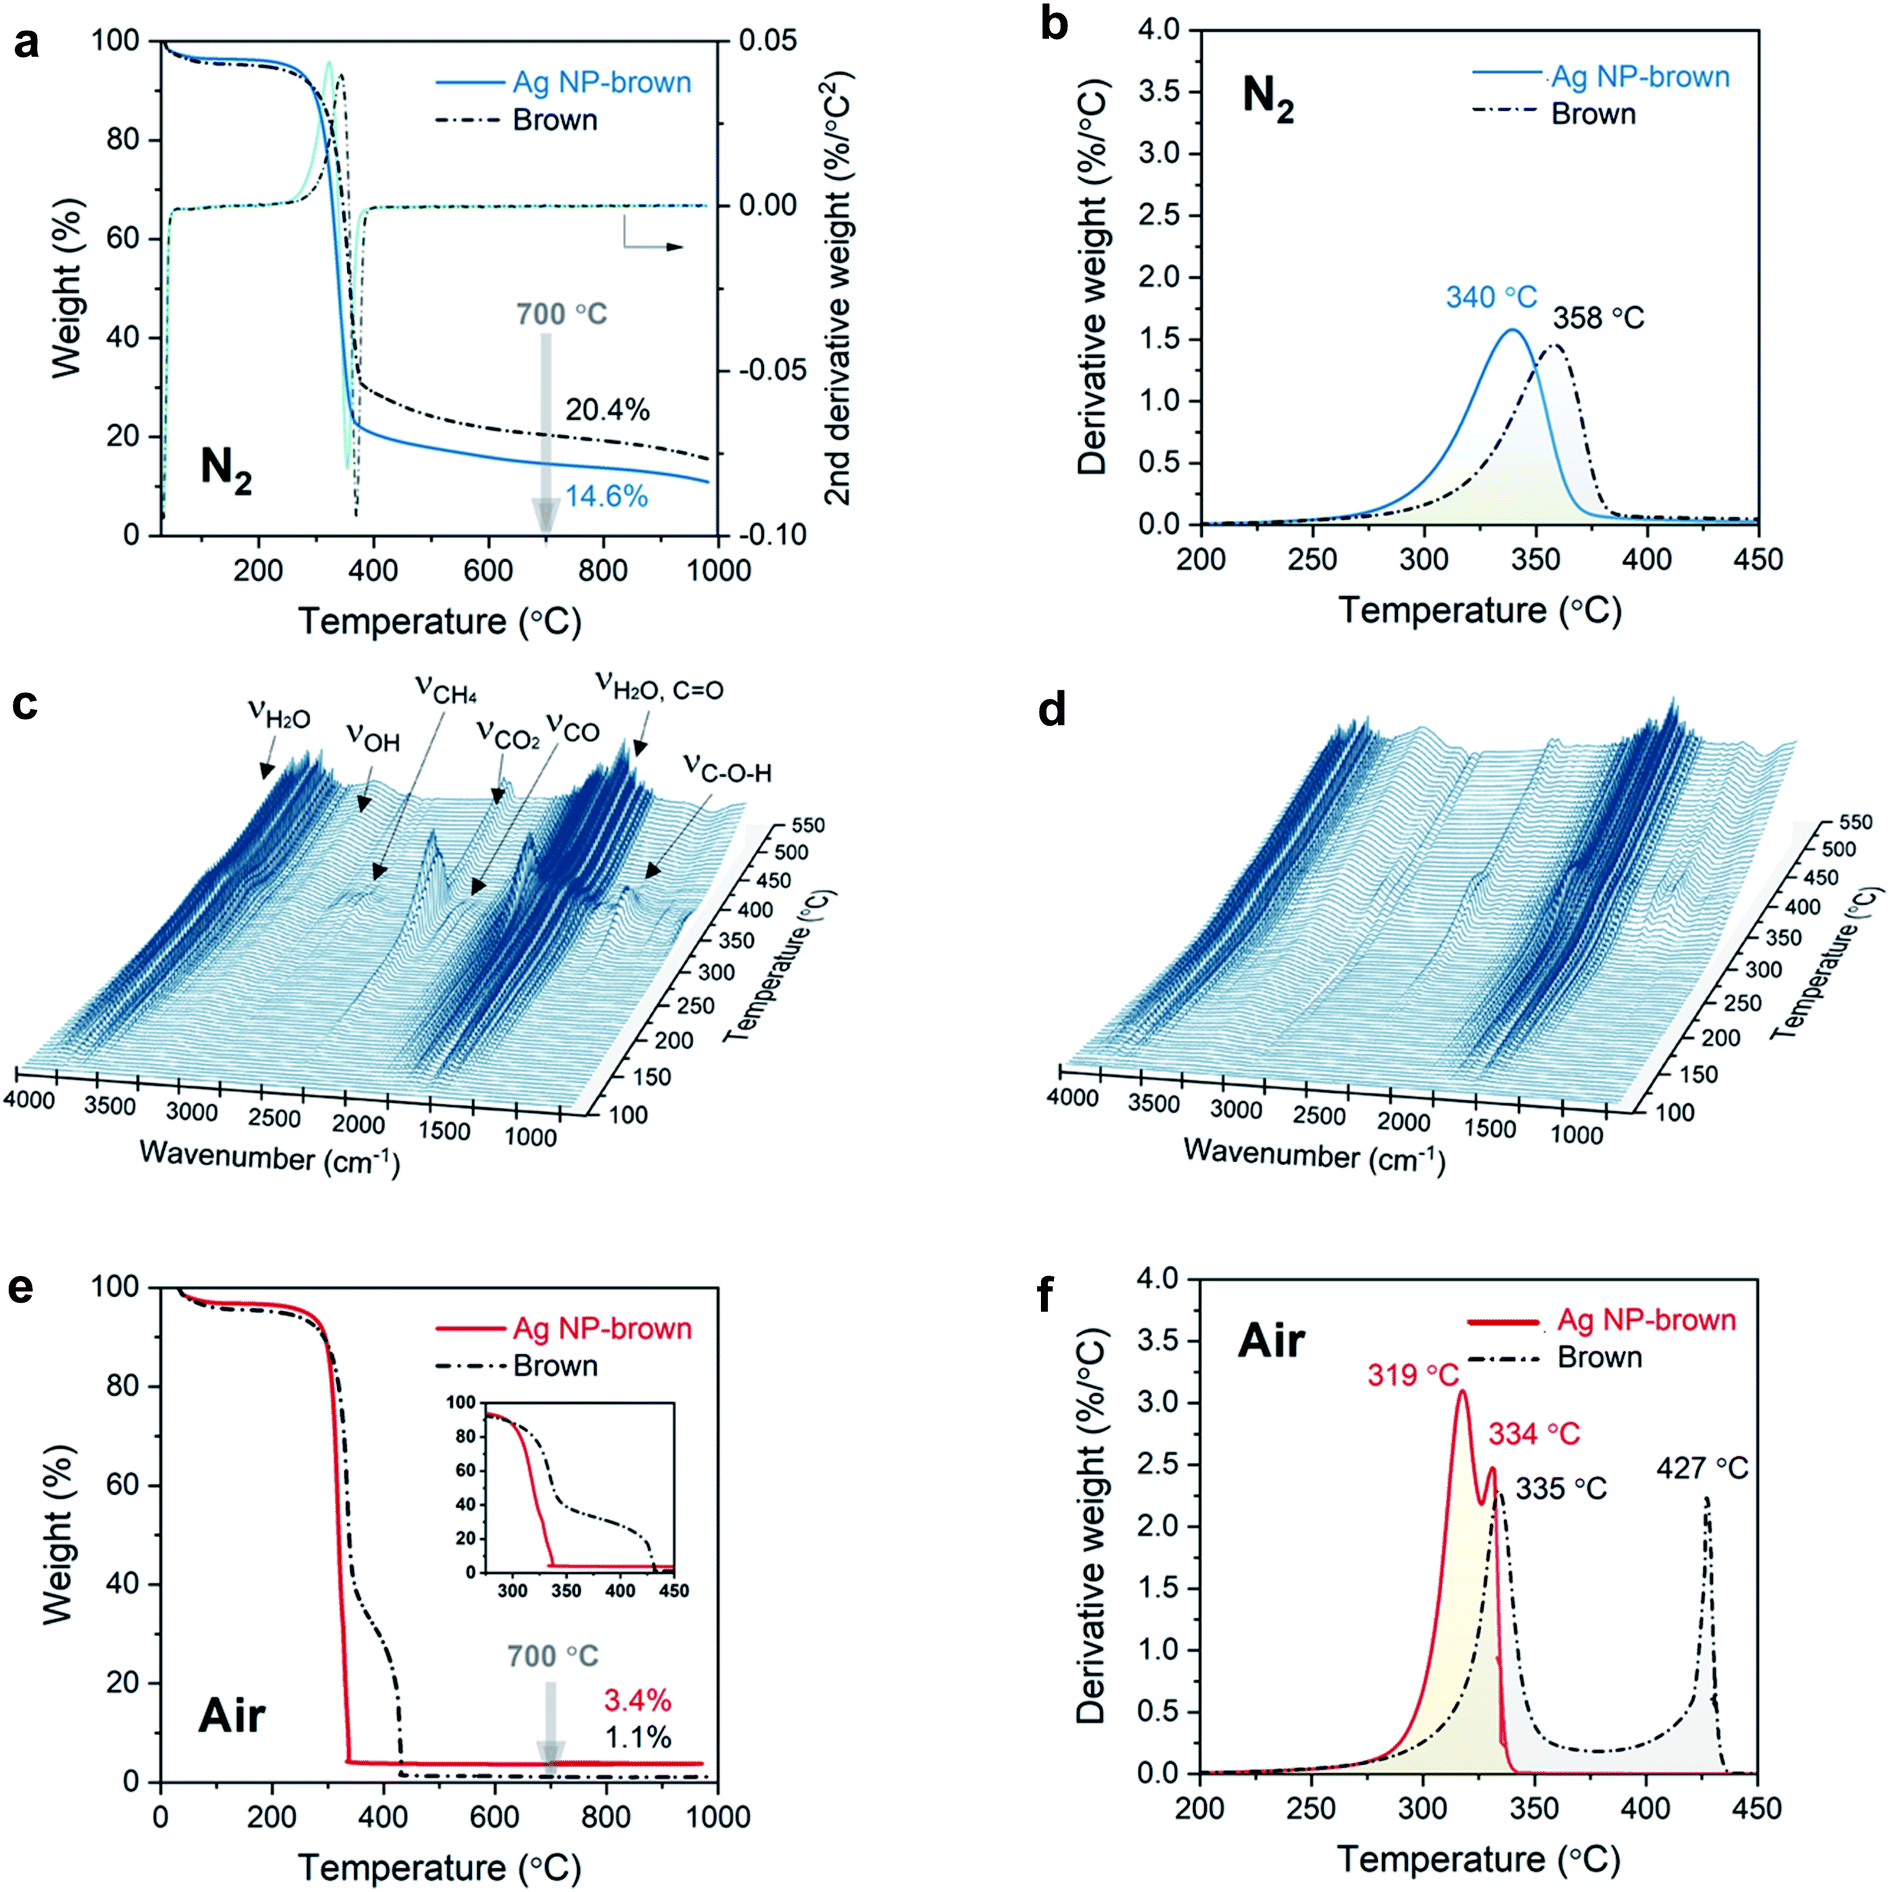 | ||
| Fig. 4 (a) TG and (b) DTG thermograms for brown cotton and Ag NP-filled brown cotton obtained under a nitrogen environment at a heating rate of 10 °C. The corresponding 3D FTIR spectra for the thermal decomposition of (c) brown cotton and (d) Ag NP-filled brown cotton. (e) TG and (f) DTG thermograms obtained under an air environment at a heating rate of 10 °C. | ||
| T o (°C) | WLo (%) | T m (°C) | WLm (%) | T e (°C) | WLe (%) | Charb (%) | ||
|---|---|---|---|---|---|---|---|---|
| a T: temperature; WL: weight loss; o: onset decomposition; m: maximum decomposition rate; e: end decomposition. b Char yield measured at 700 °C. c Standard deviation of five measurements. | ||||||||
| N2 | Brown | 309.1 (1.1)c | 11.6 (0.5) | 358.3 (0.6) | 47.9 (0.4) | 383.0 (1.1) | 69.8 (0.4) | 20.4 (0.5) |
| Ag NP-brown | 288.3 (0.9) | 8.0 (0.5) | 339.8 (0.4) | 49.1 (0.8) | 370.6 (1.1) | 76.9 (1.0) | 14.6 (0.6) | |
| Air | Brown | 319.0 (1.2) | 19.8 (0.8) | 334.9 (0.7) | 41.2 (0.9) | 433.4 (1.2) | 98.5 (0.8) | 3.4 (0.4) |
| Ag NP-brown | 299.7 (1.0) | 13.4 (0.6) | 318.9 (0.9) | 46.2 (1.1) | 340.5 (0.8) | 96.3 (0.7) | 1.1 (0.3) | |
The gaseous products that evolved during the thermal decomposition process under a nitrogen environment were detected by FTIR spectroscopy. Fig. 4c and d show 3D FTIR spectra with the coordinates of absorbance, wavenumber, and temperature for control cotton and Ag NP-filled brown cotton, respectively. The control brown cotton primarily evolved pyrolytic water (3741, 3650, 1512 cm−1), methane (2971, 2892, 2821, 2726 cm−1), carbon dioxide (2356, 2320 cm−1), carbon monoxide (2181, 2102 cm−1), aldehydes or ketones (1751 cm−1), and alcohols (1105 cm−1). In line with the weight-loss pattern (Fig. 4a) the concentrations of these products reached maxima at about 360 °C corresponding to Tm. These gaseous products are produced from the dehydration of cellulose followed by the decomposition of the dehydrocellulose.35 Cotton cellulose undergoes two competitive chemical pathways—dehydration and depolymerization—during pyrolysis.36–38 Dehydration is a moderate thermal process, contributing to the charring process, whereas depolymerization is a more drastic “unzipping” thermal reaction occurring at relatively high temperatures, contributing to cellulose decomposition.39 Compared with control cotton, Ag NP-filled cotton evolved less gaseous products, indicating that Ag NPs suppress the dehydration of cellulose. This is also supported by the reduced char yield for Ag NP-filled brown cotton.
The noticeable effect of Ag NPs on the thermal decomposition behavior of cotton cellulose was also observed under an oxygen environment (Fig. 4e and f). The inset of Fig. 4e shows that Ag NP-filled brown cotton started to decompose at a lower temperature than control brown cotton (300 °C vs. 319 °C). Unlike under a nitrogen environment, the char thermally decomposed rapidly under an air environment. In the DTG thermogram, an additional peak corresponding to the decomposition of char was detected. For control brown cotton, the DTG peak temperatures for cellulose and char were separated by 92 °C. These two peaks coalesced for Ag NP-filled brown cotton, yielding a 15 °C difference in peak temperatures. In the presence of Ag NPs, the char immediately decomposed as soon as it was formed from the decomposition of cellulose. Resulting from the decomposition of the char, almost all of the sample was consumed, i.e., char yields at 700 °C were 1.1% and 3.4% for control and Ag NP-cottons, respectively.
3.3. Thermal decomposition kinetics
A kinetic analysis of the thermal decomposition behaviors of control brown and Ag NP-filled brown cottons was conducted using the isoconversional Friedman method.22Fig. 5a and b show typical dependences of the conversion of reaction (α) and conversion rate on temperature for control brown cotton, respectively. Similar dependences were also observed for Ag NP-filled cotton. The thermal reactions for both samples decelerated when α was close to 0 and 1, and its rate reached the maximum at the intermediate extent of conversion. As the heating rate increased, the α shifted to higher temperature. Fig. 5c shows the plots of the natural logarithm of reaction rate as a function of the reciprocal temperature at incremental α values for control brown cotton. The straight lines observed for all α values signify the validity of the differential method. The analysis was conducted with a 0.0001 interval of α, and some were selected and presented. Using eqn (7), the activation energy (Ea) for the thermal decomposition was calculated from the slope of the straight line (–Ea(α)/R). The correlation coefficients of the linear relationship were all greater than 0.99 for α = 0.1–0.9 (Fig. 5d). Fig. 5d also shows the plots of Ea as a function of α for control brown cotton and Ag NP-filled brown cotton. The Ea for control brown cotton was relatively steady over the course of α, whereas the Ea for Ag NP-filled brown cotton decreases with increasing α. Ag NP-filled cotton required greater Ea to initiate the thermal reaction than control brown cotton. However, the Ea for Ag NP-filled brown cotton became lower than the Ea for control brown cotton as α increased above about 0.5. As a result, their average Ea values obtained from α = 0.1–0.9 were not significantly different (p value = 0.24). The Ea for Ag NP-filled brown cotton was 184 kJ mol−1, and the Ea for control brown cotton was 180 kJ mol−1.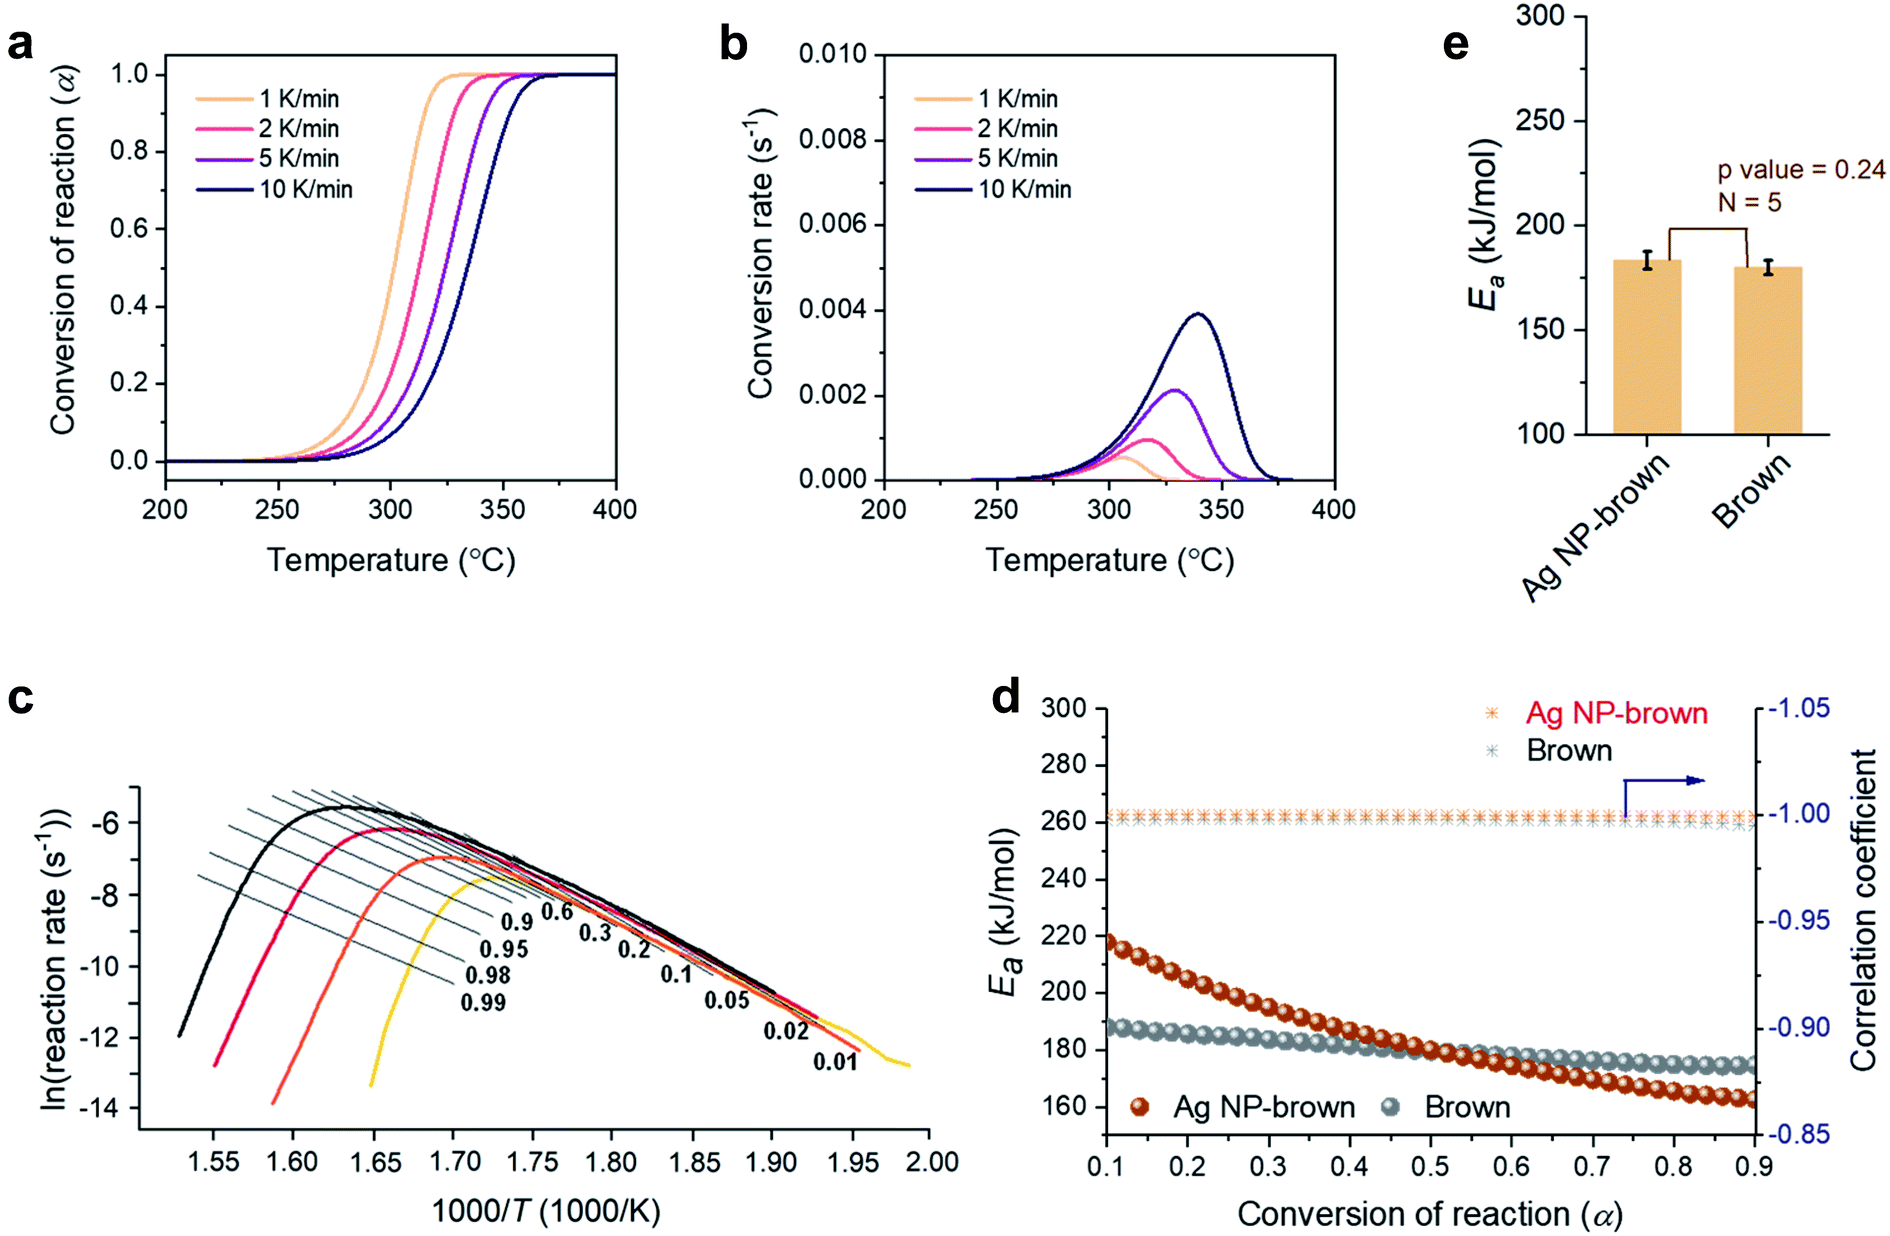 | ||
| Fig. 5 Thermal decomposition kinetics under a nitrogen environment: (a) conversion of reaction and (b) conversion rate as a function of temperature at incremental heating rates and (c) differential isoconversional analysis for the thermal decomposition of brown cotton. (d) Plots of activation energies (Ea) and correlation coefficients as a function of the conversion of the reaction for brown cotton and Ag NP-filled brown cotton. (e) Average activation energies for brown cotton and Ag NP-filled brown cotton. | ||
Fig. 6a–e show a kinetic analysis of the thermal decomposition of brown cotton cellulose under an air environment. The dependences of α and conversion rate on temperature under an air environment were greater than those under a nitrogen environment for both control brown cotton and Ag NP-filled brown cotton. The Ea for control brown cotton and Ag NP-filled brown cotton exhibited distinctive patterns of variation as a function of α. For control brown cotton, an increasing trend of Ea appeared up to α ≈ 0.4, but the Ea diminished afterwards. The opposite trend was observed for Ag NP-brown cotton, i.e., the Ea increased above α ≈ 0.4. Over the entire course of α, the Ea for Ag NP-filled cotton was higher than the Ea for control cotton. The average Ea for Ag NP-filled brown cotton (263 kJ mol−1) was significantly greater than that for control brown cotton (199 kJ mol−1) (p = 4.3 × 10⁻⁵).
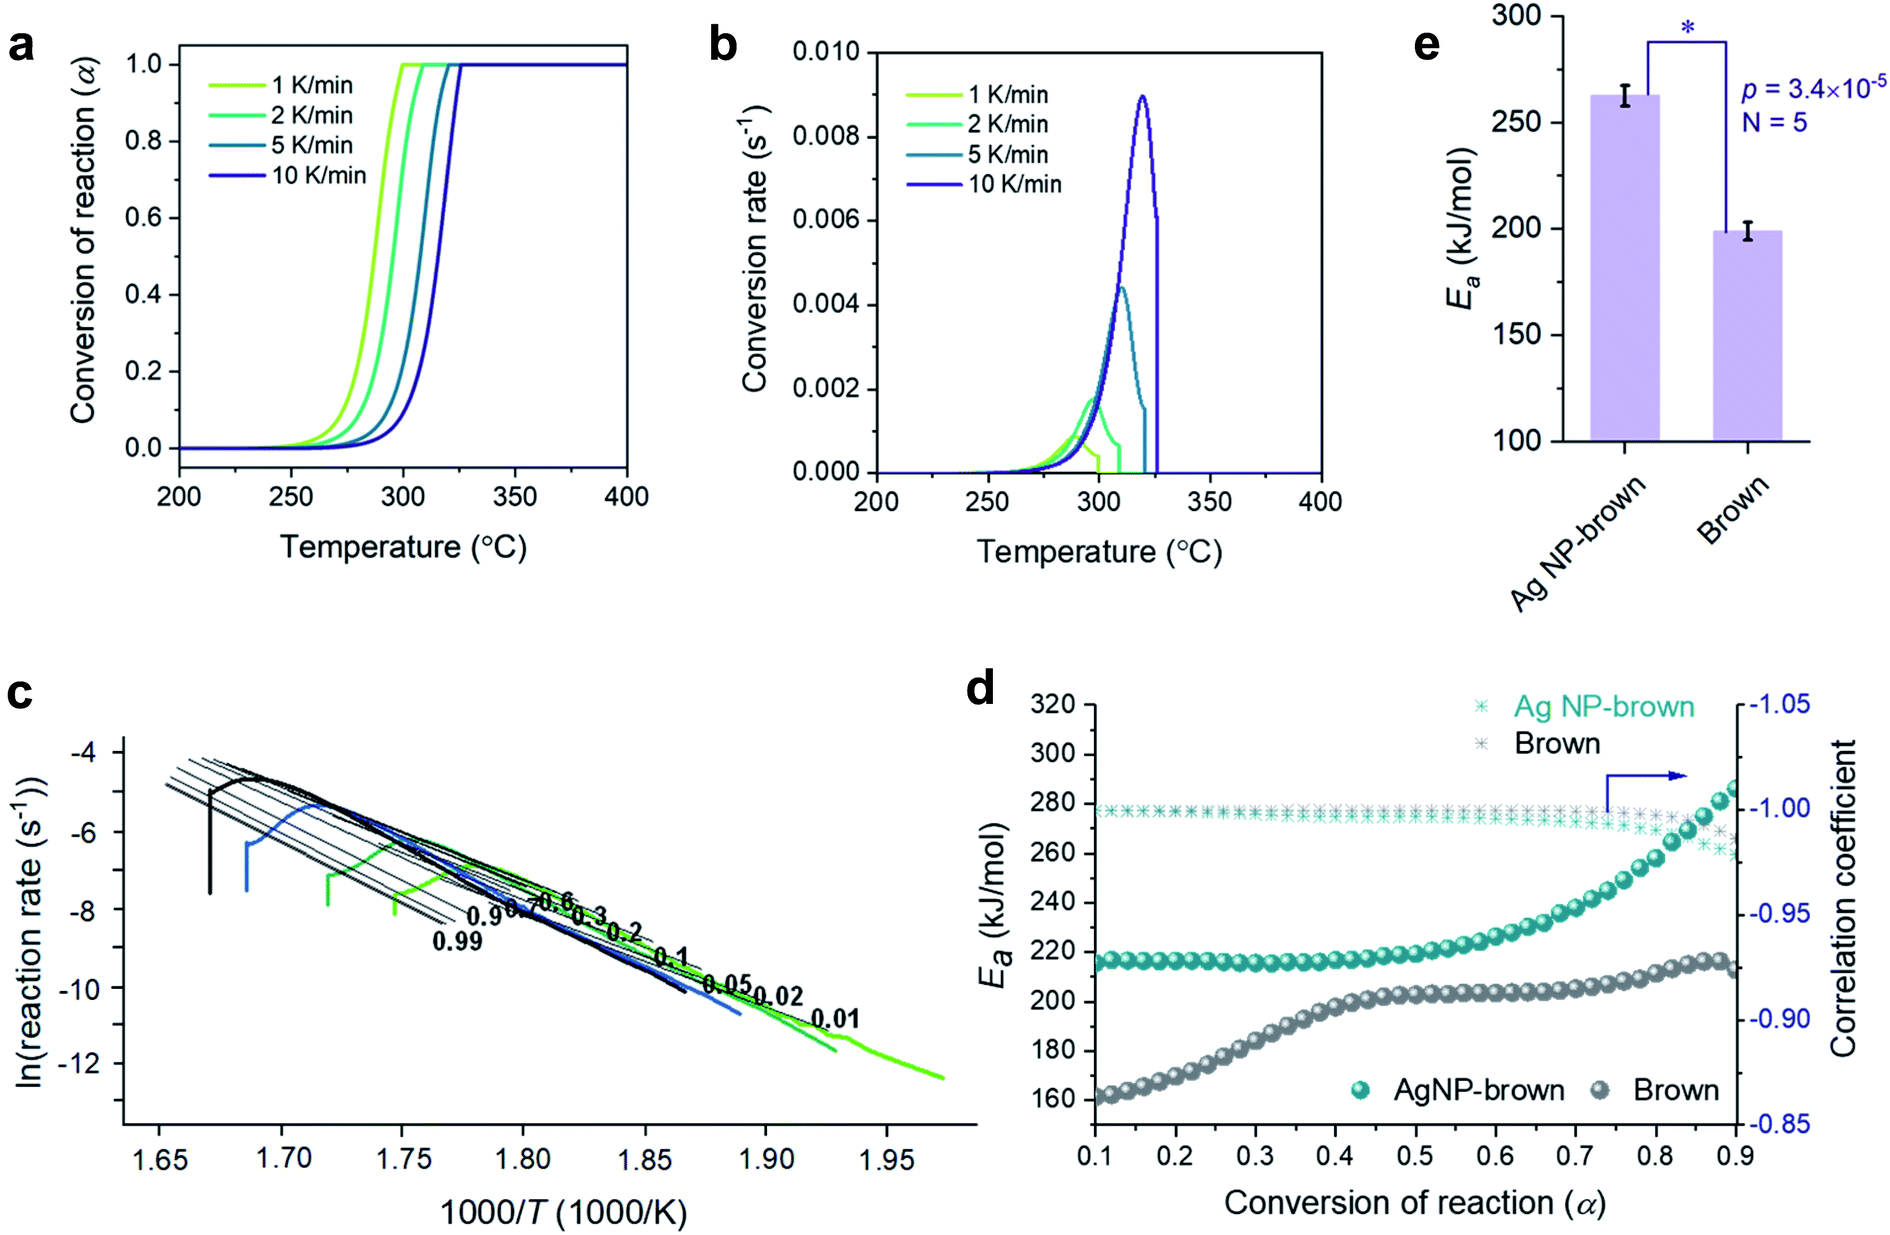 | ||
| Fig. 6 Thermal decomposition kinetics under an air environment: (a) conversion of reaction and (b) conversion rate as a function of temperature at incremental heating rates and (c) differential isoconversional analysis for Ag NP-filled brown cotton. (d) Plots of activation energies (Ea) and correlation coefficients as a function of the conversion of the reaction for brown cotton and Ag NP-filled brown cotton. (e) Average activation energies for brown cotton and Ag NP-filled brown cotton. | ||
MCC simulates combustion by pyrolyzing a sample at a constant heating rate followed by oxidation of gases released from the furnace. Table 2 presents MCC parameters, including HRC, PHRR, TPHRR, THR, and char yield for control brown cotton and Ag NP-filled brown cotton. After filling the fiber with Ag NPs, the HRC and PHRR of brown cotton increased by about 13%. In accordance with the TGA result, the peak of specific heat release rate with respect to temperature shifted to a lower temperature (Fig. 7a). TPHRR values for control brown and Ag NP-filled brown cotton were 381 °C and 356 °C, respectively. During pyrolysis, Ag NP-filled brown cotton released more heat at lowered temperature. Ag NPs with a higher thermal conductivity transferred heat effectively throughout the cellulose medium. The altered thermal response of cotton cellulose can be further supported by fiber surfaces observed by SEM (Ag NP-filled brown cotton and control cotton in Fig. 7b and c, respectively). At the same temperature of 235 °C under an air environment, Ag NP-filled cotton fibers were consumed more than control cotton. The surface of Ag NP-filled cotton fibers became rougher, and many small holes were generated.
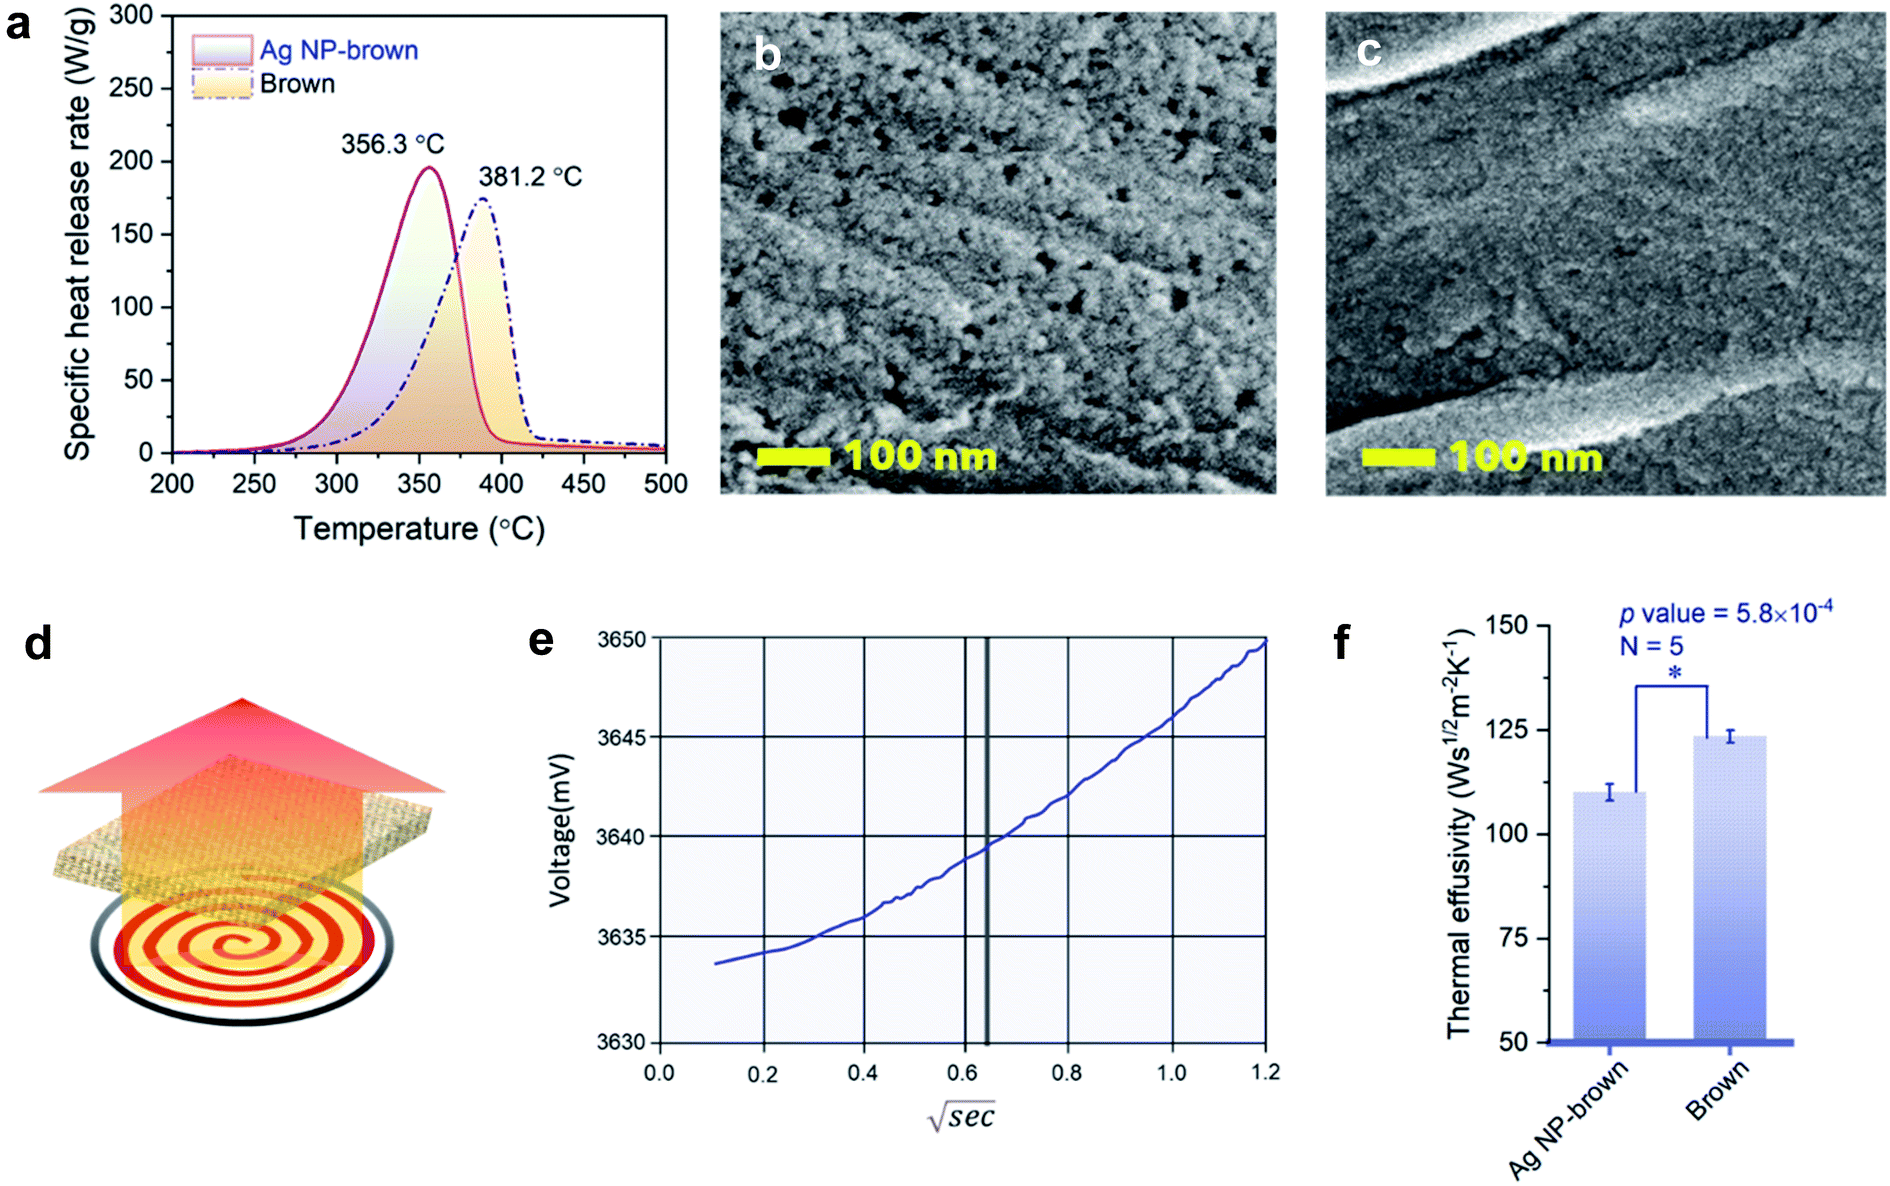 | ||
| Fig. 7 (a) Specific heat release rate versus temperature for control brown and Ag NP-filled brown cotton nonwoven fabrics. SEM images of (b) control brown and (c) Ag NP-filled brown cotton fibers heated up to 235 °C at a heating rate of 10 °C under an air environment. Thermal effusivity: (d) schematic of measurement, (e) typical plot of the sensor's voltage versus the square root of time for a brown cotton nonwoven fabric, and (f) thermal effusivity values for control brown and Ag NP-filled brown cotton nonwoven fabrics. | ||
3.4. Thermal effusivity
Thermal effusivity describes the ability of a material to exchange heat with its surroundings. It was designed to quantify the ability of human skin to detect differences in a material's ability to transfer heat, such as a warm feel or a cool touch. As shown by the schematic in Fig. 7d, thermal effusivity is measured by placing a sample on a one-sided, interfacial heat reflectance sensor coil, to which a known current is applied as a momentary constant heat source, and monitoring the sensor's voltage. Fig. 7e shows a typical plot of voltage change over the square root of time for a brown cotton nonwoven fabric. The sensor's guard ring supports a one-dimensional heat exchange between the sensor coil and the sample. The smaller the thermal effusivity the lower the heat transfer. The thermal effusivities for control brown and Ag NP-filled brown cotton were determined to be 124 and 110 W s1/2 m−2 K−1, respectively. Their difference was significantly different (p value = 5.8 × 10⁻⁴), signifying that Ag NP-filled brown cotton feels warmer than control brown cotton.The enhanced heat transfer of brown cotton by embedding Ag NPs was demonstrated by monitoring the temperatures of the fabrics under different heat treatments using an IR thermal analyzer. Fig. 8a–c show the results obtained after the fabrics were vertically placed onto a hot plate, whose temperature was increased from about 22 °C to 70 °C. When the heating time was above about 50 s, the average temperature of the Ag NP-filled fabric exceeded that of the control fabric (Fig. 8a). Consistently, the thermal IR images of control and Ag NP-filled cottons (Fig. 8b and c, respectively) taken when the hot plate's temperature reached 56 °C show a higher temperature gradient on the Ag NP-filled cotton fabric than on the control fabric. Fig. 8d shows the result obtained from the microwave irradiation of the fabrics. The average temperature of Ag NP-filled brown cotton was significantly higher than that of control brown cotton (p value = 0.006).
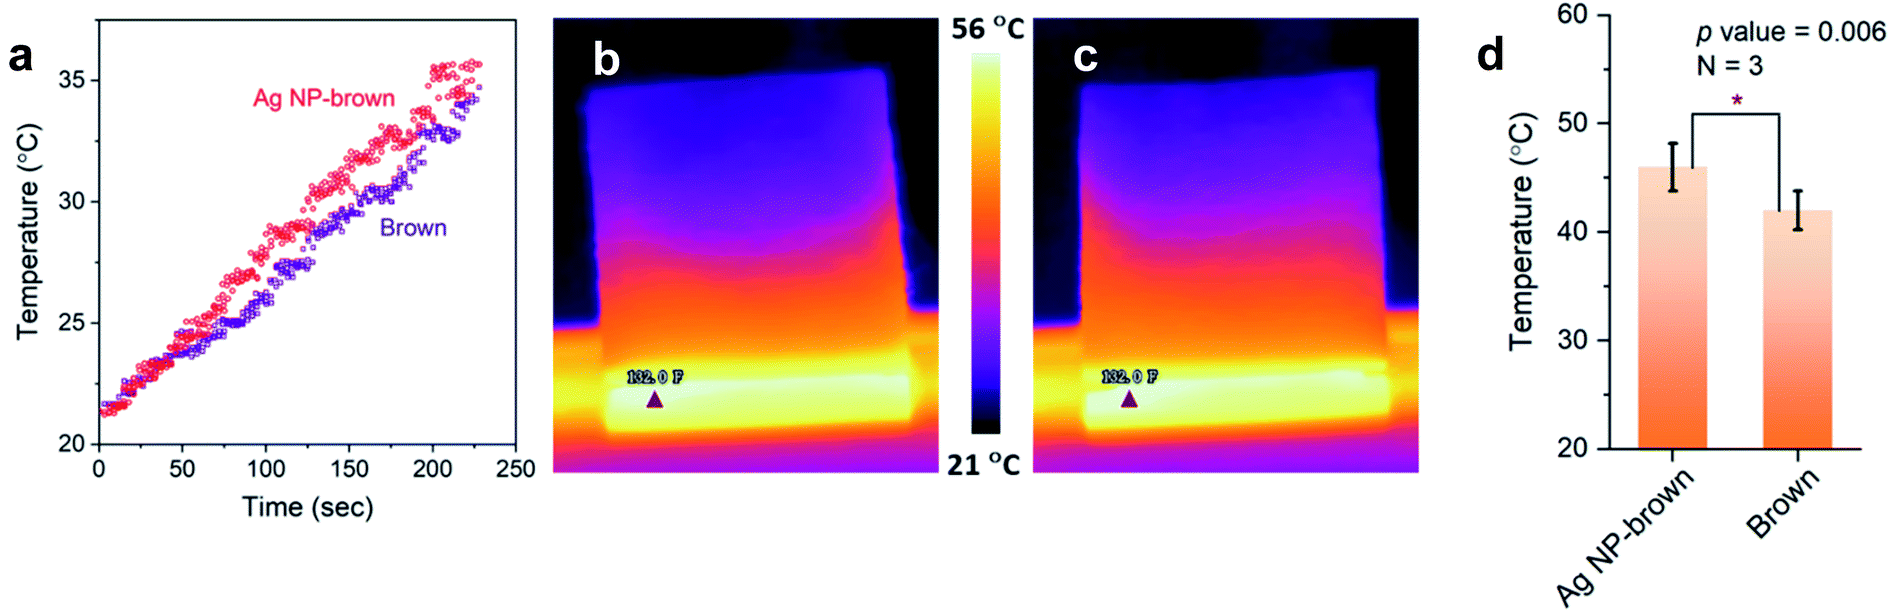 | ||
| Fig. 8 (a) Average temperatures of control brown and Ag NP-filled brown cotton nonwoven fabrics which were vertically placed on a hot plate, measured by an IR thermal analyzer, as a function of heating time. Thermal IR images of (b) control brown and (c) Ag NP-filled brown cotton fabrics taken when the hot plate temperature reached 56 °C. (d) Average temperatures of control brown and Ag NP-filled brown cotton fabrics after microwave irradiation. | ||
4. Conclusion
This study demonstrated that filling brown cotton fibers with a small amount of Ag NPs (12500 mg kg−1 based on the dry weight of the fibers) altered the thermal properties of brown cotton. The condensed tannins, a natural component responsible for the color of brown cotton, acted as a reducing agent, allowing brown cotton to produce Ag NPs without the use of any external reducing and stabilizing agents. The Vis/NIR reflectance and fluorescence hyperspectral images showed the uniformity of the in situ synthesis of Ag NPs throughout the nonwoven fabric. The internal dispersion of individual Ag NPs about 28 nm in diameter was confirmed by imaging and analyzing the cross-section of fibers. Ag NPs were concentrated in the lumen of the fibers. Ag NPs present within the brown cotton fibers facilitated the heat transfer throughout the fibers, lowering the temperature of thermal decomposition for cellulose under both nitrogen and air environments. In an air environment, Ag NP-filled brown cotton required a greater activation energy for the thermal decomposition than control cotton. Ag NPs improved the thermal effusivity of brown cotton, causing its fabric to have a warmer feel, and improved the thermal response of the fabric under heat treatments.
Conflicts of interest
The authors declare no competing financial interests. The USDA is an equal opportunity provider and employer.References
- S. N. Raja, A. C. K. Olson, K. Thorkelsson, A. J. Luong, L. Hsueh, G. Q. Chang, B. Gludovatz, L. W. Lin, T. Xu, R. O. Ritchie and A. P. Alivisatos, Tetrapod nanocrystals as fluorescent stress probes of electrospun nanocomposites, Nano Lett., 2013, 13(8), 3915–3922 CrossRef CAS PubMed.
- J. Ren, W. Y. Bai, G. Z. Guan, Y. Zhang and H. S. Peng, Flexible and weaveable capacitor wire based on a carbon nanocomposite fiber, Adv. Mater., 2013, 25(41), 5965–5970 CrossRef CAS PubMed.
- A. T. Chien, B. A. Newcomb, D. Sabo, J. Robbins, Z. J. Zhang and S. Kumar, High-strength superparamagnetic composite fibers, Polymer, 2014, 55, 4116–4124 CrossRef CAS.
- G. Zhou, Y. Q. Wang, J. H. Byun, J. W. Yi, S. S. Yoon, H. J. Cha, J. U. Lee, Y. Oh, B. M. Jung, H. J. Moon and T. W. Chou, High-strength single-walled carbon nanotube/permalloy nanoparticle/poly(vinyl alcohol) multifunctional nanocomposite fiber, ACS Nano, 2016, 9, 11414–11421 CrossRef PubMed.
- R. Stone, S. Hipp, J. Barden, P. J. Brown and O. T. Mefford, Highly scalable nanoparticle–polymer composite fiber via wet spinning, J. Appl. Polym. Sci., 2013, 130, 1975–1980 CrossRef CAS.
- Q. Hu, H. Wu, L. Zhang, H. Fong and M. Tian, Rubber composite fibers containing silver nanoparticles prepared by electrospinning and in-situ chemical crosslinking, eXPRESS Polym. Lett., 2012, 6(4), 258–265 CrossRef CAS.
- F. M. Kelly and J. H. Johnston, Colored and functional silver nanoparticle-wool fiber composites, ACS Appl. Mater. Interfaces, 2011, 3, 1083–1092 CrossRef CAS PubMed.
- E. L. Mayes, F. Vollrath and S. Mann, Fabrication of magnetic spider silk and other silk-fiber composites using inorganic nanoparticles, Adv. Mater., 1998, 10, 801–805 CrossRef CAS.
- Y. Zheng, C. Cai, F. Zhang, J. Monty, R. J. Linhardt and T. J. Simmons, Can natural fibers be a silver bullet? Antibacterial cellulose fibers through the covalent bonding of silver nanoparticles to electrospun fibers, Nanotechnology, 2016, 27, 055102 CrossRef PubMed.
- T. Benn, B. Cavanagh, K. Hristovski, J. D. Posner and P. Westerhoff, The release of nanosilver from consumer products used in the home, J. Environ. Qual., 2010, 39, 1875–1882 CrossRef CAS PubMed.
- L. Geranio, M. Heuberger and B. Nowack, The behavior of silver nano textiles during washing, Environ. Sci. Technol., 2009, 43, 8113–8118 CrossRef CAS PubMed.
- C. Lorenz, L. Windler, N. von Goetz, R. P. Lehmann, M. Schuppler, K. Hungerbühler, M. Heuberger and B. Nowack, Characterization of silver release from commercially available functional (nano)textiles, Chemosphere, 2012, 89, 817–824 CrossRef CAS PubMed.
- A. C. Balazs, T. Emrick and T. P. Russell, Nanoparticle polymer composites: where two small worlds meet, Science, 2006, 314, 1107–1110 CrossRef CAS PubMed.
- Z. P. Lv, Z. Z. Luan, H. Y. Wang, S. Liu, C. H. Li, D. Wu, J. L. Zuo and S. H. Sun, Tuning electron-conduction and spin transport in magnetic iron oxide nanoparticle assemblies via tetrathiafulvalene-fused ligands, ACS Nano, 2015, 9(12), 12205–12213 CrossRef CAS PubMed.
- L. Li, S. Chakrabarty, J. Jiang, B. Zhang, C. Ober and E. P. Giannelis, Solubility studies of inorganic-organic hybrid nanoparticle photoresists with different surface functional groups, Nanoscale, 2016, 8, 1338–1343 RSC.
- Y. Zheng, J. Miao, N. Maeda, D. Frey, R. J. Linhardt and T. J. Simmons, Uniform nanoparticle coating of cellulose fibers during wet electrospinning, J. Mater. Chem. A, 2014, 2, 15029–15034 RSC.
- A. P. S. Sawhney, B. Condon, M. Reynolds, R. Slopek and D. Hui, Advent of greige cotton nonwovens made using a hydro-entanglement process, Text. Res. J., 2010, 80, 1540–1549 CrossRef CAS.
- D. P. Thibodeaux and J. P. Evans, Cotton fiber maturity by image analysis, Text. Res. J., 1986, 56, 130–139 CrossRef.
- E. K. Boylston, O. Hinojosa and J. J. Hebert, A quick embedding method for light and electron microscopy of textile fibers, Biotech. Histochem., 1991, 66(3), 122–124 CrossRef CAS PubMed.
- C. A. Schneider, W. S. Rasband and K. W. Eliceiri, NIH Image to ImageJ: 25 years of image analysis, Nat. Methods, 2012, 9, 671–675 CrossRef CAS PubMed.
- M. S. Kim, Y. R. Chen and P. M. Mehl, Hyperspectral reflectance and fluorescence imaging system for food quality and safety, Trans. ASAE, 2001, 44, 721–729 Search PubMed.
- H. L. Friedman, Kinetics of thermal degradation of char-forming plastics from thermogravimetry application to phenolic plastic, J. Polym. Sci., Part C: Polym. Symp., 1964, 6, 183–195 CrossRef.
- G. Hustvedt and P. C. Crews, The ultraviolet protection factor of naturally-pigmented cotton, J. Cotton Sci., 2005, 9, 47 CAS.
- S. Hua, X. Wang, S. Yuan, M. Shao, X. Zhao, S. Zhu and L. Jiang, Characterization of pigmentation and cellulose synthesis in colored cotton fibers, Crop Sci., 2007, 47, 1540–1546 CrossRef CAS.
- Y. H. Xiao, Z. S. Zhang, M. H. Yin, M. Luo, X. B. Li, L. Hou and Y. Pei, Cotton flavonoid structural genes related to the pigmentation in brown fibers, Biochem. Biophys. Res. Commun., 2007, 358, 73–78 CrossRef CAS PubMed.
- T. Li, H. Fan, Z. Li, J. Wei, Y. Lin and Y. Cai, The accumulation of pigment in fiber related to proanthocyanidins synthesis for brown cotton, Acta Physiol. Plant., 2012, 34, 813–818 CrossRef CAS.
- E. Bulut and M. Özacar, Rapid, facile synthesis of silver nanostructure using hydrolyzable tannin, Ind. Eng. Chem. Res., 2009, 48, 5686–5690 CrossRef CAS.
- S. Nam, B. Park and B. D. Condon, Water-based binary polyol process for the controllable synthesis of silver nanoparticles inhibiting human and foodborne pathogenic bacteria, RSC Adv., 2018, 8, 21937–21947 RSC.
- S. Nam, D. V. Parikh, B. Condon, Q. Zhao and M. Yoshioka-Tarver, Importance of poly(ethylene glycol) conformation for the synthesis of silver nanoparticles in aqueous solution, J. Nanopart. Res., 2011, 13, 3755–3764 CrossRef CAS.
- S. Nam, G. W. Selling, M. B. Hillyer, B. D. Condon, M. S. Rahman and S. Chang, Brown cotton fibers self-produce Ag nanoparticles for regenerating their antimicrobial surfaces, ACS Appl. Nano Mater., 2021, 12, 13112–13122 CrossRef.
- S. Nam, B. D. Condon, C. D. Delhom and K. R. Fontenot, Silver-cotton nanocomposites: nano-design of microfibrillar structure causes morphological changes and increased tenacity, Sci. Rep., 2016, 6, 37320 CrossRef CAS PubMed.
- R. Zhang, C. Li, M. Zhang and J. Rodgers, Shortwave infrared hyperspectral reflectance imaging for cotton foreign matter classification, Computers and Electronics in Agriculture, 2016, 127, 260–270 CrossRef.
- G. R. Gamble and J. A. Foulk, Quantitative analysis of cotton (Gossypium hirsutum) lint trash by fluorescence spectroscopy, J. Agric. Food Chem., 2007, 55, 4940–4943 CrossRef CAS PubMed.
- A. Alqudami and S. Annapoorni, Fluorescence from metallic silver and iron nanoparticles prepared by exploding wire technique, Plasmonics, 2007, 2, 5–13 CrossRef CAS.
- F. J. Kilzer and A. Broido, Speculation on the nature of cellulose pyrolysis, Pyrodynamics, 1965, 2, 151–163 CAS.
- A. G. W. Bradbury, Y. Sakai and F. Shafizadeh, Kinetic-model for pyrolysis of cellulose, J. Appl. Polym. Sci., 1979, 23(11), 3271–3280 CrossRef CAS.
- M. J. Antal, H. L. Friedman and F. E. Rogers, Kinetics of cellulose pyrolysis in nitrogen and steam, Combust. Sci. Technol., 1980, 21(3–4), 141–152 CrossRef CAS.
- D. Radlein, J. Piskorz and D. S. Scott, Fast pyrolysis of natural polysaccharides as a potential industrial process, J. Anal. Appl. Pyrolysis, 1991, 19, 41–63 CrossRef CAS.
- A. Basch and M. Lewin, The influence of fine structure on the pyrolysis of cellulose. I. Vacuum pyrolysis, J. Polym. Sci., 1973, 11(12), 3071–3093 CAS.
| This journal is © The Royal Society of Chemistry 2022 |