 Open Access Article
Revealing the structure and organization of intercellular tunneling nanotubes (TNTs) by STORM imaging†
Lilin
Huang‡
,
Jiao
Zhang‡
,
Zekai
Wu
,
Liangliang
Zhou
,
Bin
Yu
,
Yingying
Jing
*,
Danying
Lin
 * and
Junle
Qu

Shenzhen Key Laboratory of Photonics and Biophotonics, Key Laboratory of Optoelectronic Devices and Systems of Ministry of Education and Guangdong Province, College of Physics and Optoelectronic Engineering, Shenzhen University, Shenzhen 518060, P. R. China. E-mail: dylin@szu.edu.cn; yyjing@szu.edu.cn
First published on 8th September 2022
Abstract
Tunneling nanotubes (TNTs) are nanoscale, actin-rich, transient intercellular tubes for cell-to-cell communication, which transport various cargoes between distant cells. The structural complexity and spatial organization of the involved components of TNTs remain unknown. In this work, the STORM super-resolution imaging technique was applied to elucidate the structural organization of microfilaments and microtubules in intercellular TNTs at the nanometer scale. Our results reveal different distributions of microfilaments and intertwined structures of microtubules in TNTs, which promote the knowledge of TNT communications.
Cell–cell communications are critical cellular activities which occur through diverse mechanisms, such as synapses,1 gap junctions,2 filopodial bridges3 and tunneling nanotubes (TNTs).4 The TNT structure was first described in 2004 and found to be an important pathway for cellular communication by direct intercellular connection.5 TNTs are defined as membrane protrusions and connect two or more cells. They are usually enriched in actin and microtubules and hover over the substrate, which can be used to transport organelles, small molecules and other substances.6 TNTs are generally divided in two categories, “thin TNTs” and “thick TNTs”. Thin TNTs have diameters in the range of 20–700 nm, while thick TNTs are wider and can extend up to 250 μm in length.4 Over the last decade, scientific researchers have described the vital biological functions of TNTs in numerous cell types.7 Moreover, recent studies have also highlighted the essential roles of TNTs in some diseases, such as neurodegenerative diseases, cancer diagnosis, immunology, and virology.8–11 Although TNTs are found to be involved in critical biological and pathological processes, the structural complexity of TNTs remains largely unknown. Revealing the spatial organization of the involved components of TNTs could promote the knowledge of their cellular functions and how they regulate disease.
Imaging techniques are pivotal for understanding the distribution and organization of cellular structures. Several imaging methods have been applied to visualize TNTs, including electron microscopy (EM) and multiple types of fluorescence microscopies (FM).12,13 However, the vital information from EM and FM is potentially limited due to complicated operations in EM imaging and the restricted resolution in FM imaging. Thus, the current uncertainty on these topics calls for new methods capable of directly visualizing TNTs at the nanometer scale in situ. Recently, super-resolution microscopy techniques, which surpass the diffraction limit, have enabled the visualization of cellular structures at unprecedented spatial resolution.14–24 Among these techniques, single-molecule-localization-based stochastic optical reconstruction microscopy (STORM) has wide applications in biological studies because of its outstanding spatial resolution and simple operation.18,20,25 STORM employs photoswitchable fluorescent dyes that can be switched between fluorescent states and dark states, and a super-resolution image is built through localizations from thousands of frames of sparse fluorescent images.18,26,27 Now, the STORM technique has become an attractive tool to provide insights into cellular structures and complex protein organizations at the molecular scale that were hitherto unattainable.28–30
Herein, we report the direct observation of TNTs by relying on the STORM imaging technique at the nanometer scale. Super-resolution imaging was employed for visualization of the distinct structure and distribution of microfilaments in different TNTs and to explore the spatial organization of microtubules in TNTs with three-dimensional (3D) STORM imaging. Moreover, the potential relationship between mitochondria distribution and TNT morphology was further studied, which was helpful in elucidating the delivery pattern of mitochondria in TNTs. This general approach of the STORM technique opens a myriad of possibilities for further investigation of TNTs.
TNTs are regarded as thin-long membranous structures that have diameters ranging from 20 to 700 nm in thin TNTs or over 700 nm in thick TNTs, and lengths spanning up to hundreds of microns.4 The diffraction limitation of conventional microscopy constrains its ability to provide high-resolution structural information on internal components within TNTs. Thus, to investigate the spatial structure and organization of TNTs precisely, we here exploited STORM in our experiments to image the detailed structure of TNTs at the nanometer scale. The STORM technique employs photoswitchable dyes which can be converted between a fluorescent state and a non-fluorescent state at different wavelengths or under different chemical conditions. The stochastic blinking of the probes allows us to capture the signals of single fluorescent molecules without overlap. After multiple cycles of excitation and detection, a super-resolution was generated by plotting the accumulation of the localizations from a sequence of images. We first evaluated the resolution of our home-built STORM system through determining the width of microtubules. As shown in Fig. S1A,† the wide-field image is blurred by diffraction. In contrast, the reconstructed STORM image demonstrates a notable clarity improvement in resolution. We then determined the resolution by measuring the full-width at half-maximum (FWHM) of the Gaussian profile. The results indicated that the resolution was 34 nm for our STORM imaging system (Fig. S1C†), which was almost ten times higher than that of traditional imaging (Fig. S1B†).
As mentioned above, the TNT was one type of actin-supported cellular protrusion, which has different types in different size ranges.4 To better understand the difference between TNTs of different types, we then utilized the STORM technique for imaging the microfilaments in TNTs of different sizes in different fields of view in BS-C-1 cells, which is a kind of common cell line for studying the structure and distribution of microfilaments and microtubules in cells.31–33 The microfilaments were immunolabeled with phalloidin, a toxin that binds to filamentous actin (F-actin), coupled with Alexa Fluor™ 647. Given the special structure of TNTs, we first optimized the permeabilization time as shown in Fig. S2.† We could observe thin TNTs in the confocal images with different permeabilization times. Here, confocal images were captured with a commercial Nikon A1 plus confocal microscope with a 60×/1.4 NA oil objective. Then, to obtain a good labelling effect and avoid excessive destruction of microfilaments, we chose the permeabilization time to be 10 min and verified that intracellular microfilaments could be labelled and imaged well with STORM imaging as shown in Fig. S3.† Thus, 10 min of permeabilization time was adopted in STORM imaging to record the microfilaments in TNTs.
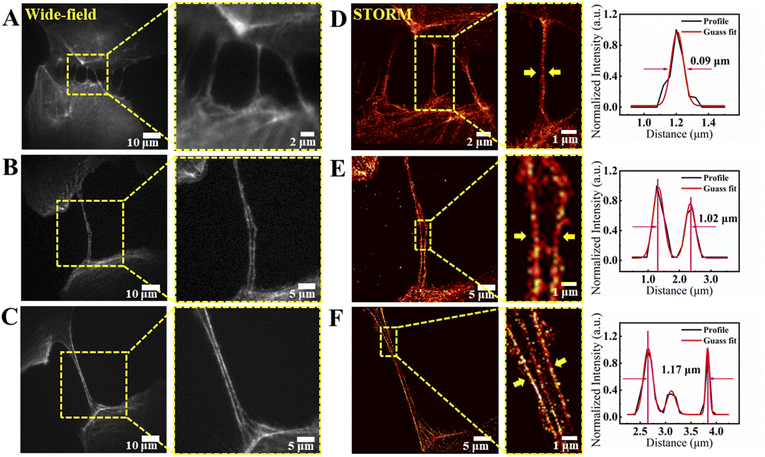
We could observe the obvious TNT structure of BS-C-1 cells both in the wide-field images and STORM images (Fig. 1), which connects two adjacent cells and contains different numbers of microfilaments in the vessels. The microfilaments in TNTs exhibited clear trumpet-shaped connections between cells visualized by STORM imaging, which is consistent with what M. Bénard et al. found in 2015,34 with higher resolution. To further confirm the imaged structures, we also used confocal microscopy to capture the z-sections of the labelled microfilaments in the TNT-like structures that we have found, and ESI Movie 1† indicated that they are TNTs suspended between two cells and are not attached to the glass bottom.
Next, we measured the width of TNTs from the bright-view images and compared the results with the gaps between the outermost microfilaments in confocal images (Fig. S4†). We found that the widths of TNTs are usually slightly larger than the corresponding microfilaments’ gaps. This result indicates that the microfilaments tend to localize on both sides of the TNT lumen. We then applied STORM imaging to visualize the detailed distribution of microfilaments in TNTs. The STORM super-resolution images in Fig. 1D–F showed clearer distribution of microfilaments in TNTs. Moreover, it is obvious that with the gap of the outermost microfilaments enlarging (from 0.09 μm to 1.17 μm, Fig. 1D–F), there are more microfilaments in TNTs and thinner and straighter microfilaments appear in the hollow portion of TNTs. Dual-color confocal imaging indicated that there are both actin and tubulin in thick TNTs (Fig. S5†), which is consistent with previous studies.7,35,36 Taken together, these results showed that, as the size of TNT becomes larger, the number of microfilaments in it increases, suggesting diverse membrane attachments between cell communications.7,37
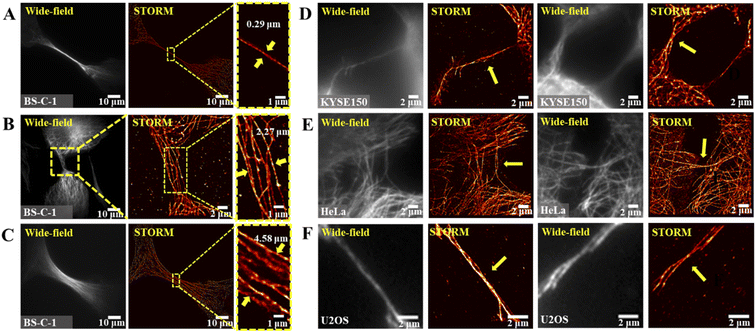
As another crucial cytoskeleton component, microtubules exist in the cytosolic tunnel of the nanotube, and structured the dense network of TNTs. We then employed STORM imaging to observe the organization of microtubules in TNTs of BS-C-1 cells in different fields of view (Fig. 2). The staining of microtubules was realized through anti-α-tubulin monoclonal antibody and Alexa Fluor™ 647-coupled second antibody. Confocal microscopy was utilized to capture the z-sections of the labelled microtubules in TNTs, and the different layers indicated that the TNTs are suspended between two cells and are not attached to the glass bottom (see ESI Movie 2†). We observed that the tubulin in TNTs as shown in Fig. 2A–C also exhibited trumpet-shaped connections between cells.34 Then we found that the distribution of microtubules in TNTs was organized distinctly as shown in Fig. 2A–C. The distribution width of microtubules has a wide range from 0.29 μm to 4.58 μm. When the TNTs become wider, more microtubules appear, and some of them extend along the tube wall in a manner of intertwining, which is similar to what Kreft's group38 found in 2018.
Besides the BS-C-1 cells, we also imaged the intercellular microtubules in various cancer cells including esophageal cancer cells KYSE150, cervical cancer cells HeLa and human osteosarcoma cells U2OS, which are commonly used to study the physiological and pathological processes in the laboratory.39,40 The full field-of-view wide-field images in Fig. 2D–F are shown in Fig. S6.† We could observe thin and long microtubules in the TNTs of KYSE150 cells and U2OS cells as depicted in Fig. 2D and F, respectively. Their microtubules also presented entangled shapes in TNTs. However, for HeLa cells (Fig. 2E), most of the microtubules in TNTs are relatively short, and besides TNTs, we could also visualize many filopodia having no connections between cells in this type of cell. Overall, those results above illustrated different organization patterns of microtubules in TNTs in various cells. They also indicated that our STORM labelling and imaging method for microtubules within TNTs is effective for different types of cells.
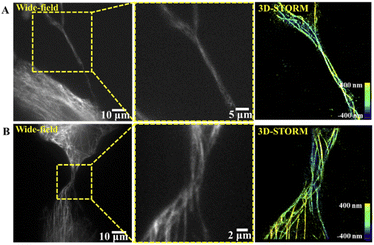
For detailed investigation of microtubules' organization patterns, it is essential to observe them by 3D imaging. As discussed above, the microtubules tended to be intertwined in TNTs. To know how the microtubules twist in TNTs more clearly, 3D-STORM imaging was further applied to analyse the detailed organization of microtubules. By introducing a cylindrical lens into the STORM system, the detected PSF of a defocused fluorescent molecule is deformed in different directions and degrees because of astigmatism. By analysing the ellipticity and orientation of the PSF, the axial position of the molecule can be obtained to realize 3D imaging.25 We obtained the 3D distribution of microtubules in TNTs with thin and wide diameters as shown in Fig. 3A and B, respectively. The pseudo color in Fig. 3 represents the axial range from 400 nm below the focal plane to 400 nm above the focal plane. The super-resolution image displayed at least three microtubules entangled with each other in the smaller-diameter TNT (Fig. 3A), and more microtubules also showed intertwined organization in the TNT with a larger diameter (Fig. 3B), which along with the higher resolution STORM images and intuitive 3D imaging results, further confirmed what Kreft's group38 found using 3D-SIM microscopy in 2018. More significantly, the super-resolution images showed that these microtubules are entwined in an orderly spiral winding manner.
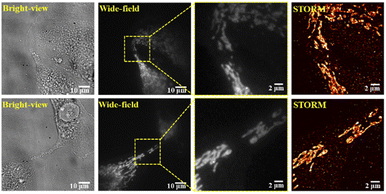
Mitochondrial transfer plays crucial functions during various biological and pathological processes, such as oxidative metabolism, cell signalling and rescuing recipient cells from bioenergetic deficit and tumorigenesis.41 Several studies have demonstrated that TNTs could conduct the transcellular transfer of mitochondria between cells.42–44 Therefore, to better understand the mitochondria transfer through TNTs, we here used STORM imaging to study the spatial distribution of mitochondria within TNTs. We first visualized the distribution of mitochondria between two neighboring cells and observed the obvious tube structures between two cells in bright-view images as shown in Fig. 4. Interestingly, the mitochondria tended to distribute in areas which are close to both sides of the cell, whereas there were no obvious mitochondria found in the middle area of TNTs. We then applied dual-color imaging to observe the microtubules and mitochondria in TNTs simultaneously using confocal microscopy. The colocalization image displayed that most of the mitochondria were concentrated on the bud-shaped sides of the cells in TNTs (Fig. S7†), which is consistent with the STORM result shown in Fig. 4.
In summary, we applied the STORM super-resolution imaging method to explore the structure and distribution of TNT components at the nanometer scale. The various organization patterns of microfilaments and microtubules illustrated diverse structural modes in TNT formations. In particular, the 3D-STORM imaging presented clear intertwined structures of microtubules in TNTs from an intuitive aspect. Besides, an obvious mitochondrial distribution was observed in TNTs, indicating the transportation function of TNTs between cells. Our data presented a novel framework for future studies on the TNT morphology and architecture. With the rapid development of super-resolution imaging techniques and labelling approaches, we affirmed that the correlation between structures and functions of TNTs will be verified quickly in the future.
Conflicts of interest
There are no conflicts to declare.Acknowledgements
This work was partially supported by the National Key R&D Program of China (2021YFF0502900), the National Natural Science Foundation of China (62275165, 62235007, 61975131, 62175166, 32101112, 61835009, and 62127819), and the Shenzhen Basic Research Project (JCYJ20200109105411133).Notes and references
- S. Cohen and M. E. Greenberg, Annu. Rev. Cell Dev. Biol., 2008, 24, 183–209 CrossRef CAS PubMed.
- P. C. Schiller, G. D'Ippolito, R. Brambilla, B. A. Roos and G. A. Howard, J. Biol. Chem., 2001, 276, 14133–14138 CrossRef CAS PubMed.
- N. M. Sherer, M. J. Lehmann, L. F. Jimenez-Soto, C. Horensavitz, M. Pypaert and W. Mothes, Nat. Cell Biol., 2007, 9, 310–315 CrossRef CAS PubMed.
- D. Cordero Cervantes and C. Zurzolo, EMBO J., 2021, 40, e105789 CrossRef CAS PubMed.
- A. Rustom, R. Saffrich, I. Markovic, P. Walther and H.-H. Gerdes, Science, 2004, 303, 1007–1010 CrossRef CAS PubMed.
- L. Taiarol, B. Formicola, S. Fagioli, G. Sierri, A. D'Aloia, M. Kravicz, A. Renda, F. Viale, R. Dal Magro, M. Ceriani and F. Re, Cancers, 2021, 13, 4001 CrossRef CAS PubMed.
- M. W. Austefjord, H. H. Gerdes and X. Wang, Commun. Integr. Biol., 2014, 7, e27934 CrossRef.
- S. Zhu, G. S. Victoria, L. Marzo, R. Ghosh and C. Zurzolo, Prion, 2015, 9, 125–135 CrossRef CAS PubMed.
- V. S. Venkatesh and E. Lou, Cancer Rep., 2019, 2, e1185 Search PubMed.
- R. J. J. Jansens, A. Tishchenko and H. W. Favoreel, J. Virol., 2020, 94, e02120–19 CrossRef CAS PubMed.
- X.-T. Wang, H. Sun, N.-H. Chen and Y.-H. Yuan, Pharmacol. Res., 2021, 170, 105541 CrossRef CAS PubMed.
- A. Sartori-Rupp, D. Cordero Cervantes, A. Pepe, K. Gousset, E. Delage, S. Corroyer-Dulmont, C. Schmitt, J. Krijnse-Locker and C. Zurzolo, Nat. Commun., 2019, 10, 342 CrossRef CAS PubMed.
- S. Abounit, E. Delage and C. Zurzolo, Curr. Protoc. Cell Biol., 2015, 67, 12.10.1–12.10.21 Search PubMed.
- S. W. Hell and J. Wichmann, Opt. Lett., 1994, 19, 780–782 CrossRef CAS PubMed.
- M. G. L. Gustafsson, J. Microsc., 2000, 198, 82–87 CrossRef CAS.
- M. G. L. Gustafsson, Proc. Natl. Acad. Sci. U. S. A., 2005, 102, 13081–13086 CrossRef CAS.
- E. Betzig, G. H. patterson and R. Sougrate, Science, 2006, 313, 1642–1645 CrossRef CAS PubMed.
- M. J. Rust, M. Bates and X. Zhuang, Nat. Methods, 2006, 3, 793–795 CrossRef CAS PubMed.
- A. Sharonov and R. M. Hochstrasser, Proc. Natl. Acad. Sci. U. S. A., 2006, 103, 18911–18916 CrossRef CAS PubMed.
- M. Heilemann, S. van de Linde, M. Schuttpelz, R. Kasper, B. Seefeldt, A. Mukherjee, P. Tinnefeld and M. Sauer, Angew. Chem., Int. Ed., 2008, 47, 6172–6176 CrossRef CAS.
- B. Huang, W. Wang, M. Bates and X. Zhuang, Science, 2008, 319, 810–813 CrossRef CAS PubMed.
- T. Dertinger, R. Colyer, G. Iyer, S. Weiss and J. Enderlein, Proc. Natl. Acad. Sci. U. S. A., 2009, 106, 22287–22292 CrossRef CAS PubMed.
- P. Dedecker, G. C. H. Mo, T. Dertinger and J. Zhang, Proc. Natl. Acad. Sci. U. S. A., 2012, 109, 10909–10914 CrossRef CAS.
- J. Vangindertael, R. Camacho, W. Sempels, H. Mizuno, P. Dedecker and K. P. F. Janssen, Methods Appl. Fluoresc., 2018, 6, 022003 CrossRef CAS PubMed.
- M. Bates, S. A. Jones and X. Zhuang, Cold Spring Harb. Protoc., 2013, 2013, 498–520 Search PubMed.
- G. T. Dempsey, M. Bates and W. E. Kowtoniuk, J. Am. Chem. Soc., 2009, 131, 18192–18193 CrossRef CAS PubMed.
- G. T. Dempsey, J. C. Vaughan, K. H. Chen, M. Bates and X. W. Zhuang, Nat. Methods, 2011, 8, 1027 CrossRef CAS PubMed.
- A. Dani, B. Huang, J. Bergan, C. Dulac and X. Zhuang, Neuron, 2010, 68, 843–856 CrossRef CAS PubMed.
- M. Klevanski, F. Herrmannsdoerfer, S. Sass, V. Venkataramani, M. Heilemann and T. Kuner, Nat. Commun., 2020, 11, 1552 CrossRef CAS.
- J. Q. Xu, H. Q. Ma, H. B. Ma, W. Jiang, C. A. Mela, M. H. Duan, S. M. Zhao, C. X. Gao, E. R. Hahm, S. M. Lardo, K. Troy, M. Sun, R. Pai, D. B. Stolz, L. Zhang, S. Singh, R. E. Brand, D. J. Hartman, J. Hu, S. J. Hainer and Y. Liu, Nat. Commun., 2020, 11, 1899 CrossRef CAS PubMed.
- C. E. Park, Y. Cho, I. Cho, H. Jung, B. Kim, J. H. Shin, S. Choi, S. K. Kwon, Y. K. Hahn and J. B. Chang, ACS Nano, 2020, 14, 14999–15010 CrossRef PubMed.
- I. Verdeny-Vilanova, F. Wehnekamp, N. Mohan, A. Sandoval Alvarez, J. S. Borbely, J. J. Otterstrom, D. C. Lamb and M. Lakadamyali, J. Cell Sci., 2017, 130, 1904–1916 CAS.
- T. E. Hoornweg, E. M. Bouma, D. P. I. van de Pol, I. A. Rodenhuis-Zybert and J. M. Smit, PLoS Neglected Trop. Dis., 2020, 14, e0008469 CrossRef CAS PubMed.
- M. Bénard, D. Schapman, A. Lebon, B. Monterroso, M. Bellenger, F. Le Foll, J. Pasquier, H. Vaudry, D. Vaudry and L. Galas, Biol. Cell, 2015, 107, 419–425 CrossRef PubMed.
- B. Onfelt, S. Nedvetzki, R. K. Benninger, M. A. Purbhoo, S. Sowinski, A. N. Hume, M. C. Seabra, M. A. Neil, P. M. French and D. M. Davis, J. Immunol., 2006, 177, 8476–8483 CrossRef PubMed.
- S. Souriant, L. Balboa, M. Dupont, K. Pingris, D. Kviatcovsky, C. Cougoule, C. Lastrucci, A. Bah, R. Gasser, R. Poincloux, B. Raynaud-Messina, T. Al Saati, S. Inwentarz, S. Poggi, E. J. Morana, P. Gonzalez-Montaner, M. Corti, B. Lagane, I. Vergne, C. Allers, D. Kaushal, M. J. Kuroda, M. D. C. Sasiain, O. Neyrolles, I. Maridonneau-Parini, G. Lugo-Villarino and C. Verollet, Cell Rep., 2019, 26, 3586–3599 CrossRef CAS.
- L. Marzo, K. Gousset and C. Zurzolo, Front. Physiol., 2012, 3, 72 CAS.
- N. Resnik, T. Prezelj, G. M. R. De Luca, E. Manders, R. Polishchuk, P. Veranic and M. E. Kreft, Sci. Rep., 2018, 8, 17133 CrossRef.
- K. Gousset, L. Marzo, P. H. Commere and C. Zurzolo, J. Cell Sci., 2013, 126, 4424–4435 CrossRef CAS PubMed.
- R. Mittal, E. Karhu, J. S. Wang, S. Delgado, R. Zukerman, J. Mittal and V. M. Jhaveri, J. Cell. Physiol., 2019, 234, 1130–1146 CrossRef CAS PubMed.
- D. Valenti, R. A. Vacca, L. Moro and A. Atlante, Int. J. Mol. Sci., 2021, 22, 8312 CrossRef CAS PubMed.
- S. d. Abounit and C. Zurzolo, J. Cell Sci., 2012, 125, 1089–1098 CrossRef CAS PubMed.
- X. Wang and H. H. Gerdes, Cell Death Differ., 2015, 22, 1181–1191 CrossRef CAS.
- M. Dupont, S. Souriant, L. Balboa, T. P. Vu Manh, K. Pingris, S. Rousset, C. Cougoule, Y. Rombouts, R. Poincloux, M. Ben Neji, C. Allers, D. Kaushal, M. J. Kuroda, S. Benet, J. Martinez-Picado, N. Izquierdo-Useros, M. D. C. Sasiain, I. Maridonneau-Parini, O. Neyrolles, C. Verollet and G. Lugo-Villarino, eLife, 2020, 9, e52535 CrossRef CAS PubMed.
Footnotes |
| † Electronic supplementary information (ESI) available. See https://doi.org/10.1039/d2na00415a |
| ‡ These authors contributed equally to this work. |
| This journal is © The Royal Society of Chemistry 2022 |


