 Open Access Article
Population dependence of THz charge carrier mobility and non-Drude-like behavior in short semiconductor nanowires†
Alexander W.
Achtstein
 *,
Nina
Owschimikow
and
Michael T.
Quick
Technical University of Berlin, Strasse des 17. Juni 135, 10623, Berlin, Germany. E-mail: achtstein@tu-berlin.de; Fax: +49(0)3031421079
First published on 2nd December 2021
Abstract
We investigate THz radiation absorption by charge carriers, focusing on the mobility in nanorods and wires. We show that for short rods the mobility is limited by the high spacing of the charge carrier energy levels, while for longer wires (greater 25 nm) finite dephasing results in considerably higher low frequency mobility. Analyzing the length, temperature and population dependence, we demonstrate that, apart from the temperature dependent dephasing, the mobility becomes strongly charge carrier population dependent. The latter results in no simple linear relationship between carrier density and conductivity. Additionally their thermal distribution determines the mobility, measured in experiments. We further show that Drude or Plasmon models apply only for long wires at elevated temperatures, while for short length quantization results in considerable alterations. In contrast to those phenomenological models, i.e. a negative imaginary part of the frequency-dependent conductivity in a nanosystem can be understood microscopically. Based on the results, we develop guidelines to analyze 1D terahertz conductivity spectra. Our approach provides also a new tool to optimize the mobility by nanowire length as well as to analyze the dephasing, not by conventional wave mixing techniques, but by coherent optical pump-THz probe spectroscopy.
1. Introduction
In bulk semiconductors the mobility of charge carriers depends mainly on the magnitude of the electron or hole effective mass as well as the strength of the carrier–phonon interaction since the 3D density of states provides a continuum of final states for acceleration in an external field or scattering with phonons and impurities. This concept of a carrier mobility as an intrinsic material property, however, does not hold for systems with reduced dimensionality. In 1D quantum wires of finite length, length quantization reduces the continuum to a series of discrete states on the original dispersion parabola with quantized energies and carrier momenta. Typically THz radiation is used to induce intraband transitions of optically generated electrons in the conduction band and holes in the valence band, respectively, leading to charge transport by inducing increasing momentum.1–9 Conventional continuum physics conductivity models, frequently used for the frequency-dependent conductivity σ(ω), like the Drude–(Lorentz) or Drude–Smith models3,4,10,11 should be chosen with care to analyze frequency dependent mobility data in semiconductor nanosystems, as they invoke the presence of a continuum of states implicitly or explicitly. For the Drude model this implies e.g. non-negative real and imaginary conductivity or a maximal conductivity at zero frequency, which does not reflect the observations for nano materials1,2,6,9,12–15 in many cases. The addition of a backscattering term in Drude–Smith models resolves these problems phenomenologically, however giving only limited physical insight.3,4 Plasmon models introduce an additional restoring force, allowing for a more versatile real and imaginary conductivity. The model, nontheless, stays phenomenological.1–4,14,16 Instead quantum mechanical approaches to the conductivity in semiconductor nanomaterials are needed, but rarely used.12,17 A systematic investigation, discussing the impact of the major system parameters and the underlying physics is still lacking.In this contribution we show based on a quantum mechanic Kubo–Greenwood approach that a model taking into account localization to a finite system length or domain size leads to strong alterations with respect to the mentioned conventional models. We analyze the frequency, length and population dependence of the mobility of electrons and holes inside a 1D domain with WZ CdSe as an exemplary model system. We suggest that dephasing in these systems can be measured by model fits to experimental frequency dependent mobility spectra from THz spectroscopy, without the use of e.g. nonlinear four wave mixing techniques.
2. Results and discussion
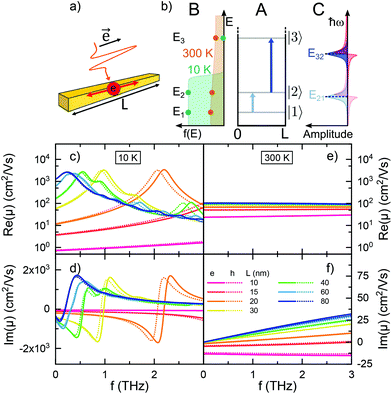
Kubo18 and Greenwood19 have developed a formalism describing the mobility of charge carriers based on a quantum mechanical approach. We consider a quantized 1D system of finite length L (Fig. 1(a)) and infinite confinement potential outside the domain. The frequency dependent conductivity is3,20,21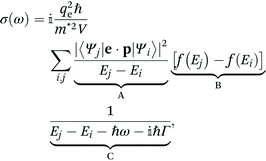 | (1) |
 | (2) |
 | (3) |
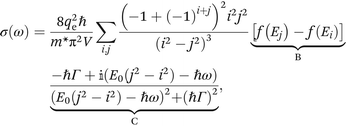
 to transfer from a momentum to a spatial operator. Further we expand the Lorentzian lineshape function
  to gain a real denominator. We obtain
  | (4) |
 | (5) |
The sum in eqn (1) and (4) can be separated into three terms with distinct physical meaning, which we denote as A, B and C. Term A represents an energy normalized transition probability depending on the potential and hence basis functions. It implies, that only transitions |i〉 → |i + 1〉 contribute significantly, as the probability of the next allowed transition |i〉 → |i + 3〉 is already orders of magnitude smaller for the potential well. Term B is the difference in Fermi occupation of level i and j. At 0 K the N electrons fill up the lowest states till the Fermi energy. Transitions between states near the Fermi edge dominate the conductivity and mobility, as they go from occupied states to vacant states above. Term C is the Lorentzian transition line, containing the full frequency dependence of real and imaginary part for each transition. Given a certain Γ it can only shift in resonance frequency through L (via E0), j and i. Terms A, B and C are visualized schematically in Fig. 1(b).
The lower panels of Fig. 1 show the frequency-dependent real and imaginary parts of the single-carrier mobility in CdSe nanowires of different length at 10 K (c + d) and 300 K (e + f), using me = 0.31m0 and mh = 0.33m0 for thin wires.23 For Γ we chose typical dephasing rates of 8 × 10¹¹ s−1 at 10 K and 5 × 10¹³ s−1 at 300 K in CdSe.24 The frequency range of 0–3 THz reflects typical settings of Terahertz Time Domain Spectroscopy (THz-TDS).25,26 Due to the similar effective masses there are no considerable differences in the electron (continuous lines) and hole (dotted lines) mobilities. At low temperature the occupation number shows a steep edge at EF (see Fig. 1b) at 10 K. The broadening of this edge by ±kBT is small. Only for a small number of transitions term B in eqn (1) is large enough to contribute significantly. Hence the clearly pronounced resonance structure of both the real and imaginary parts of the frequency-dependent mobility at low temperature, showing the Lorentzian lines (term C, eqn (1)) of the respective transitions. For small nanowires of 20 nm (c + d, magenta) the energetic state spacing is large and many transitions thus largely super-resonant with respect to the 0–3 THz window. With the probe frequency in the red wing of the resonance, the imaginary part becomes negative. Increasing the nanorod length, however, decreases the lateral confinement, shifting transitions into the 0–3 THz frequency window. For the longer wires, the increasingly close spacing of energy levels allows for multiple transitions in the chosen frequency range, which results in the prominent, increasingly dense wiggles observed on the mobility calculated for long wires, and finally arriving at a bulk-like limit for very long wires.
Increasing the temperature smoothes the Fermi edge as illustrated in Fig. 1(b). The energy denominator in term A (eqn (1)) and the population number difference in term B balance each other in a way that allows a manifold of energetically accessible transitions to contribute to the signal, although each with low amplitude, which causes the peak structure to be blurred. A considerably higher Γ additionally reduces the amplitude of each transition, but also broadens the peak profile in the real part. Still, the large energetic spacing of small wires allows fewer transitions within the chosen frequency range, than for long, weakly confined wires (e + f), maintaining the negative imaginary mobility observed for very short wires. The mobilities in Fig. 1(e + f) also show, that for long nanowires (>80 nm, blue) a continuum limit is reached, which is related to the summation of very close lying neighboring transitions of about equal transition frequency. The results show, that there is a quantum mechanical transport regime in the finite size domain, in contrast to the conventional Drude Model, which captures bulk like properties. Our description matches observations made in experiments.1,2,6,9,12–14
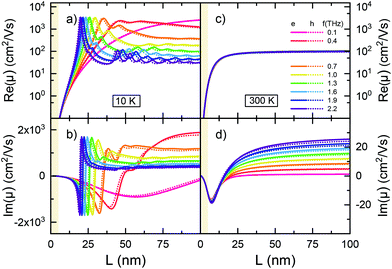
In Fig. 2 we analyze the length dependence of the single-carrier mobility in our model for various THz frequencies. We observe at both temperatures in (a) and (c) a strong increase of the mobility with nanowire length, up to about 20 nm, followed by a saturation regime due to a quasi-continuous density of states in long wires. Again, the observed structure is largely due to the interplay of terms A and B in eqn (1), with A yielding the energy of the possible transitions relative to the THz window and B the weight of these transitions through the population difference. Short wires (<20 nm) are off-resonant, so that only an onset of a higher energy transition is observed in (a) and (d), resulting in lower overall mobility, which is increasing with length due to decreasing detuning of the lowest electronic transition(s). At low temperature we observe with increasing length additional maxima (a) and additional Poles (b) for every additional resonant transition, best seen for high probe frequencies. The phase course ϕ = arctan(Im(μ)/Re(μ)), discussed in section S2 of the ESI,† also reflects the transition from the quantum transport to the continuum limit with increasing wire length, as shown in Fig. S1.† Overall, the mobilities are on average lower at elevated temperature (d + e) as compared to 10 K, as a broader thermal distribution of initial population results in a reduced transition probability to nearby higher states, as f(Ej) will approach f(Ei). Again, the increased dephasing rate Γ at elevated T reduces the amplitude of both real and imaginary mobility. The impact of variable dephasing is discussed in section S3 of the ESI.†
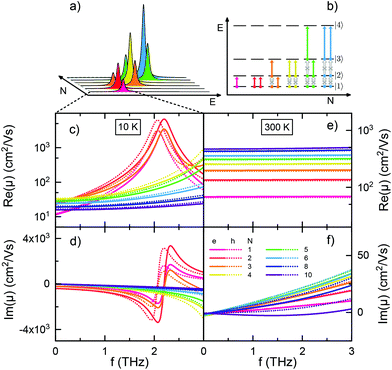
As a further aspect we investigate the population or excitation dependence of the system mobility for one to ten electrons (holes) on the 1D domain. Inspecting eqn (4), we vary f(Ej) − f(Ei) by varying N in eqn (3), which implies different Fermi distributions. Fig. 3 displays the results for 20 nm CdSe nanorods at 10 and 300 K, applying the same Γ as above. In Fig. 3(a) the transition energies and amplitudes of the first two transitions, starting from the lowest states, are shown for a quantum well at low temperature. They depend on the carrier occupation. Fig. 3(b) shows the underlying carrier distribution according to the ‘aufbau principle’. With a maximum of two carriers occupying a single state, the state filling successively excludes transitions between low energy levels. Due to the growth of energy level spacings with quantum number, the allowed transitions display a stepwise shift towards higher energy with increasing carrier occupation. Note that the energy scale in Fig. 3(a) is equivalant to 0–8 THz in our model, so only the first peaks are visible in panel (c). The real and imaginary parts of the calculated mobilities are shown in Fig. 3(c–f). The ‘aufbau principle’ is reflected in the curves at low temperature, where it remains close to the real occupation due to the steep Fermi edge, as only for up to three carriers a resonance structure similar to Fig. 1(c + d) is obtained. The curves for higher carrier population show features similar to the shortest rods of Fig. 1(c + d), as the lowest possible transitions shift outside the THz frequency window towards higher energies. The number of carriers modulates the amplitude of the mobility curves in line with the total number of allowed transitions at a given energy (see Fig. 3(a)).
At elevated temperatures in Fig. 3(e) the Fermi function broadens in energy, resulting in a broad distribution of initial states with low occupation. More and more transitions to nearby states, which are not fully occupied, are then possible. This increases the charge carrier mobility with increasing population in (e). According to eqn (3) an increased number of charge carriers broadens the population distribution further, so that the mobility can increase due to partially free states beneath in energy.
An increasingly large imaginary part at 300 K in (f) reflects the growing total dephasing, as more and more transitions between the different states are involved and summed up. At some point (6 electrons) the behavior is inverted, as the increasing level spacing at the Fermi edge becomes again bigger than the dephasing, resulting in a reduction of the imaginary part in (f). The latter behavior is also observed in (d).
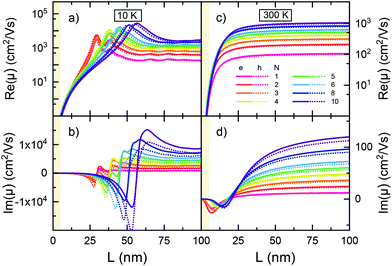
Fig. 4 shows the nanowire length dependence of the real (a + c) and imaginary (b + d) mobility at 1 THz frequency for different electron or hole populations. At 10 K an increase of the carrier number shifts the maximum (a) and pole (b) to higher length. In this case the, behavior is governed by term A in eqn (1), as an increased energy spacing to the next unoccupied state, which gets higher with the quantum number of the initial state at the Fermi edge, is compensated partially by the length increase related decrease of the energy spacing. Hence, the maximum associated with transitions to the first (partially) unoccupied state shifts with population to higher wire length. For long wires a continuum limes is approached again. At 300 K higher dephasing together with broad Fermi distributions (small differences between initial and final states, term B in eqn (1)) result in lower mobility compared to 10 K as well as flat length dependencies (d) for long wires. At 300 K the detuning in term C of eqn (1) is smaller than the dephasing, so that the imaginary part of the mobility increases linearly with the detuning, and hence the energy level spacing to the next unoccupied states once more and more electrons are on the domain.
We remark that the observed state filling effects on the mobility strongly depend on the density of states and with it on the energetic level structure of the nanorod, in our case approximated by infinite square well results. In the next section we compare our model for the nano wire conductivity to experimental findings on two different systems: CdSe nanorods of 23 nm length and 6 nm in diameter (ref. 27) as well as PbSe nanorods with 51 nm length (ref. 28) and 4 nm in diameter, respectively. Fig. 5 displays the experimental frequency-dependent real (blue) and imaginary (red) sheet conductivity of CdSe nanorods (a + b)27 as well as the frequency averaged mobility's real part for PbSe nanorods versus the number of optically excited electrons and holes (c).28 We further show a confidence band introduced, accounting for polydispersity of the sample. In (a + b) the uncertainty is determined from a TEM image,27 which results in a size L = (23 ± 2.5) nm. Overall we find very good agreement of our model with the experimental result (see ESI section S4†). Fig. 5(c) is generated by a different approach. Here, analogous to the procedure of ref. 28, the conductivity is averaged over a range of 0.5–1.2 THz. The model approach does not only reproduce the trend of the experimental data, but results in reasonable agreement. There are two contributions to the falling curves in Fig. 5(c) – the reduction of e–h pair population due to exciton formation, as well as the elevation of Fermi Energy with increasing carrier density. The deviations between simulation and measurement most probably relate to parallel processes, that reduce the number of mobile charge carriers at higher excitation densities, as observed in nanostructures.29,30 In summary Fig. 5(a + b + c) clearly show that our model reproduces experimental results and that, as expected by our model, the charge carrier mobility is population dependent. We remark, that for infrequently considered very low bandgap semiconductors (like MidIR materials) our theory needs adjustment, since the effective mass may be not constant anymore within the window of carrier energies probed by the THz-frequencies.
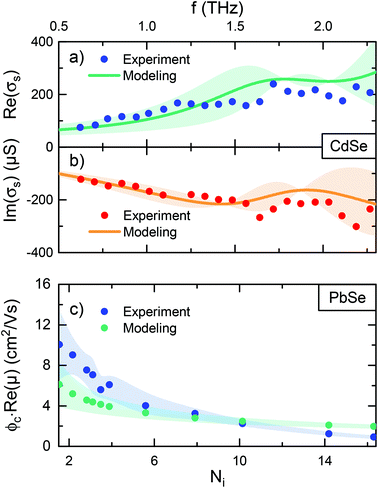 | ||
| Fig. 5 Frequency dependent experimental (ref. 27) and modeled real (a) and imaginary (b) sheet conductivity and their uncertainties for (23 ± 2.5) nm CdSe nanorods at room temperature. (c) Frequency averaged experimental (ref. 28) and model mobilities and their uncertainties for (51 ± 11) nm PbSe nanorods versus the number of electrons and holes, generated by optical excitation at room temperature. | ||
Based on Fig. 1–4, section S3 of the ESI† and their discussion, the following properties and peculiarities are relevant for the interpretation of experimental THz conductivity data, that have to be kept in mind to obtain microscopic mobilities and avoid potential misinterpretation. This is especially relevant for the comparability of data among different experiments.
(1) If the spectral resolution of the experiment is too low, the steep maxima in the length dependencies (e.g.Fig. 2(a)) at low temperatures will be washed out. Further the small wiggles in the frequency domain at low temperatures and intermediate wire length can not be observed or may be misinterpreted as noise (e.g.Fig. 1(c)).
(2) Comparing wires of different length for rather intermediate or long wires may result in averaging over the resonances (in Fig. 2 and 4) once there is a lateral length dispersion in the samples. Hence, depending on inhomogeneous wire length distribution, the THz system resolution as well as dephasing, different measurement results can be obtained, which may differ remarkably form the intrinsic physical properties of the wires, especially at low temperatures. One way out would be to consider only wires shorter than ∼25 nm in our case. The impact of a lack of resolution or the inhomogeneous broadening can be exemplified in principle by Fig. S3† (ESI†) (a). Such broadening increases the apparent line width like the dephasing in eqn (1), so that the mobility in the first resonance is reduced by an order of magnitude, e.g. going from a ħ × 1011 s−1 to a ħ × 1012 s−1 line width.
(3) Any analysis of the mobility in nano materials at elevated temperatures needs to take into account the effect thermal Fermi–Dirac distribution broadening. Even without any temperature dependent dephasing this results in a considerable reduction of the mobility at elevated temperature. Such a phenomenon is not limited to elevated temperatures, but can also be induced at low temperature when quite long wires are used, as long as the dephasing rate is still lower than the energy spacings of the states.
(4) The pump intensity or fluence in optical pump-THz probe spectroscopy correlates to the number of absorbed photons, that translate into a number of conducting charge carriers. Eqn (3) has the consequence that more charge carriers rise the Fermi level, forcing the population of higher states. Depending on the considered THz frequency, the mobility is generally higher near electronic resonances according to eqn (4) (see Fig. 1 and 3). The temperature and number of charge carriers on the domain also alter the mobility, even without the effect of an additional temperature dependent dephasing. At room temperature for example, where a broad number of transitions occur due to a broad Fermi edge, an increasing number of charge carriers elevates the Fermi edge, resulting in an up to an order of magnitude alteration of the mobility (Fig. 3e) in the considered range. This effect is damped for nano systems of high exciton binding energy due to the Saha equation mediated equilibrium of excitons and e–h pairs, where only a small absolute number of charge carriers is obtained from a finite number of excitations. In systems with predominantly uncorrelated e–h pairs however, the population dependence of the mobility is probably most prominent.
(5) Only for long wires and elevated temperatures the Drude or Plasmon models recover the course of the frequency dependent mobility, as thermal population and broadening result in a quasi continuous density of states for charge carriers, see section S5 of the ESI.†
(6) The Kubo–Greenwood eqn (1) and (4) imply that by fitting experimental THz spectra the dephasing rate Γ can be determined. A protocol for fitting is given in the ESI, section S6.† This makes THz time domain spectroscopy an interesting alternative to complex nonlinear techniques like Four Wave Mixing (FWM),31 since it is in contrast based on the interaction with just one THz photon and no optical grating is involved.
3. Conclusion
In summary we have shown that the mobility in 1D semiconductor nanowires shows a quantum transport regime for short wires, while for long wires (>25 nm) and elevated temperatures diffusive transport, associated with dephasing at least of the order of the energy level spacing is the dominating mechanism. For short rods the mobility is limited by the high level spacing of the quantized carrier energy levels, while for longer wires finite dephasing results in considerably higher low frequency mobility. Drude and Plasmon models for the mobility are suitable only for long wires at elevated temperatures, as thermal population and brodening result then in a quasi continuous density of states for charge carriers, a prerequisite for their applicability.Having analyzed the length, temperature and population dependence, the results demonstrate that apart from the temperature dependent phonon scattering and dephasing the thermal population of the quantized charge carrier states as well as the number of charge carriers on the domain have an important impact on the carrier mobility measured in experiments, i.e., the temperature dependence of the mobility is not only related to phonon scattering (dephasing) as often thought, but also broadening of the Fermi function. Also, as the Fermi distribution is population dependent, mobility and conductivity become non-trivially population dependent. A comparison with experimental data on PbSe and CdSe wires has substantiated our results. On the other hand our approach provides a new tool to analyze the dephasing in nano systems quantitatively, not by conventional wave mixing techniques, but by coherently detected optical pump THz probe spectroscopy and the analysis of the resultant frequency-dependent mobility spectra with fits to our model.
Conflicts of interest
There are no conflicts to declare.Acknowledgements
A. W. A. acknowledges funding by DFG projects AC290/2-1 and AC290/2-2.References
- P. Parkinson, J. Lloyd-Hughes, Q. Gao, H. H. Tan, C. Jagadish, M. B. Johnston and L. M. Herz, Nano Lett., 2007, 7, 2162–2165 CrossRef CAS.
- H. J. Joyce, J. L. Boland, C. L. Davies, S. A. Baig and M. B. Johnston, Semicond. Sci. Technol., 2016, 31, 103003 CrossRef.
- J. Lloyd-Hughes and T.-I. Jeon, J. Infrared, Millimeter, Terahertz Waves, 2012, 33, 871–925 CrossRef CAS.
- R. Ulbricht, E. Hendry, J. Shan, T. F. Heinz and M. Bonn, Rev. Mod. Phys., 2011, 83, 543–586 CrossRef CAS.
- J. Lauth, M. Failla, E. Klein, C. Klinke, S. Kinge and L. D. A. Siebbeles, Nanoscale, 2019, 11, 21569–21576 RSC.
- C. Yang, M.-H. Lin, C. Chang, P. Yu, J. Shieh, C. Shen, O. Wada and C. Pan, IEEE J. Quantum Electron., 2013, 49, 677–690 CAS.
- R. A. Kaindl, D. Hägele, M. A. Carnahan and D. S. Chemla, Phys. Rev. B: Condens. Matter Mater. Phys., 2009, 79, 045320 CrossRef.
- G. Li, K. Kushnir, M. Wang, Y. Dong, S. Chertopalov, A. M. Rao, V. N. Mochalin, R. Podila, K. Koski and L. V. Titova, 2018 43rd International Conference on Infrared, Millimeter, and Terahertz Waves (IRMMW-THz), 2018, pp. 1–3.
- J. B. Baxter and C. A. Schmuttenmaer, J. Phys. Chem. B, 2006, 110, 25229–25239 CrossRef CAS PubMed.
- G. Grosso and G. P. Parravicini, Solid State Physics, Academic Press, London, 2014 Search PubMed.
- T. L. Cocker, D. Baillie, M. Buruma, L. V. Titova, R. D. Sydora, F. Marsiglio and F. A. Hegmann, Phys. Rev. B, 2017, 96, 205439 CrossRef.
- T. Ostatnický, V. Pushkarev, H. Němec and P. Kužel, Phys. Rev. B, 2018, 97, 085426 CrossRef.
- X. Zou, J. Luo, D. Lee, C. Cheng, D. Springer, S. K. Nair, S. A. Cheong, H. J. Fan and E. E. M. Chia, J. Phys. D: Appl. Phys., 2012, 45, 465101 CrossRef.
- R. Momper, H. Zhang, S. Chen, H. Halim, E. Johannes, S. Yordanov, D. Braga, B. Blülle, D. Doblas, T. Kraus, M. Bonn, H. I. Wang and A. Riedinger, Nano Lett., 2020, 20, 4102–4110 CrossRef CAS.
- P. Parkinson, H. J. Joyce, Q. Gao, H. H. Tan, X. Zhang, J. Zou, C. Jagadish, L. M. Herz and M. B. Johnston, Nano Lett., 2009, 9, 3349–3353 CrossRef CAS PubMed.
- H. Nemec, P. Kuzel and V. Sundström, J. Photochem. Photobiol., A, 2010, 215, 123–139 CrossRef CAS.
- M. T. Quick, N. Owschimikow and A. W. Achtstein, J. Phys. Chem. Lett., 2021, 7688–7695 CrossRef CAS PubMed.
- R. Kubo, J. Phys. Soc. Jpn., 1957, 12, 570–586 CrossRef.
- D. A. Greenwood, Proc. Phys. Soc., London, 1958, 71, 585–596 CrossRef CAS.
- L. Calderín, V. Karasiev and S. Trickey, Comput. Phys. Commun., 2017, 221, 118–142 CrossRef.
- L. L. Moseley and T. Lukes, Am. J. Phys., 1978, 46, 676–677 CrossRef.
- M. Combescot and S.-Y. Shiau, Excitons and Cooper pairs: two composite bosons in many-body physics, Oxford University Press, 2015 Search PubMed.
- H. Huan, L. Chen and X. Ye, Nanoscale Res. Lett., 2017, 12, 178 CrossRef PubMed.
- A. W. Achtstein, S. Ayari, S. Helmrich, M. T. Quick, N. Owschimikow, S. Jaziri and U. Woggon, Nanoscale, 2020, 12, 23521–23531 RSC.
- J.-L. Coutaz, F. Garet and V. P. Wallace, Principles of Terahertz Time-Domain Spectroscopy, Jenny Stanford Publishing, 2018 Search PubMed.
- R. A. Lewis, Terahertz Physics, Cambridge University Press, 2009 Search PubMed.
- D. Cooke, J. Y. Lek, F. Krebs, Y.-M. Lam and P. Jepsen, Proc. SPIE, 2010, 7600, 6000H–60001 CrossRef.
- A. Kulkarni, W. H. Evers, T. P. van Waas and L. D. A. Siebbeles, J. Phys. Chem. C, 2020, 124, 7550–7557 CrossRef CAS.
- J. Lauth, S. Kinge and L. D. Siebbeles, Z. Phys. Chem., 2017, 231, 107–119 CrossRef CAS.
- H. J. Joyce, S. A. Baig, P. Parkinson, C. L. Davies, J. L. Boland, H. H. Tan, C. Jagadish, L. M. Herz and M. B. Johnston, J. Phys. D: Appl. Phys., 2017, 50, 224001 CrossRef.
- R. Prasankumar and A. Taylor, Optical techniques for solid-state materials characterization, CRC Press, 2012 Search PubMed.
Footnote |
| † Electronic supplementary information (ESI) available: Details on derivation of eqn (4), the impact of dephasing, the phase course, the comparison with experimental data and the coincidence of the Kubo–Greenwood model approach with the Drude and Plasmon model for long wires. See DOI: 10.1039/d1nr06253k |
| This journal is © The Royal Society of Chemistry 2022 |

