 Open Access Article
Creative Commons Attribution 3.0 Unported Licence
In situ monitoring of cellulose etherification in solution: probing the impact of solvent composition on the synthesis of 3-allyloxy-2-hydroxypropyl-cellulose in aqueous hydroxide systems†
Shirin
Naserifar
 *ab,
Petrus F.
Kuijpers
c,
Sylwia
Wojno
bd,
Roland
Kádár
 bd,
Diana
Bernin
 a and
Merima
Hasani
ab
aDepartment of Chemistry and Chemical Engineering, Chalmers University of Technology, 412 96 Gothenburg, Sweden. E-mail: shirin.naserifar@chalmers.se
bWallenberg Wood Science Center, Chalmers University of technology, 412 96 Gothenburg, Sweden
cMettler-Toledo B.V., Franklinstraat 5, 4004 JK Tiel, The Netherlands
dDepartment of Industrial and Materials Science, Chalmers University of Technology, 412 96 Gothenburg, Sweden
First published on 20th June 2022
Abstract
Etherification of cellulose using allyl glycidyl ether was carried out in aqueous alkaline solutions of benzyltrimethylammonium hydroxide, tetramethylammonium hydroxide, NaOH and different mixtures of these bases in order to study the effect of hydroxide base composition on the course of the reaction and the resulting product properties. In situ FTIR spectroscopy and time sweep shear measurements were carried out to monitor the reactions in real time. Infrared Attenuated Total Reflectance Spectroscopy and 1H NMR confirmed the synthesis of 3-allyloxy-2-hydroxypropyl-cellulose and 2D HSQC NMR confirmed substitution on C2, C3 and C6 in all of the solvents. Quantitative 13C NMR was used to estimate the molar substitution. Cellulose solutions in these quaternary ammonium hydroxides showed higher stability at 50 °C during the course of reaction, faster dissolution and hydrolysis of allyl glycidyl ether and lower molar substitution values compared to NaOH. Even though the highest molar substitution value was obtained in NaOH, the isolated product from this medium had lower solubility in DMSO-d6 and its 13C NMR did not differ significantly except for higher intensity of C1 and C6 compared to the other spectra. The obtained results indicated a more pronounced cascade reaction on the substitution itself in NaOH and lower temperature stability of cellulose solutions in this solvent.
Introduction
Cellulose is the most abundant polysaccharide occurring in nature existing not only as the main structural component in the higher plant cell wall but also in a number of organisms such as bacteria, tunicates and algae. This carbohydrate is composed of D-glucose monomers which are linearly connected via β (1–4) glycosidic linkages. Over the past decades, an ever-increasing attention has been drawn to cellulose due to its abundance, low cost, and biodegradability. Besides, the urge to shift from petroleum-based resources towards more sustainable and renewable raw materials has resulted in extensive efforts within cellulose research. In this regard, numerous investigations have been carried out on the development of new bio-based materials1,2 through chemical functionalization or/and re-shaping after dissolution.Yet, one major challenge when using cellulose is that it can neither melt nor dissolve in the most conventional solvents. Thus, to modify cellulose properties and defeat its poor solubility, chemical functionalization has become active research area over the past decades. To functionalize cellulose, the primary determining factor is the accessibility of hydroxyl groups, which is governed by cellulose morphology and supramolecular structure, as well as the type of processing medium and reagent.
Over the years, continuous research has focused on developing new cellulose derivatives with a broad spectrum of properties and enhanced processability.3,4 In this respect, cellulose ethers are of high commercial importance5 being widely utilized as solution thickeners, lubricants, water binders, rheology modifiers and water retention agents5 in food packaging,6 batteries,7 construction,8 pharmaceutics,9 paper,10 textiles,11 oil field chemicals,12 adhesives13 and personal care products14 due to their interaction with water, chemical stability, sustainability and non-toxicity.
Generally, cellulose ethers are synthesized either heterogeneously or homogeneously. Heterogeneous reaction conditions require commonly a two-step process: (1) mercerization to activate the hydroxyl groups and reduce crystallinity (2) nucleophilic attack of the reactive hydroxyl groups on an etherifying reagent such as alkyl halides or epoxides.15 Yet, these reactions suffer from poor substitution control (in terms of amount and distribution of the introduced substituent) due to low accessibility of cellulose hydroxyl groups. In contrast, cellulose hydroxyl groups in homogeneous reaction conditions are equally available affording improved control of substitution distribution and thus products properties,16 which justifies further efforts on understanding and improving homogeneous processes.
Over years, a number of homogeneous dissolving systems for modification of cellulose have been reported namely SO2/diethylamine/dimethyl sulfoxide,17 LiCl/1,3-dimethyl-2-imidazolidinone,18 (DMSO)/NMMNO,19 NaOH/Urea (aq),20 DMSO/TBAF,19 ionic liquids21 and LiCl/DMAc.22 However, instability, volatility and toxicity are some disadvantages of these systems. In this context, expanding the spectrum of available water-based solvents has become relevant and efforts have been made to introduce such systems.
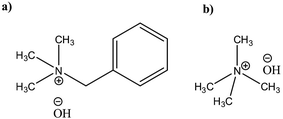
Potential of quaternary ammonium hydroxides (QAHs) as another class of promising water based solvents for cellulose has been known for a long time patented first by Leon Lilienfeld.23 Since then, a number of different QAHs(aq) have been reported to dissolve cellulose24–28 and cellulose behavior in these solvents has been investigated. Yet, there is a lack of comprehensive study on modification of cellulose in these aqueous systems that could highlight the parameters governing the reaction. Recently in our group, cellulose dissolution and the existing stabilizing interactions in aqueous solutions of tetramethylammonium hydroxide (TMAH) and benzyltrimethylammonium hydroxide (Triton B) (Scheme 1) as well as their combination with NaOH have been studied.29,30 The results show that the addition of TMAH and Triton B to NaOH enhances cellulose solubility and in case of TMAH delays the gelation time, allowing for tuning the solution properties by varying the base composition of the solvent. In this study low concentration of the selected bases has been used to dissolve cellulose and later modify it. Since at this low concentration majority of the solution is composed of water toxicity is lower compared to using concentrated solvents. However, considering the complexity of cellulose etherification it is highly uncertain how this tuning of solution composition and properties might affect the course and outcome of the reaction. In the current study, we set out to investigate the impact of the base composition on the course of etherification in solution by following a model reaction of microcrystalline cellulose (MCC) with allyl glycidyl ether (AGE). Given the poor stability of aqueous cellulose solutions over time, a great effort has been put on in situ monitoring of the reactions by FTIR and rheology measurements revealing both its challenges and assets. In addition, complementing characterization of the products was performed by ART-FTIR, 1H NMR, quantitative 13C NMR and 2D HSQC-NMR.
Materials and methods
Chemicals
MCC (Avicel PH-101) with a degree of polymerization of 180 as measured by GPC-MALLS (personal communication with Majid Ghasemi at Södra skogsägarnas ekonomiska förening) was purchased from FMC BioPolymer. It was purified and partially depolymerized by acid hydrolysis of specialty wood pulp. NaOH, Triton B 40 wt% in H2O, TMAH, 25 wt% in H2O, AGE, EtOH 95 wt% and DMSO-d6 (99.9%) were purchased from Sigma-Aldrich. All the chemicals were used as purchased without further purification and deionized water was used for dilution.Synthesis of the 3-allyloxy-2-hydprhypropyl cellulose (AHP-cellulose)
In a typical run, specific amount of deionized water was added to 0.069 mol of the solvents (NaOH, TMAH, Triton B and the mixtures) to yield solutions with total water content of 30 ml. Then the solutions were put in the freezer to cool down to −25 °C for 20 minutes and later 1.017 g MCC was added to the prepared solutions in the ice bath under stirring until a transparent solution with no precipitates was obtained. The solutions were frozen at −25 °C and thawed afterward to make sure the resulting solutions were homogeneous. Consequently, the solution was poured into a round-bottom three-neck flask and put in an oil bath at 50 °C. A reflux was set up to avoid evaporation and the probable change in concentration. The ReactIR probe was immersed in the solution and then AGE was added (the molar ratio of AGE to each MCC hydroxyl group was maintained at 3![[thin space (1/6-em)]](https://www.rsc.org/images/entities/char_2009.gif) :
:![[thin space (1/6-em)]](https://www.rsc.org/images/entities/char_2009.gif) 1). In order to suppress changes which usually interfere with an FTIR analysis in these systems including water evaporation, atmospheric CO2 and O-mediated cellulose degradation and to be able to follow the characteristic peaks, the reactions were performed under N2 atmosphere using a reflux for 2 h. After the reaction was complete, EtOH 95% was added to the solution to allow the product to diffuse out of the solution. The solutions were transferred to dialysis tubes with a cut off 6–8 kDa and dialyzed against deionized water for a week until the supernatant became neutral and then freeze dried. The final products were characterized using ATR-FTIR, 1H NMR, quantitative 13C NMR and 2D HSQC-NMR.
1). In order to suppress changes which usually interfere with an FTIR analysis in these systems including water evaporation, atmospheric CO2 and O-mediated cellulose degradation and to be able to follow the characteristic peaks, the reactions were performed under N2 atmosphere using a reflux for 2 h. After the reaction was complete, EtOH 95% was added to the solution to allow the product to diffuse out of the solution. The solutions were transferred to dialysis tubes with a cut off 6–8 kDa and dialyzed against deionized water for a week until the supernatant became neutral and then freeze dried. The final products were characterized using ATR-FTIR, 1H NMR, quantitative 13C NMR and 2D HSQC-NMR.
Characterization methods
The equipment was configured to collect spectra at the resolution of eight wavenumber by averaging 159 scans in 1 minute interval for 2 h duration. The air background was collected prior to each run. The DiComp probe was immersed into the reaction mixture and any further movement of the probe was avoided as it could affect the trends.
To investigate the gathered spectra, the diagnostic peaks were selected both manually and via component suggestion function of the software. To collect reference spectra the probe was immersed in the desired solution and one spectrum was collected right away without any delay.
![[small gamma, Greek, dot above]](https://www.rsc.org/images/entities/i_char_e0a2.gif) = 1500 1 s−1, was used for all measurements. Our purpose was to try and induce as much mixing as possible to be comparable to the in situ IR spectroscopy study. While the selected shear rate is considerably below the instrument/measuring geometry limit, significant vibrations were induced by the solvent trap part attached to the moving cylinder at higher shear rates.
= 1500 1 s−1, was used for all measurements. Our purpose was to try and induce as much mixing as possible to be comparable to the in situ IR spectroscopy study. While the selected shear rate is considerably below the instrument/measuring geometry limit, significant vibrations were induced by the solvent trap part attached to the moving cylinder at higher shear rates.
Before testing, each sample was pre-mixed using a magnetic stirrer for 1 min. Thereafter, the samples were directly transferred to the already heated (50 °C) double gap measuring cell. The measurements were started immediately, without a relaxation time. Each composition was measured at least two times, and the average and standard deviations were computed.
Attenuated total reflectance Fourier transform infrared (ATR-FTIR)
Infrared spectra were recorded on a PerkinElmer Frontier equipped with an Attenuated Total Reflectance (ATR). A background of air was collected prior to the measurements, and the samples were placed on top of the ATR crystal and secured using a metal clamp to ensure consistent pressure. The device was set to collect the spectra in a transmittance mode with a resolution of 4 cm−1 and 20 scans.NMR characterization
All NMR spectra were recorded at 25 °C on a Bruker AVANCE III HD 18.8 T NMR spectrometer equipped with a 5 mm TXO Cryoprobe (cold 1H and13C channels) operating at a frequency of 800 MHz for 1H and 201 MHz for 13C.The 1H spectra were recorded at a 30° pulse angle, a 1.5 s interscan delay, 32 scans, and 1.36 s acquisition time.
The HSQC spectra were recorded with a standard Bruker pulse sequence, hsqcedetgpsisp 2.3, with a 0.128 s 1H acquisition time, a 5.3 ms 13C acquisition time, a 3 s interscan delay, and a 1JC–H coupling constant of 145 Hz. Eight scans were conducted, and each spectrum was recorded for 3 h.
Quantitative 13C NMR spectra were recorded using a single pulse experiment with 1H decoupling during the acquisition and a 20° radiofrequency pulse, a repetition delay 6 s and 12![[thin space (1/6-em)]](https://www.rsc.org/images/entities/char_2009.gif) 600 signal accumulations. We have run in addition the same experiment using a repetition delay of 12 s for comparison, and the largest variation when comparing the integrals of these two experiments was 7%. The error in the integrals when comparing with the same region of noise were below 1%. Hence, we chose the largest error, 7%, to be added to the molar substitution values shown in Table 2.
600 signal accumulations. We have run in addition the same experiment using a repetition delay of 12 s for comparison, and the largest variation when comparing the integrals of these two experiments was 7%. The error in the integrals when comparing with the same region of noise were below 1%. Hence, we chose the largest error, 7%, to be added to the molar substitution values shown in Table 2.
Determination of the molar substitution (MS)
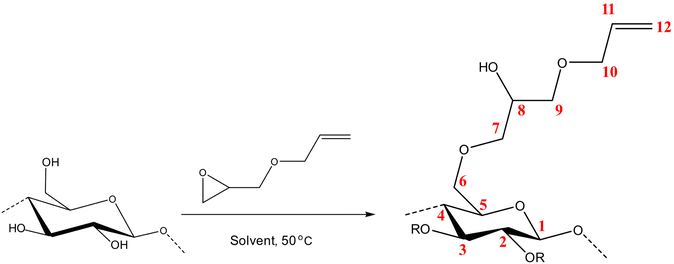
The molar substitution (MS, reflecting average number of moles of the substituent introduced per each anhydroglucose unit) of AHP-cellulose was estimated according to quantitative 13C NMR based on the integral as follows (numbering of carbons is according to Scheme 2):Results and discussion
Investigation of the course of reaction via in situ FTIR spectroscopy
Fig. 1 shows the FTIR in situ monitoring traces of the reaction in Triton B and its corresponding 3D plot. The spectra shown in different colours are collected at a 1-minute interval each within 2 h.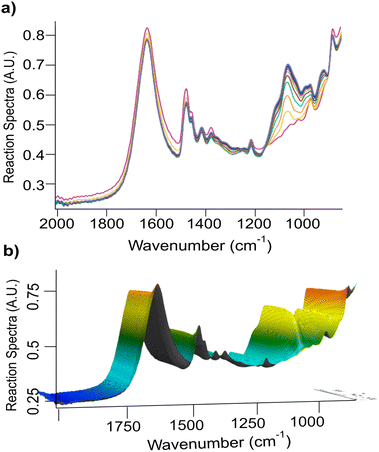 | ||
| Fig. 1 (a) Overview of cellulose etherification for 2 h in Triton B, and (b) its corresponding 3D plot as followed by in situ FTIR spectroscopy. | ||
The requisite to follow the course of a reaction (Scheme 2) is to identify a set of absorption bands specific for the reagents or products. Here, the addition of AGE to cellulose solutions results in a number of peaks that can be assigned as follows: ![[double bond, length as m-dash]](https://www.rsc.org/images/entities/char_e001.gif) C–H at 924 cm−1, C–O at 1028 cm−1, C
C–H at 924 cm−1, C–O at 1028 cm−1, C![[double bond, length as m-dash]](https://www.rsc.org/images/entities/char_e001.gif) C at 1675 cm−1 and C–H scissoring at 1465 cm−1. Furthermore, the oxirane ring shows three characteristic vibrations around 1253 cm−1, 810–950 cm−1 and 750–840 cm−1. Yet, not all the detectable absorption bands can be used as indicative of the reaction progression, mainly due to multiple overlapping with the peaks from side-products, solvents, or cellulose. For example, C
C at 1675 cm−1 and C–H scissoring at 1465 cm−1. Furthermore, the oxirane ring shows three characteristic vibrations around 1253 cm−1, 810–950 cm−1 and 750–840 cm−1. Yet, not all the detectable absorption bands can be used as indicative of the reaction progression, mainly due to multiple overlapping with the peaks from side-products, solvents, or cellulose. For example, C![[double bond, length as m-dash]](https://www.rsc.org/images/entities/char_e001.gif) C characteristic band which can be an indicative of the reagent dissolution overlaps with water peak at 1640 cm−1 cannot provide us with trustworthy information.
C characteristic band which can be an indicative of the reagent dissolution overlaps with water peak at 1640 cm−1 cannot provide us with trustworthy information.
As expected for an etherification reaction, the region between 900–1100 cm−1 comprises the most prominent absorption changes originating from the action of the etherification reagent. Moreover, it can be noticed that the water peak at 1640 cm−1 and the carbonate peak at 1480 cm−1![[thin space (1/6-em)]](https://www.rsc.org/images/entities/char_2009.gif) 31 show a slight decrease. The former due to a small water loss and the latter most likely due to elimination of atmospheric CO2 when performing the reaction under N2. In order to more specifically determine relevant absorption bands to follow, several model and reference reactions have been performed.
31 show a slight decrease. The former due to a small water loss and the latter most likely due to elimination of atmospheric CO2 when performing the reaction under N2. In order to more specifically determine relevant absorption bands to follow, several model and reference reactions have been performed.
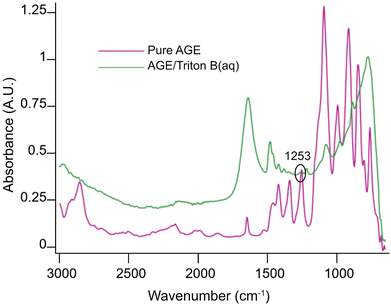
Initially, spectra of pure AGE and AGE in aqueous Triton B were selected as references and superimposed in Fig. 2. According to this figure and since AGE does not immediately dissolve in these aqueous bases (addition of AGE to the selected solvents initially creates a biphasic solution after which a complete dissolution is yielded), one possible way of monitoring the reaction is to follow oxirane ring peak in AGE. The objective behind selecting this peak was first to monitor AGE dissolution as the signal absorbance increases while dissolving. Secondly, this peak allows us to monitor AGE consumption during the course of reaction as oxirane ring is exposed to ring opening which will result in the decrease in its absorbance. Thus, the peak at 1253 cm−1 was selected and its changes during the course of reaction in different solvents were compiled in Fig. 3.
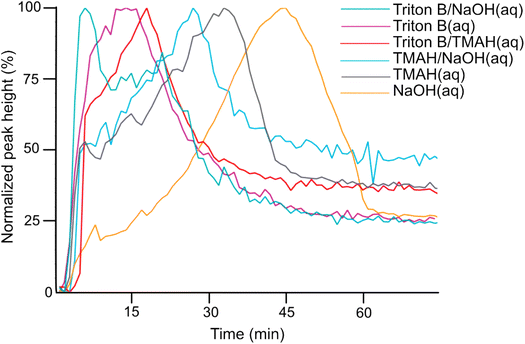
According to Fig. 3, the trends clearly disclose an initial increase showing AGE dissolution in aqueous alkaline media followed by a decrease indicating reagent consumption and finally a plateau. It is evident that AGE in NaOH(aq) takes longer time to be dissolved and consumed compared to other studied bases and base combinations. In addition, this figure discloses the highest solubility of AGE in aqueous Triton B-containing solutions, decreasing somewhat in TMAH and TMAH/NaOH(aq). The high AGE solubility in Triton B and TMAH-based solutions is a prerequisite for an efficient homogeneous modification reaction, but also for the reagent hydrolysis.
In another attempt, the region between 900–1100 cm−1 was chosen for further investigation in different reaction media. The overview of the absorption changes in this region during the reaction time is depicted in Fig. 4.
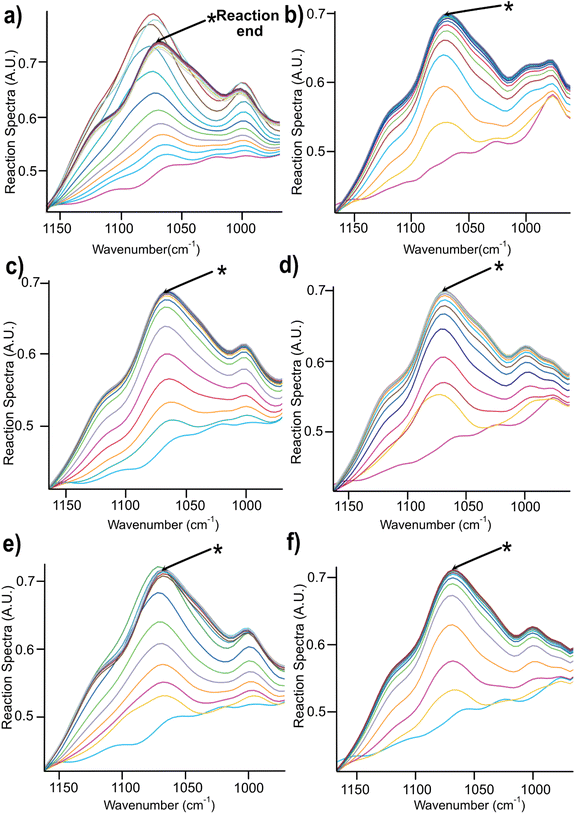 | ||
| Fig. 4 Changes in the spectra region between 900–1100 cm−1 during the course of reaction for 2 h in (a) NaOH (b) Triton B (c) TMAH (d) Triton B/NaOH (e) TMAH/NaOH (f) TMAH/Triton B. | ||
A closer look at Fig. 4 reveals that in most of the reaction media as the etherification reaction progresses the height of the peaks increased up to a certain point after which the spectra remained unchanged except for NaOH (Fig. 4a) where a decrease was detected after reaching its maximum. This decrease is interpreted as cellulose precipitation which occurred 46 minutes after the reaction was initiated. Cellulose in aqueous alkali is known to be less stable at elevated temperatures leading to its precipitation and as a result disappearance of signals from the IR probe (the probe can only detect the dissolved state) and thus its decrease in height (absorbance). The same trend but to a much lower extent was detected when using TMAH/NaOH(aq), however, other solutions remained stable during the reaction time. It is noteworthy to mention that all cellulose solutions remained transparent during the course of reaction except for NaOH which looked cloudy and turbid. Thus, stability of cellulose solutions at elevated temperatures in the selected quaternary ammonium hydroxides is highlighted pointing out that these solvents can be used for cellulose modification under homogeneous conditions.
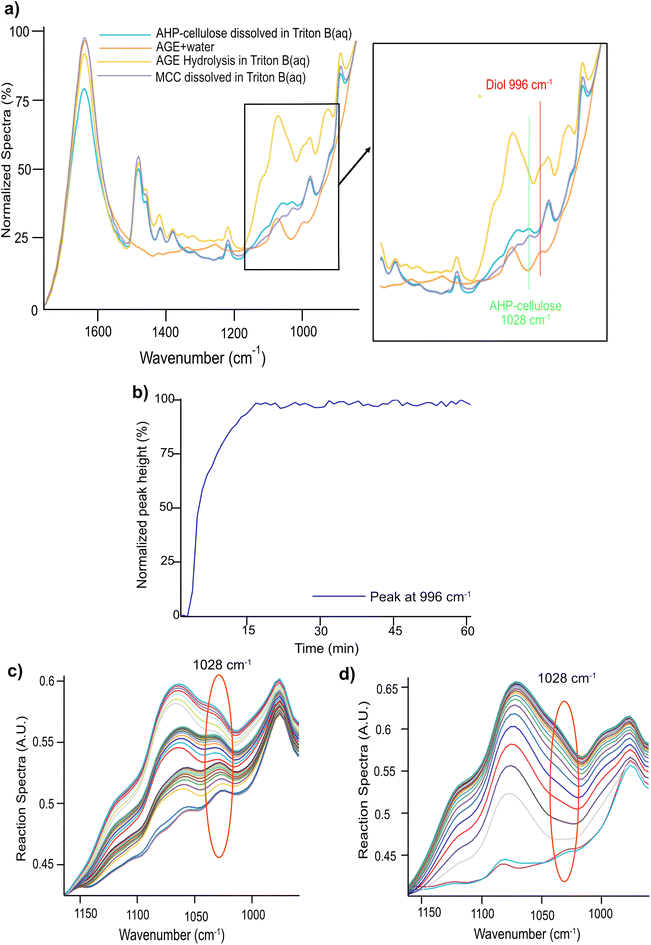
Nonetheless, the signals arising in this region are complex combining contributions from several concurrent processes: (a) a gradual dissolution of the reagent (b) a gradual hydrolysis of the reagent giving rise to a diol formation (Fig. 2, ESI†) and (c) etherification of cellulose comprising formation of an ether bond with a simultaneous substitution of a cellulose OH group (whether primary or secondary) and generation of a new secondary alcohol on C8 (Scheme 2). The absorption bands arising from these processes originate all from different types of C–O– moieties, hence, extensively overlap which makes the distinction of specific signals very challenging. To aid analysis of these signals and assign the peaks associated to cellulose, AGE, AHP-cellulose and diol, relevant reference spectra were collected and superimposed in Fig. 5a.
A detailed examination of Fig. 5a led to distinction of two different peaks: a peak at 996 cm−1 and a peak at 1028 cm−1. The former is unique to AGE reaction in the base indicative of AGE hydrolysis as it showed a clear increase throughout a model hydrolysis reaction of AGE (Fig. 5b) as well as during etherification reactions (Fig. 6). The latter peak at 1028 cm−1 was detected in both cellulose and AHP-cellulose probably combining contributions from different C–O moieties (e.g., hemiacetals and acetals from the cellulose backbone and ether bonds from the introduced substituents in the AHP-cellulose). This peak showed an increase during the course of etherification but since cellulose peak is not expected to increase during the reaction. We assumed that this increase might be an indication of cellulose etherification. Thus, in a trial to enable easier identification of absorption bands relevant to etherification and to assess whether there is a contribution of AGE hydrolysis, two experiments were run: (a) AGE hydrolysis in absence of MCC (Fig. 5c) (b) cellulose etherification while adding small AGE aliquots (to monitor even minor changes in etherification reaction of cellulose (Fig. 5d). Subsequently, a comparison analysis between the aforementioned experiments was carried out. As in Fig. 5c and d, the peak at 1028 cm−1 showed a continuous increase both during etherification and AGE hydrolysis. Changes at 1028 cm−1 detected upon addition of different AGE aliquots point out that this band indeed reflects structural changes essential for the etherification procedure. However, contribution from the etherification reaction could not be distinguished from the one from AGE hydrolysis. However, this might be less of a challenge if another reagent is selected with no additional C–O bonds. Since in this experiment no other distinct peaks corresponding to only etherification could not be detected, consequently, the only possible peak to follow was 996 cm−1.
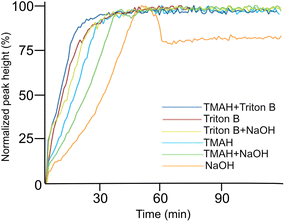
To further compare development of the peak at 996 cm−1 in different solutions, their trends from each medium were compiled in Fig. 6. The reactions show quite similar kinetic behaviour except for NaOH. The fastest hydrolysis was detected in Triton B/TMAH in which the trend reaches its maximum shortly after AGE addition followed by a plateau. While in NaOH, the peak takes longer time to approach its maximum height. Besides, a decrease in intensity of the peak after reaching its maximum is detected in NaOH followed by a plateau. One reason explaining this decrease might be that while cellulose is precipitating some of the reagent is captured and thus as a result the probe detects a decrease. However, more investigations are needed to find the real reasons behind this observation.
It is beneficial to know the endpoint of the reaction specifically when working with cellulose in aqueous alkali at higher temperature to avoid its further degradation. Using in situ IR spectroscopy enabled us to estimate the reaction endpoint by detecting the time after which the absorption in the C–O region remained unchanged. It should be emphasized that in this interpretation the reaction endpoints do not only refer to etherification but to any changes occurring in the studied region, including the hydrolysis of the reagent too (Table 1).
| Solvent | Reagent consumption time (min) |
|---|---|
| NaOH | 46 (precipitation time) |
| Triton B | 28 |
| TMAH | 35 |
| Triton B/NaOH | 46 |
| TMAH/NaOH | 47 |
| Triton B/TMAH | 27 |
As indicated above, important factors contributing to the reaction rate are the solubility of the reagent in the reaction medium and the stability of the solutions. According to Table 1, Triton B as well as TMAH/Triton B have similar reaction times taking the least amount of time to reach their end point. Thus, it seems that TMAH addition to Triton B does not improve the kinetics of the reaction, however, the reasons remain to be investigated. Etherification in other solvents took relatively longer time among which cellulose in NaOH started to precipitate after 46 minutes.
Can in situ rheology measurements be used to check the homogeneity and endpoint of the reaction?
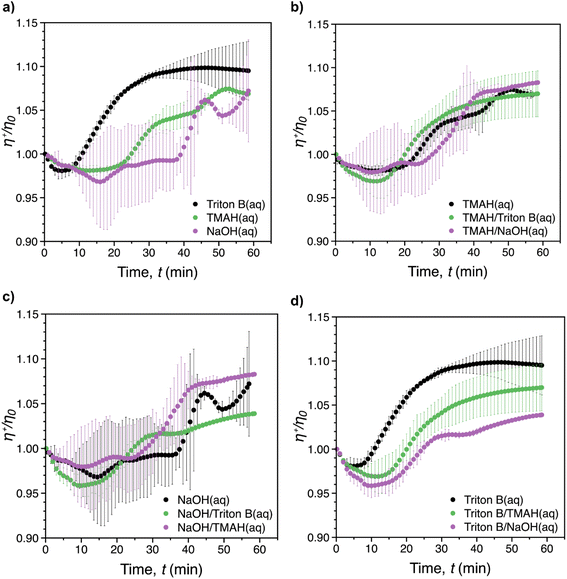
Fig. 7 shows the reduced transient viscosity, η+/η0, where η+(t) is the instantaneous transient viscosity and η0 is the viscosity at t = 0, vs. time for all of solvents. A similar behaviour was observed in all of the reaction media, with an initial viscosity decrease (reflecting probably initial dilution of the system upon AGE addition), followed by an increase (reflecting progression of the reaction and probably formation of AHP-cellulose with higher molecular weight) until the maximum viscosity was reached within the measurement time (60 min). However, increase in viscosity during the course of the reaction was limited to less than 15% above the starting viscosity. It should be noted that mixing rate during the rheological measurements would be expected to be lower compared to when it is performed overhead stirrers. This is due to the laminar flow that characterizes viscometric flows.As depicted in Fig. 7a, the fastest viscosity increase was reached after ca. 40 min in Triton B. This was longer than the reaction time recorded in the in situ IR experiments (28 min) confirming that the mixing rate was lower during rheological measurements. In contrast to Triton B that showed a smooth viscosity variation, significant distortions were noticeable for NaOH. The same distortion but to less extent was observed for TMAH alone and in combination with NaOH. This is probably due to the formed cellulose aggregates which were observed when running the reactions in NaOH, TMAH as well as TMAH/NaOH by the end of the rheological measurements in the measuring cylinder. These inhomogeneities were formed as a result of less optimal mixing conditions making the aggregates travel up in the cylinder and interfere with the measurements resulting is distortions. Another consequence of not having optimal mixing conditions was that, except for Triton B, the maximum viscosity corresponding to the completion of the reaction could not be determined. In addition, due to the large variability between the repeated tests, it was not possible to determine which reaction media would result in the highest increase in shear viscosity.
As indicated in Fig. 7b–d, the presence of Triton B in combination with all measured solvents affected the reaction kinetics significantly by increasing the smoothness of the curves. In turn, cellulose interaction in NaOH resulted in a slower and inhomogeneous viscosity increase, confirmed by in situ IR spectroscopy measurements as well. In addition, similar temperature instability was observed in NaOH as well as in NaOH/TMAH. These findings indicate that when Triton B is used as the solvent in cellulose solutions either alone or in combinations, temperature stability of the solutions is higher. In addition, the importance of mixing rate as well as homogeneous mixing where all the solution is mixed equally is highlighted when modifying cellulose in aqueous alkaline systems specially at high temperatures since these solutions are prone to aggregation. In this study, a full comparison between individual systems was not possible due to limited mixing rate possibility in rheometric flows and the resulting aggregates. Still, in situ rheology measurements can be used a valuable tool to provide a complementary study to evaluate the temperature stability of the systems and give an insight into the kinetics of the reactions provided that optimal reaction conditions are applied.
Product characterization and estimation of the substitution
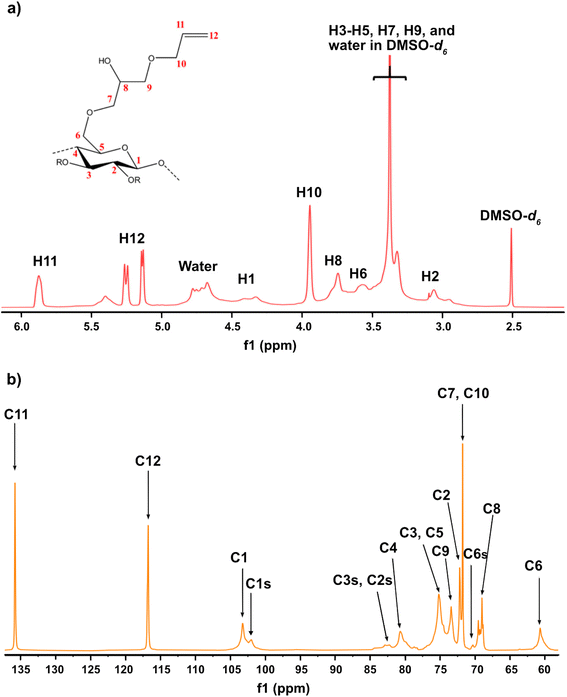
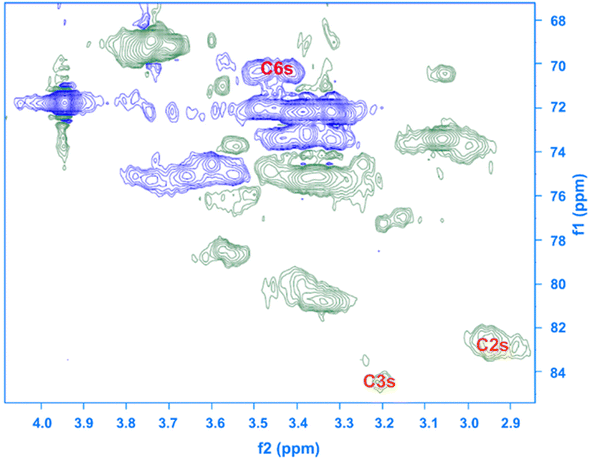
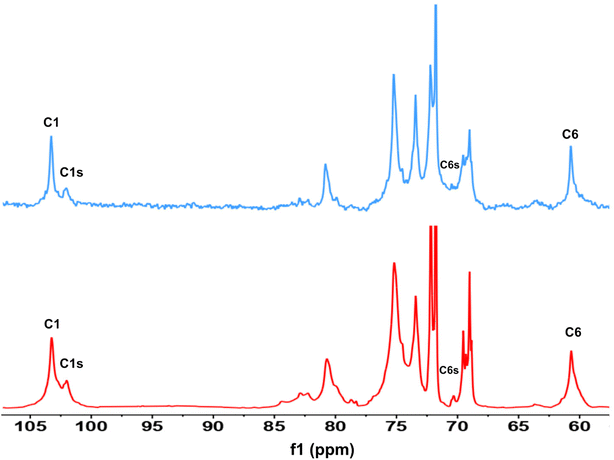
Given the results of the in situ monitoring (pointing out the effect of the solvent base composition both on stabilization of the solutions and hydrolysis of the reagent), it becomes essential to investigate their influence on the etherification products. Initially, ATR-FTIR spectra of unmodified cellulose and AHP-cellulose yielded in NaOH, Triton B, TMAH as well as mixtures of the mentioned bases have been collected which confirmed the product formation (Fig. 3, ESI†). To further confirm the product synthesis NMR measurements were run.Both 1H NMR and quantitative 13C NMR confirmed AHP-cellulose synthesis (Fig. 8a and b). When cellulose is substituted, all the substituted positions (C2, C3 and C6) show different chemical shifts. Furthermore, it has been reported that upon cellulose functionalization the adjacent carbons (C1 and C4) show upfield chemical shifts.32,3313C NMR spectra (Fig. 8b) showed a partial substitution on all cellulose hydroxyl groups at 70.32, 82.25, 82.89 and 102.02 ppm attributed to substituted C6, C2 and C3 and C1 (as a result of C2 substitution) respectively, which could also be confirmed by HSQC analysis for all the studied solvent systems (Fig. 9). NMR spectra of AHP-cellulose isolated from other solvents can be found in the ESI.†
However, in this reaction as a result of cellulose etherification via epoxy ring opening, a new OH group is introduced on position 8 of the substituent (Scheme 2) with the possibility of reacting further with another AGE (through the so-called cascade reaction, Fig. 14 in ESI†). Therefore, the values obtained from integration in 13C NMR were reported as molar substitution (MS) referring to the total amount of substitution sitting on each glucose ring. This value points out the possibility of introduction of multiple AGE to the same initial position on cellulose summarized in Table 2 (reported as average number of moles of the substituent introduced per each anhydroglucose unit). This approach is straight forward as all C1 carbons, also those shifted due to a nearby substitution, will appear between 100 and 105 ppm without any overlap of other peaks. It is notable to mention that efforts have been made to assess the degree of substitution (DS) of individual cellulose carbons too following the recently reported procedure by Kono et al.34 however, in this study, the estimation of the substitution distribution was not possible due to heavy overlap of the signals and complex line shapes of the peaks.
| Sample | MS |
|---|---|
| NaOH | 1.49 ± 0.10 |
| TMAH | 0.88 ± 0.06 |
| TMAH/Triton B | 0.81 ± 0.06 |
| Triton B | 0.79 ± 0.06 |
| Triton B/NaOH | 0.79 ± 0.06 |
| TMAH/NaOH | 0.79 ± 0.06 |
Essential to consider was that the same cascade reaction is possible when AGE is hydrolyzed to a diol capable of further reacting with AGE and creating a higher molecular structure that might be retained within the cellulose network during the dialysis work-up. To make sure that the isolated product did not include any such by-products, AGE and the solvents were allowed to react in absence of MCC and the same work up procedure was performed to isolate the products. As no products were obtained after freeze drying, it was concluded that the isolated AHP-cellulose did not contain any AGE-related by-products.
The highest MS value of 1.49 was obtained when the reaction was carried out in NaOH while the other obtained values were lower (0.79–0.88) and quite similar to each other. This result was quite unexpected since our previous observations showed lower temperature stability of cellulose solutions in NaOH and lower solubility of the reagent in this medium. Thus, there remained this question whether this high MS value represents more cellulose substitution in NaOH compared to other solvents? In order to answer this question several results and observations were required to be considered as follows.
First, assessment of the HSQC spectra (Fig. 9) showed that hydroxyl groups attached to C2, C3 and C6 have been functionalized with no significant deviations between the studied solvents. In addition, AHP-cellulose obtained in NaOH had lower solubility in DMSO-d6 when running NMR compared to AHP-cellulose yielded in other solvents. While a more substituted product would have had higher solubility in DMSO-d6. Peak intensities can be compared when the linewidth of the peak is similar, which is the case for our samples, otherwise peak integrals must be considered. The obtained 13C NMR spectrum for AHP-cellulose yielded in NaOH was very similar to other 13C NMR spectra (Fig. 10) except for the higher intensity of C1 and the lower intensity of C1s. This observation is in contrast with the fact that higher DS values result in lower intensity of C1 and C6 and increase in intensity of C1s and C6s.35 Reflecting on in situ IR spectroscopy results, AGE has lower solubility in NaOH and as shown in Fig. 3 and Table 1, cellulose in NaOH solution starts to precipitate when AGE reaches it maximum dissolution (ca. after 45 minutes). Taking into account the mentioned observations together with better cellulose solubility in TMAH and Triton B reported in previous works29,30 better AGE solubility and higher temperature stability of the solutions except for NaOH (Fig. 4), a probable indication could be more occurrence of cascade reaction in NaOH. Most likely cellulose precipitation causes lower accessibility of cellulose hydroxyl groups for etherification while on the other hand it is possible that the new hydroxide group formed on the substituent C8 (Scheme 2) reacts with AGE promoting cascade reaction (resulting in high MS value). Thus, it seems that this high value results from multiple AGE substitution sitting on the substituent itself which is subject to further investigation.
It is worth mentioning that the substitution pattern is likely rather uneven, since none of the obtained AHP-cellulose were soluble in D2O as even distribution of the substituent with comparable introduction of the substituent usually yields D2O soluble material.36
Conclusions
Homogeneous etherification of cellulose through epoxy ring opening proceeds with a comparable rate to the competing hydrolysis of the etherification reagent. For the latter, the solubility of the reagent in the reaction medium seems to be decisive. Bases promoting dissolution of a relatively non-polar reagent such as QAHs will thus also promote reagent hydrolysis compared to NaOH(aq) where both dissolution and hydrolysis of the reagent are slower. Here, a clear effect of the hydrophobicity of the base could be observed, as the more hydrophobic Triton B dictated a faster reagent hydrolysis and lower DS, compared to the less hydrophobic TMAH. Combining the QAHs with NaOH(aq) as a reaction medium, does not seem to slow down the reagent hydrolysis, probably as the presence of QAHs efficiently mediates reagent dissolution regardless of the NaOH(aq). Interestingly, from the cellulose solubility point of view, the presence of QAHs is desirable as it provides more homogeneous and stable reaction conditions throughout the reaction. In addition, in the reaction media containing QAHs homogeneous conditions were largely maintained (even when combined with NaOH(aq)). Although limited by the overlapping of the absorption bands, in situ FTIR can provide a useful fingerprint of the reaction enabling estimation of the reaction time and monitoring of some major chemical conversions (e.g. epoxide ring opening and AGE hydrolysis) as well as solution stability during the reaction. In this regard, in situ IR spectroscopy proved to be a valuable tool in selection of the solvent providing more information on side reactions which is critical to be considered when selecting a reagent. Aided by this technique, the end of the reaction can be detected to save energy and avoid material loss. Moreover, in situ viscosity measurements allow complementing real-time insight in the homogeneity of the reaction mixture, which is invaluable information considering inherent instability of these solutions over time, at elevated temperatures in particular. All the solvents except NaOH yielded similar lower MS values in comparison with NaOH. Yet, the high value in NaOH is an indicative of excessive cascade reaction as a result of low AGE solubility, low temperature stability of cellulose solution in NaOH and thus lower accessibility of cellulose OH groups to AGE. None of the bases were observed to exert any regioselectivity on the monomer level, as the AHP-cellulose showed substitution on all three available hydroxyl positions without any significant variations among the different bases. Based on these findings, we state that cellulose etherification can be influenced by tuning the base composition of the reaction medium: though QAHs promote reagent dissolution they seem to lead to lower cascade reaction. In addition, NaOH is cheap, readily available and non-toxic, yet due to the low thermal stability of cellulose solutions in NaOH(aq), its combination with another solvent providing better stability to cellulose solutions, such as Triton B, can be a good alternative to promote cellulose modification. Although the present study is mainly qualitative since the quantitative analysis of the spectroscopic data (both NMR and FTIR) was often hampered by overlapping signal, some important trends and characteristics of the cellulose etherification as well as the side reaction could be pointed out. The study also stresses the importance of employing complementary methods (here FTIR, rheometry and NMR) and a comparative approach along with critical analysis of the spectroscopy data when investigating so challenging systems.Author contributions
Shirin Naserifar: Conceptualization, methodology, data curation, formal analysis, investigation, visualization, writing – original draft. Petrus F. Kuijpers: Investigation, methodology, formal analysis, writing – review & editing. Sylwia Wojno: Methodology, rheology data curation, rheology formal analysis, rheology writing – original draft, writing – review & editing. Roland Kádár: Methodology, rheology data curation, formal analysis, writing – review & editing. Diana Bernin: NMR data curation, methodology, NMR formal analysis, investigation, writing – review & editing, supervision. Merima Hasani: Conceptualization, writing – review & editing, supervision, project administration, funding acquisition.Conflicts of interest
The authors confirm that there are no conflicts to declare.Acknowledgements
The Knut and Allice Wallenberg Foundation is gratefully acknowledged for financial support within Wallenberg Wood Science Center and the Swedish NMR Centre is acknowledged for providing spectrometer time.References
- H. Shaghaleh, X. Xu and S. Wang, RSC Adv., 2018, 8, 825–842 RSC.
- C. Johansson, J. Bras, I. Mondragon, P. Nechita, D. Plackett, P. Šimon, D. G. Svetec, S. Virtanen, M. G. Baschetti, C. Breen, F. Clegg and S. Aucejo, BioResources, 2012, 7, 2506–2552 Search PubMed.
- H. Seddiqi, E. Oliaei, H. Honarkar, J. Jin, L. C. Geonzon, R. G. Bacabac and J. Klein-Nulend, Cellulose, 2021, 28, 1893–1931 CrossRef CAS.
- X. Bao, C. Wang, Z. Zhang, Q. Cao, F. Liu, J. Chen, C. Zhang, H. Na and J. Zhu, Carbohydr. Polym. Technol. Appl., 2021, 2, 100099 CAS.
- T. Heinze, O. A. El Seoud and A. Koschella, Etherification of Cellulose, Springer, 2018 Search PubMed.
- D. S. U. Cha and M. S. Chinnan, Crit. Rev. Food Sci. Nutr., 2004, 44, 223–237 CrossRef CAS PubMed.
- S. Spirk, Polysaccharides in Batteries, Springer, 2018 Search PubMed.
- K. J. Edgar, C. M. Buchanan, J. S. Debenham, P. A. Rundquist, B. D. Seiler, M. C. Shelton and D. Tindall, Prog. Polym. Sci., 2001, 26, 1605–1688 CrossRef CAS.
- T. M. Aminabhavi, G. V. Patil, R. H. Balundgi, F. Sujata, F. V. Manvi and C. Bhaskar, Des. Monomers Polym., 1998, 1, 347–372 CrossRef CAS.
- J. Strnadova and M. Ďurovic, Restaurator, 1994, 15, 220–241 CAS.
- R. Badulescu, V. Vivod, D. Jausovec and B. Voncina, Carbohydr. Polym., 2008, 71, 85–91 CrossRef CAS.
- M. Dolz, J. Jiménez, M. J. Hernández, J. Delegido and A. Casanovas, J. Pet. Sci. Eng., 2007, 57, 294–302 CrossRef CAS.
- J. Petit and E. Wirquin, Int. J. Adhes. Adhes., 2013, 40, 202–209 CrossRef CAS.
- X. Zhang, R. L. Kreeger, E. F. Diantonio, W. K. Li and T. Drovbetskaya, US 2010/0132132 A1, 2010, 1–5.
- H. E. T. Hielking, W. C. Gmbh and C. Kg, Cellulose Ethers, Wiley-VCH Verlag GmbH & Co. KGaA, 2012 Search PubMed.
- E. Möllmann, T. Heinze, T. Liebert and S. Köhler, EP2098539A8, 2009.
- A. Isogai, A. Ishizu and J. Nakano, J. Appl. Polym. Sci., 1984, 29, 3873–3882 CrossRef CAS.
- A. Takaragi, M. Minoda, T. Miyamoto, H. Q. Liu and L. N. Zhang, Cellulose, 1999, 6, 93–102 CrossRef CAS.
- T. F. Liebert and T. J. Heinze, Biomacromolecules, 2001, 2, 1124–1132 CrossRef CAS PubMed.
- J. Zhou, Y. Qin, S. Liu and L. Zhang, Macromol. Biosci., 2006, 6, 84–89 CrossRef CAS PubMed.
- J. M. Lopes and Á. Mart, ChemEngineering, 2017, 1, 1–28 CrossRef.
- B. Tosh, C. N. Saikia and N. N. Dass, Carbohydr. Res., 2000, 327, 345–352 CrossRef CAS PubMed.
- L. Lilienfeld, US1771462A, 1930.
- C. Zhong, C. Wang, F. Wang, H. Jia, P. Wei and Y. Zhao, Carbohydr. Polym., 2015, 136, 979–987 CrossRef PubMed.
- M. Gubitosi, H. Duarte, L. Gentile, U. Olsson and B. Medronho, Biomacromolecules, 2016, 17, 2873–2881 CrossRef CAS PubMed.
- J. A. Sirvio and J. P. Heiskanen, Cellulose, 2020, 27, 1933–1950 CrossRef CAS.
- M. Abe, Y. Fukaya and H. Ohno, Chem. Commun., 2012, 48, 1808–1810 RSC.
- Y. Wang, L. Liu, P. Chen, L. Zhang and A. Lu, Phys. Chem. Chem. Phys., 2018, 20, 14223–14233 RSC.
- B. Swensson, A. Larsson and M. Hasani, Cellulose, 2020, 27, 101–112 CrossRef.
- B. Swensson, A. Larsson and M. Hasani, Polymers, 2020, 12, 1310 CrossRef CAS PubMed.
- B. J. Ha and S. Park, Biomater. Res., 2018, 22, 202–209 Search PubMed.
- S. Takahashi, T. Fujimoto and B. M. Barua, J. Polym. Sci., Part A: Polym. Chem., 1986, 24, 2981–2993 CrossRef CAS.
- J. Zhou, L. Zhang, Q. Deng and X. Wu, J. Polym. Sci., Part A: Polym. Chem., 2004, 42, 5911–5920 CrossRef CAS.
- H. Kono and J. Numata, Carbohydr. Res., 2020, 495, 108067 CrossRef CAS PubMed.
- T. Miyamoto, Y. Sato, T. Shibata and H. Inagaki, J. Polym. Sci., Polym. Chem. Ed., 1984, 22, 2363–2370 CrossRef CAS.
- S. Richardson and L. Gorton, Anal. Chim. Acta, 2003, 497, 27–65 CrossRef CAS.
Footnote |
| † Electronic supplementary information (ESI) available. See DOI: https://doi.org/10.1039/d2py00231k |
| This journal is © The Royal Society of Chemistry 2022 |

