 Open Access Article
Fabrication of an antifouling PES ultrafiltration membrane via blending SPSF
Xin Wen a,
Can He*b,
Yuyan Haib,
Rui Mab,
Jianyu Sunb,
Xue Yangb,
Yunlong Qib,
Hui Weib and
Jingyun Chenb
aCollege of Geology and Environment, Xi'an University of Science and Technology, Xi'an 710054, China
bNational Institute of Clean-and-Low-Carbon Energy, Beijing 102211, China. E-mail: can.he.a@chnenergy.com.cn
First published on 7th January 2022
Abstract
Sulfonated polysulfone (SPSF) with different sulfonation degrees (10%, 30%, and 50%) was added to polyethersulfone (PES) to improve the separation and antifouling performance of polyethersulfone ultrafiltration membranes. The PES/SPSF blend ultrafiltration membrane was prepared by the non-solvent induced phase inversion method (NIPS), and the effect of sulfonation degree on the ultrafiltration performance was studied. The compatibility of SPSF and PES was calculated by the group contribution method, and confirmed by differential scanning calorimetry (DSC). The morphology and surface roughness of the membrane were characterized by scanning electron microscopy (SEM) and atomic force microscopy (AFM), the chemical composition of the membrane was analyzed by X-ray photoelectron spectroscopy (XPS) and infrared spectroscopy (FTIR), and the permeability and anti-fouling performance of the blend membrane were studied through filtration experiments. The research shows that the flux and anti-fouling performance of the blend membrane have been improved after adding SPSF. When the sulfonation degree of the SPSF is 30%, the pure water flux of the blend membrane can reach 530 L m−2 h−1, the rejection rate of humic acid (HA) is 93%, the flux recovery rate of HA increases from 69.23% to 79.17%, and the flux recovery rate of BSA increases from 72.56% to 83%.
1. Introduction
Membrane separation technology is widely used in water treatment and other fields due to its small footprint, high separation efficiency, low energy consumption, and simple and safe operation.1 As the core of membrane separation technology, the membrane material plays a vital role in the separation performance.2–4Polyethersulfone (PES) has good chemical, mechanical and thermodynamic properties, so it is widely used as a membrane material. However, the hydrophobicity of PES is the main reason for membrane fouling and permeability degradation.5 Therefore, improving the hydrophilicity of PES membrane materials is one of the research hotspots for the majority of scholars.6
Many approaches are available to improve the hydrophilicity of PES membranes, such as blending, surface grafting and surface coating.7–9 Surface grafting modification has the disadvantages of complicated process and high cost, and the modifier can easily fall off during the surface coating process; blending modification has become one of the effective strategies for membrane modification due to its simple process, convenient operation and relatively low cost.10–13
A more suitable compatibility between polymers is a prerequisite for effective blending. Poor compatibility between polymers would not only lead to irregularities in the membrane surface, but also result in streaks and macropores in the membrane due to the self-assembly of individual polymers.6 A method to overcome this problem is to introduce specific functional groups into the polymers to form specific interactions between the polymers, such as hydrogen bonds, electrostatic interactions, ion–dipoles or charge transfer.14 Bowen et al.15 found that a small amount of sulfonated polyetheretherketone (SPEEK) incorporated with PSF would increase the water flux, salt rejection and porosity of PSF membranes. Xie et al.16 fabricated PVC/SPSF UF membranes successfully via the NIPS method. The results confirmed the excellent compatibility between PVC and SPSF. The PVC/SPSF blend membranes exhibited significantly enhanced hydrophilicity, which resulted in improvement of the water permeability and antifouling property. Then, the newly-prepared membrane (M50) showed the highest PWP (880 L m−2 h−1 bar−1) compared with the previously reported PVC membranes, and the BSA rejection was as high as 95.7% and FRR reached 96%. Ma et al.17,18 reported the preparation of PES/SPSF blend membranes with different sulfonation degrees by a phase inversion method with ice-water as a coagulant and investigated the effect of polymer concentration and additives of the casing solution (such as acetone, ether and tetrahydrofuran) on the performance of PES/SPSF blend membranes via a dry–wet phase inversion method. The results demonstrated that the blend UF membranes obtained with a finger-like asymmetrical structure showed a good rejection rate (99.8%) for poly(ethylene glycol) (PEG) (Mw = 1000 g L−1), while its low water permeate flux (27.2 L m−2 h−1) is ascribed to the dense and thick separation layer of the blend membrane. Liu et al.19 studied the influence of polyphenylsulfone with different sulfonation degrees on the manufacturing process and performance of ultrafiltration membranes. They found that the physical and chemical properties of the prepared membrane largely depend on the degree of sulfonation (SD), and the number of sulfonic groups on the polymer backbone has a great influence on the chemical, mechanical and thermal properties of the membrane. However, since polymers with a high degree of sulfonation are prone to swell in aqueous media, they cannot exhibit sufficient mechanical resistance. Therefore, SPSF with a hydrophilic functional group, a sulfonic acid group, was added into PES by blending. We used the surface segregation characteristics of the hydrophilic sulfonic acid groups in the membrane formation process to prepare a blended ultrafiltration membrane with high flux, high strength and high anti-fouling ability. In the actual application process of water treatment, it can improve the separation efficiency, increase the service life of the membrane, and reduce the cost of the enterprise, due to SPSF with different sulfonation degrees having a different number of hydrophilic functional sulfonic acid groups.
In this paper, the effect of the sulfonation degree (10%, 30%, and 50%) on the performance of the blend membrane was studied; the influence of the number of sulfonic acid groups on the structure and performance of the membrane and the compatibility between SPSF with different sulfonation degrees and PES was evaluated, and the surface chemical composition, morphology, hydrophilicity, permeability and antifouling performance of the blend membrane were systematically discussed.
2. Materials and methods
2.1 Materials
Polyethersulfone (PES) E6020P was provided by BASF; SPSF with sulfonation degrees of 10%, 30% and 50% was provided by Shandong Jinlan Company and dried in an oven at 70 °C for 24 hours before use. N,N-Dimethylacetamide (DMAc) was purchased from Aladdin. PEG 1000 (Mw = 1000 Da) that was used as a porogen, and humic acid (Fulvic acid ≥90%) and bovine serum albumin (BSA) that were used as fouling substances were provided by Macklin.2.2 Preparation of the blend membrane
The blend membranes were prepared via the non-solvent induced phase separation method. PES and SPSF were firstly dried in an oven at 80 °C for 24 hours. Then, PES, SPSF and PEG were dissolved in the solvent DMAc at 70 °C according to the ratios in Table 1 and magnetically stirred for 8 h. After standing for 12 h, the casting solution was spread evenly on a clean glass plate using a scraper with a 200 μm gap. The glass plate with the casted solution was immersed in deionized water (the deionized water in the coagulation bath was changed every two hours, and after three continuous changes, the membrane was kept in deionized water for 24 hours at 27 °C) to remove residual pore-forming agent and solvent. The membrane was kept in deionized water until the performance test was completed. The membranes that needed to be characterized or stored were dried at 40 °C for 24 hours. The composition of the casting solution is shown in Table 1.| Membrane | PES | SPSF | Degree of sulfonation (%) | PEG-1000 | DMAc |
|---|---|---|---|---|---|
| M0 | 18% | 0 | 0 | 7% | 75% |
| M1 | 15% | 3% | 10 | 7% | 75% |
| M2 | 15% | 3% | 30 | 7% | 75% |
| M3 | 15% | 3% | 50 | 7% | 75% |
2.3 Analytical method
Fourier transform infrared spectrophotometry (FTIR, Nicolet Impact 410) was performed in the range of 400–4000 cm−1 to analyze the chemical functional groups of the blend membrane. Scanning Electron Microscopy (SEM, Hitachi S4800) was conducted to evaluate the morphology of the membrane. X-ray photoelectron spectroscopy (XPS analysis, ESCALAB 250 spectrometer) was conducted to evaluate the elements on the membrane. Differential scanning calorimetry (DSC, TA dsc 25) was used to evaluate the compatibility between the polymers. The surface roughness of the membrane was measured by atomic force microscopy (AFM, Bruker Dimension ICON). The hydrophilicity of the membrane was evaluated by a water contact angle device (Drop Shape Analysis System DSA-30). Surface charge was measured using a surface electro-kinetic analyzer (SurPASS, Anton Paar GmbH, Austria) equipped with an adjustable gap cell using 1 mmol L−1 KCl solution as the testing solution.2.4 The evaluation methods of membrane performance
| δd = ∑Fdi/∑Vi | (1) |
 | (2) |
 | (3) |
| δt2 = δd2 + δp2 + δh2 | (4) |
In these formula, Fdi, Fpi, Ehi and Vi are the dispersion component, polarization component, hydrogen bond component and molar volume component of the molar attraction constant of the atom or group in the repeating structural unit, respectively.
 | (5) |
The porosity (ε) is calculated using eqn (6):
 | (6) |
The average pore radius (rm, nm) of the membrane was determined via the Guerout–Elford–Ferry equation (eqn (7)):
 | (7) |
 | (8) |
HA (500 mg L−1) was used to measure the rejection rate (R) of the membrane. The rejection rate (R) was calculated using eqn (9):
 | (9) |
 | (10) |
 | (11) |
 | (12) |
 | (13) |
3. Results and discussion
3.1 Compatibility of PES and SPSF
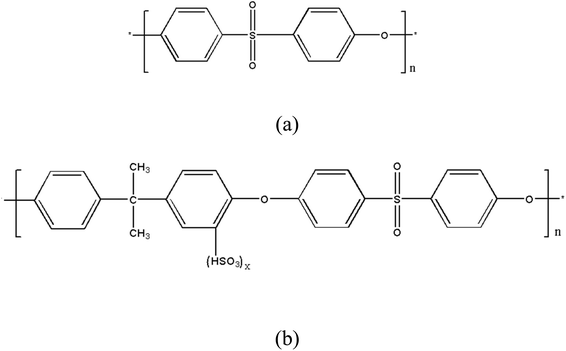
The contributions of the phenyl groups, sulfone groups, sulfonic acid groups and 1,2,4-trisubstituted phenyl groups in the polymer are shown in Table 2 (Fig. 1). The estimation of the Hansen parameters of PES and SPSF was shown in Table 3 (Table 3 shows the process of the calculating results in Table 4). As shown in Table 4, the Hansen parameters of the polyethersulfone and sulfonated polysulfone with different degrees of sulfonation were calculated according to eqn (1)–(4).20| Polymer | ∑Fdi | ∑Fpi2 | ∑Ehi | ∑Vi |
|---|---|---|---|---|
| a x represents the degree of sulfonation. | ||||
| PES | 3230 | 2![[thin space (1/6-em)]](https://www.rsc.org/images/entities/char_2009.gif) 315 315![[thin space (1/6-em)]](https://www.rsc.org/images/entities/char_2009.gif) 800 800 |
14![[thin space (1/6-em)]](https://www.rsc.org/images/entities/char_2009.gif) 300 300 |
173.5 |
| SPSF | 5602 + 800x | 3![[thin space (1/6-em)]](https://www.rsc.org/images/entities/char_2009.gif) 436 436![[thin space (1/6-em)]](https://www.rsc.org/images/entities/char_2009.gif) 200 + 23 200 + 23![[thin space (1/6-em)]](https://www.rsc.org/images/entities/char_2009.gif) 816 816![[thin space (1/6-em)]](https://www.rsc.org/images/entities/char_2009.gif) 00x 00x |
17![[thin space (1/6-em)]](https://www.rsc.org/images/entities/char_2009.gif) 300 + 313 300 + 313![[thin space (1/6-em)]](https://www.rsc.org/images/entities/char_2009.gif) 00x 00x |
308.5 + 42.2x |
According to literature reports,21 polymer compatibility depends on the similarity of Hansen's solubility parameters. As can be seen from Table 4, the solubility parameters of sulfonated polysulfone and polyethersulfone are close, so we infer that the blend system of sulfonated polysulfone and polyethersulfone is a compatible system.
| Polymer | δd (MPa1/2) | δp (MPa1/2) | δh (MPa1/2) | δt (MPa1/2) |
|---|---|---|---|---|
| PES | 18.62 | 8.77 | 9.07 | 22.07 |
| SPSF (10%) | 18.17 | 6.13 | 8.06 | 20.8 |
| SPSF (30%) | 18.19 | 6.34 | 9.11 | 21.3 |
| SPSF (50%) | 18.2 | 6.52 | 9.94 | 21.72 |
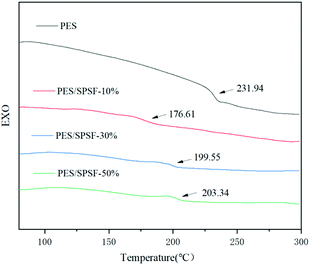
Another way to determine the compatibility of polymers is differential scanning calorimetry. The glass transition temperatures of the blend membrane and its components were analyzed. If there is no interaction between the molecules, the blended system will have one and only one glass transition temperature; otherwise, incompatible systems will have two glass transition temperatures (Fig. 2).
The compatibility between PES and SPSF was confirmed by DSC. It can be seen from Fig. 4(a) that only one glass transition temperature (GTT) appears in the DSC curve of each membrane. This proves the excellent compatibility between the polymers.22,23
3.2 The characterization of the blend membranes
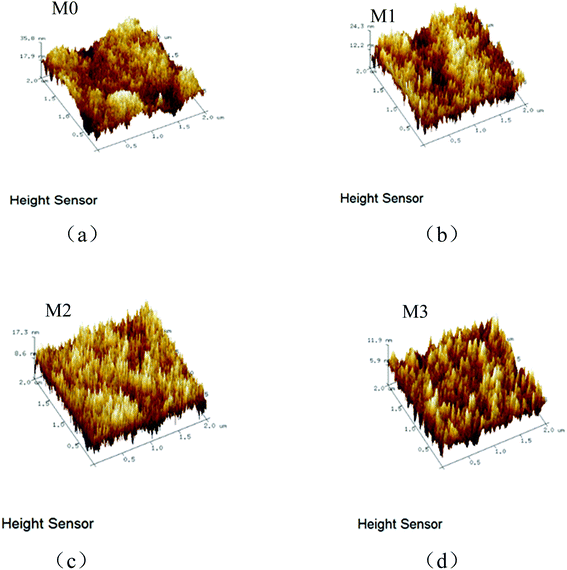
In order to study the influence of SPSF with different sulfonation degrees on the membrane structure, the morphology of the membranes was characterized by scanning electron microscopy (SEM). It can be seen from Fig. 3 that the pores of the membrane become wider and longer after SPSF is added. This is because the sulfonic acid group (HSO3−) has a strong affinity for water. In the phase inversion process, the exchange rate of solvent (DMAc) and non-solvent (H2O) is enhanced, resulting in instantaneous phase separation, thus forming wide and long pores.24–26 When adding SPSF with a sulfonation degree of 10%, a sponge structure appears in the cross section of M1. This is due to the hydrophilicity of the sulfonic acid group, which allows more water to enter the membrane surface during phase inversion. The water drastically increases the viscosity of the casting solution, the phase exchange rate becomes slower (the viscosity of the casting liquid increases faster than that of the hydrophilic functional group), and the formation of finger holes is inhibited, resulting in a thicker sponge-like sublayer structure.27 But with the sulfonation degree increasing, the number of hydrophilic sulfonate groups increases, and the steric hindrance of the sulfonic acid group and the intermolecular hydrogen bonding force cause the polymer chain to break, reducing the π–π accumulation between the aromatic rings, and thereby reducing the viscosity of the casting liquid. This will make the phase separation process easier. So when the SPSF has a sulfonation degree of 30%, the cross-section of M2 shows a combination of finger holes and sponge holes; when the SPSF has a sulfonation degree of 50%, smooth finger-like holes appear in the cross section of M3.28,29The surface morphologies of the PES/SPSF blend membranes with different sulfonation degrees were analyzed by AFM, as shown in Fig. 4. It can be seen from Fig. 4 and Table 5 that the roughness of the blend membranes shows a decreasing trend as the sulfonation degree increases. This is because the sulfonic acid group has extremely strong hydrophilicity and high dispersibility, which enhances its compatibility with the membrane matrix. So it has a good affinity with the PES molecular chains during the phase inversion process, thereby reducing the roughness and improving the anti-pollution performance.30
| Membrane | Ra | Rq | Rmax |
|---|---|---|---|
| M0 | 3.85 | 4.95 | 57.4 |
| M1 | 2.80 | 3.50 | 30.3 |
| M2 | 1.98 | 2.78 | 22.6 |
| M3 | 1.34 | 1.69 | 13.7 |
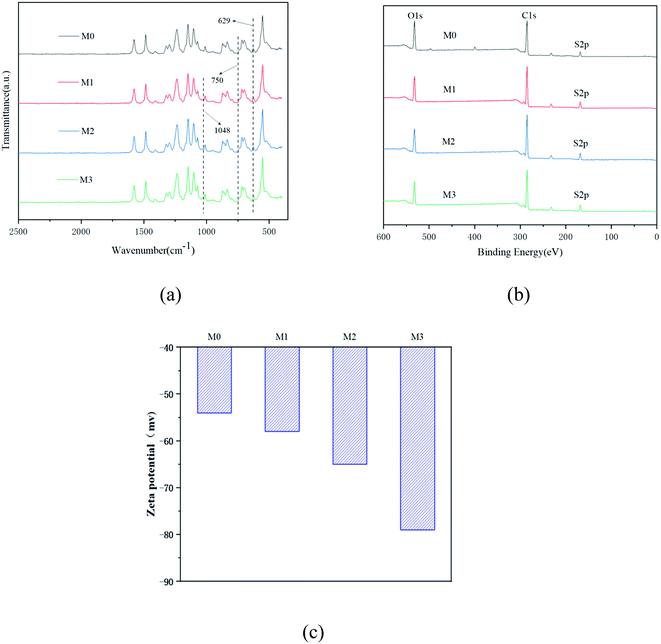
The FTIR spectra of the membranes are shown in Fig. 5(a). It can be seen that the stretching vibration and asymmetric stretching vibration of S![[double bond, length as m-dash]](https://www.rsc.org/images/entities/char_e001.gif) O in the sulfone group appear at 629 cm−1 and 750 cm−1 in M0–M3, indicating that the blend membranes were successfully prepared. After adding SPSF to the PES membrane, the spectrum of the blended membrane shows a symmetrical stretching vibration peak of S
O in the sulfone group appear at 629 cm−1 and 750 cm−1 in M0–M3, indicating that the blend membranes were successfully prepared. After adding SPSF to the PES membrane, the spectrum of the blended membrane shows a symmetrical stretching vibration peak of S![[double bond, length as m-dash]](https://www.rsc.org/images/entities/char_e001.gif) O in the sulfonic acid group at 1048 cm−1, indicating that the sulfonic acid group was successfully introduced into the ultrafiltration membrane.31 The XPS spectra of the membranes are shown in Fig. 5(b); it can be seen from Fig. 5(b) and Table 6 that when SPSF is added to the membrane, the area of the C–C peak on the membrane surface increases by varying degrees. This indicates that there is obvious surface segregation during the phase separation process, which is because the strong interaction between the hydrophilic SPSF chains and water during the mutual diffusion process makes more SPSF migrate to the membrane surface.32,33
O in the sulfonic acid group at 1048 cm−1, indicating that the sulfonic acid group was successfully introduced into the ultrafiltration membrane.31 The XPS spectra of the membranes are shown in Fig. 5(b); it can be seen from Fig. 5(b) and Table 6 that when SPSF is added to the membrane, the area of the C–C peak on the membrane surface increases by varying degrees. This indicates that there is obvious surface segregation during the phase separation process, which is because the strong interaction between the hydrophilic SPSF chains and water during the mutual diffusion process makes more SPSF migrate to the membrane surface.32,33
| M0 | M1 | M2 | M3 | |
|---|---|---|---|---|
| –C–C–peak area (%) | 49.19 | 55.72 | 59.36 | 56.42 |
| S peak area (%) | 4.87 | 5.77 | 5.85 | 5.86 |
The XPS spectrum of the membrane is shown in Fig. 5(b). From Fig. 5(b) and Table 6, it can be seen that when SPSF is added to the membrane, the area of the C–C peak on the membrane increases. This is because (1) the theoretical area value of the –C–C– peak in sulfonated polysulfone is higher than the –C–C– peak area in polyethersulfone; (2) more SPSF will migrate with the sulfonic acid groups to the membrane surface during the phase inversion process, which will increase the –C–C– peak area of the membrane surface after SPSF is added. When SPSF with a sulfonation degree of 30% is incorporated into PES, the –C–C– peak area on the membrane surface is the highest; this shows that in the phase separation process, the strong interaction between the hydrophilic SPSF chain and water in the mutual diffusion process causes more SPSF to migrate to the membrane surface. It can also be seen from the S element that the S content on the membrane with SPSF with a sulfonation degree of 30% is equivalent to that of the membrane with SPSF with a sulfonation degree of 50%. This also indicates that more SPSF with a sulfonation degree of 30% migrated to the membrane surface; that is, M2 has the strongest surface segregation.34
The zeta potential of the membrane at pH = 7 is shown in Fig. 5(c). As the sulfonation degree of the PES increases, the negative charge of the membrane surface gradually increases. This is because the SPSF molecular chain has negatively charged –SO3– groups; when the sulfonation degree of SPSF in the casting solution is increased, more negatively charged –SO3– groups will cover the membrane surface, which will lead to the negative charge of the membrane increasing. In addition, since the pollutants (BSA and HA) are all negatively charged, the stronger the negatively charged the membrane, the stronger the anti-pollution ability, which is consistent with the experimental conclusions.
3.3 Water absorption and porosity of the membrane
Water uptake and porosity play a decisive role in the transport mechanism and stability of the membrane. The water absorption (φ) and porosity (ε) results of the ultrafiltration membranes M0–M3 are shown in Table 7. It can be seen from Table 7 that compared with M0, the porosity, water absorption and pore size are increased after SPSF is added to the membrane. The reason may be that the sulfonic acid groups in SPSF are hydrophilic and can more easily exchange with water in the phase inversion process, thereby increasing the porosity and water absorption of the blend membrane. It can be seen from Table 7 that the contact angle of the membrane becomes smaller due to the addition of SPSF. This is because the hydrophilic HSO3− functional groups have a strong attraction to water molecules and form a hydration shell on the membrane.35–37| Membrane | φ (°) | ε (°) | Average pore size (nm) | Contact angle (θ) |
|---|---|---|---|---|
| M0 | 75.93 | 54.12 | 5.14 | 82.49 |
| M1 | 83.76 | 88.29 | 8.13 | 75.14 |
| M2 | 81.47 | 67.64 | 7.19 | 70.86 |
| M3 | 85.17 | 84.71 | 8.89 | 63.90 |
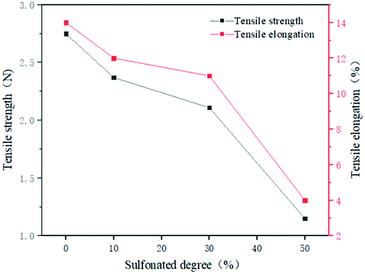
The tensile strength and tensile elongation of the membrane can be seen in Fig. 6. It can be seen that when SPSF with a sulfonation degree of 10% or 30% is added to PES, its tensile strength and tensile elongation are equivalent to that of PES, indicating that the blended membrane has good toughness and mechanical strength. When SPSF with a sulfonation degree of 50% is added to PES, the tensile strength and elongation at break of the membrane decrease sharply. The mechanical strength of the PES/SPSF decreases with increasing sulfonation degree. This is mainly because (1) the stronger hydrogen bonding of the sulfonic acid groups destroys the original cross-linking between the polymer molecules in the casting solution and (2) the sulfonic acid groups will cause the expansion of the polymer volume and increase the speed of the chain, which decreases the mechanical strength of the membrane.28
In order to evaluate the thermodynamic stability of the PES/SPSF blend system during the phase separation process, the cloud point (CP) of the casting solution blend system was measured, and the results are shown in Table 8. When SPSF is added, the amount of water required for the casting liquid to reach the cloud point also increases. This is because the SPSF with a high degree of sulfonation has a better affinity for water, resulting in a longer time for the solvent and non-solvent to diffuse before phase inversion.38 The more water is added to the casting solution, the higher the thermodynamic stability of the casting solution. Therefore, the addition of SPSF may be beneficial to enhance the thermodynamics of the casting solution.
| Membrane | Weight of casting solution/g | Weight of the added water/g |
|---|---|---|
| M0 | 20 | 1.59 |
| M1 | 20 | 1.74 |
| M2 | 20 | 1.86 |
| M3 | 20 | 1.76 |
3.4 The performance of the membrane
In this study, an ultrafiltration experiment was used to measure the permeability to evaluate the water treatment efficiency of the membrane, and a HA solution (500 mg L−1) was used as a pollutant to perform a circulating filtration experiment.Fig. 7 shows the flux and rejection rate of the membrane. It can be seen from Fig. 7 that the flux of the blend membrane is improved compared with the PES membrane (M0). This is mainly because the SPSF has a hydrophilic sulfonic acid group, which significantly improves the hydrophilicity of the PES membrane, and enhances the porosity and flux of the membrane.39 Surprisingly, the water flux of M2 is 1.9 times that of M0, but its rejection rate approaches that of M0. This is because the sulfonic acid groups are highly hydrophilic, and they can combine with large amounts of water through static electricity to form a hydration layer on the membrane surface, weakening the interaction between the HA and the membrane, and preventing HA from penetrating the membrane during filtration. At the same time, humic acid is negatively charged at pH 7.4, and the sulfonic acid groups on the membrane surface are also negatively charged, so the electrostatic repulsion effect also leads to the high HA rejection rate of the membrane.40,41 It can also be seen from Fig. 7 that when SPSF is blended with PES, the flux of the blended membrane will first decrease and then increase with increasing sulfonation degree. When the degree of sulfonation is 30% (M2), the flux of the blended membrane is relatively low; this is because more SPSF migrated to the membrane surface during the phase inversion process, which made the membrane surface pore size smaller and the rejection rate increased. This is also consistent with the results of the surface migration degree of XPS analysis. When the degree of sulfonation is 50% (M3), with the increasing number of sulfonate groups, the steric hindrance of the sulfonic acid groups and the intermolecular hydrogen bonding forces cause the polymer chain to break, reducing the π–π accumulation between the aromatic rings, and thereby reducing the viscosity of the casting liquid. This will make the phase separation process easier, which is likely to form a larger pore size (Table 8) and reduce the rejection rate.42
It can be seen from Fig. 8 that when pure water is replaced by the HA solution, the flux of the membrane sharply drops. This is mainly because larger HA molecules adsorbed to the membrane surface and blocked the membrane pores. As time goes by, more and more HA will accumulate on the membrane surface, and form a cake layer, resulting in the decrease of the HA solution flux.
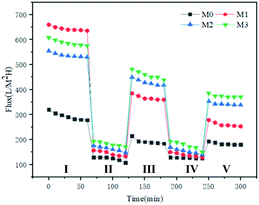 | ||
| Fig. 8 The flux–time curves with HA as a model contaminant of all the membranes. (I, III, V: pure water stage; II, IV: scaling stage). | ||
The flux recovery rate (FRR) of the blend membrane that was polluted by 500 mg L−1 HA and BSA (500 mg L−1) solution for one hour is shown in Fig. 9. It can be seen from Fig. 9 that the FRR (HA or BSA) of M0 is the smallest among all the membranes. This is due to the high roughness of the M0 surface (as seen in Fig. 4), which makes pollutants accumulate in the “valleys” on the membrane surface, causing membrane fouling. When SPSF is added, the FRR (HA or BSA) of all blend membranes increases by varying degrees. This is because the sulfonic acid groups in the SPSF migrate to the blend membrane surface during the phase inversion process, forming a hydration layer on the membrane, making it difficult for dirt to adhere to the membrane surface, and thereby increasing its anti-fouling ability and flux recovery rate.42
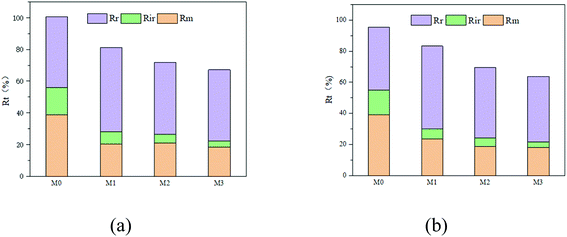
The evaluation results of the total fouling rate (Rt), reversible fouling rate (Rr), irreversible fouling rate (Rir) and resistance (Rm) of the membrane are shown in Fig. 9. It can be seen from Fig. 10 that when SPSF was added to the membrane, its total fouling rate (Rt), reversible fouling rate (Rr), irreversible fouling rate (Rir) and membrane resistance (Rm) all reduced to varying degrees compared with the PES membrane (M0). Among them, M3 has the lowest total fouling rate. This is because M3 has higher hydrophilicity and lower roughness (as shown in Fig. 5), so it can easily bind water molecules to form a hydration layer on the membrane surface. The existence of the hydration layer will inhibit the adhesion of pollutants and help to clean the contaminant molecules.43 At the same time, it also makes the membrane easier to clean because of the finger-shaped holes in the M3 section (as seen in Fig. 4), thereby improving its pollution recovery rate.
Compared with some previously reported UF membranes, the water permeability and rejection (HA) are given in Table 9.
4. Conclusion
In this study, SPSF/PES blend ultrafiltration membranes were successfully prepared via the non-solvent induced phase inversion method. The presence of a large number of hydrophilic groups on the membrane surface is derived from the migration of sulfonate groups during the phase inversion process. The results confirmed the compatibility between the high sulfonation degree PSF and PES. The PES/SPSF blend membranes exhibited improved permeability and antifouling performance. The pure water flux of the blend membranes can reach 530 L m−2 h−1, the rejection rate of humic acid (HA) is 93%, and the flux recovery rate increases from 69.23% to 79.17%. When the degree of sulfonation is 50%, the anti-pollution performance of the blend membrane is the strongest, the flux recovery rate is 81.82%, the irreversible fouling rate is reduced from 17% to 4%, and the membrane resistance is reduced from 38.71% to 18.29%.Author contributions
Xin Wen: conceptualization, validation, formal analysis, investigation, data curation, writing–original draft, writing–review & editing, visualization. Can He: validation, writing–review & editing, formal analysis. Yuyan Hai: methodology, funding acquisition, writing–review & editing. Rui Ma: conceptualization, methodology. Jianyu Sun: project administration, visualization. Xue Yang: conceptualization, methodology. Yunlong Qi: validation, resources. Hui Wei: visualization, data curation. Jingyun Chen: formal analysis.Conflicts of interest
On behalf of my co-authors, we declare that we have no conflicts of interest to this work. We do not have any commercial or associative interest that represents a conflict of interest in connection with the work.Acknowledgements
We are really grateful for the financial support from the China Energy Foundation (GJNY-21-76 and GJNY-21-90).References
- J. Zhao, J. Y. Chong, Y. Shi and R. Wang, J. Membr. Sci., 2019, 572, 210–222 CrossRef CAS.
- M. Tian, R. Wang, W. J. Mao, Y. Miyoshi and H. Mizoguchi, J. Water Process. Eng., 2020, 33, 101034 CrossRef.
- Z. Xu, J. Liao, H. Tang and N. Li, J. Membr. Sci., 2018, 548, 481–489 CrossRef CAS.
- D. Song, J. Xu, Y. Fu, L. Xu and B. Shan, J. Chem. Eng., 2016, 304, 882–889 CrossRef CAS.
- X. F. Fang, J. S. Li, X. Li, X. Y. Sun, J. Y. Shen, W. Q. Han and L. J. Wang, J. Membr. Sci., 2015, 476, 216–223 CrossRef CAS.
- S. Li, Z. Cui, L. Zhang, B. He and J. Li, J. Membr. Sci., 2016, 513, 1–11 CrossRef CAS.
- G. Mishra and M. Mukhopadhyay, J. Chem. Eng., 2018, 63, 366–379 CAS.
- Q. Liu, E. Demirel, Y. Chen, T. Gong, X. Zhang and Y. Chen, J. Appl. Polym. Sci., 2019, 136, 1–9 Search PubMed.
- S. Y. Wang, L. F. Fang, L. Cheng, S. Jeon, N. Kato and H. Matsuyama, J. Membr. Sci., 2018, 549, 101–110 CrossRef CAS.
- L. F. Fang, S. Jeon, Y. Kakihana, J. Kakehi, B. K. Zhu, H. Matsuyama and S. Zhao, J. Membr. Sci., 2017, 528, 326–335 CrossRef CAS.
- N. N. Gumbi, M. Hu, B. B. Mamba, J. Li and E. N. Nxumalo, J. Membr. Sci., 2018, 566, 288–300 CrossRef CAS.
- L. Zhang, Z. Cui, M. Hu, Y. Mo, S. Li, B. He and J. Li, J. Membr. Sci., 2017, 540, 136–145 CrossRef CAS.
- D. Song, J. Xu, Y. Fu, L. Xu and B. Shan, J. Chem. Eng., 2016, 304, 882–889 CrossRef CAS.
- V. Deimede, G. A. Voyiatzis and J. K. Kallitsis, Macromolecules, 2000, 33, 7609–7617 CrossRef CAS.
- W. R. Bowen and T. A. Doneva, J. Membr. Sci., 2001, 181, 253–263 CrossRef.
- Y. X. Xie, K. K. Wang, W. H. Yu and M. B. Cui, J. Membr. Sci., 2020, 579, 562–572 CAS.
- F. Ma, Y. Z. Zhang, X. L. Ding, L. G. Lin and H. Li, Adv. Mater. Res., 2011, 221, 37–42 CAS.
- F. Ma, H. Ye, Y. Z. Zhang, X. L. Ding, L. G. Lin, L. Z. Zhao and H. Li, Desalin. Water Treat., 2014, 52, 618–625 CrossRef CAS.
- Y. Liu, X. Yue, S. Zhang, J. Ren, L. Yang and G. Wang, J. Membr. Sci., 2012, 98, 298–307 CAS.
- X. B. Zhao, L. Du and X. P. Zhang, Polym. Bull., 2011, 4, 75–81 Search PubMed.
- S. Wang, Preparation and study on modified nanocellulose and miscibility mechanism of membranes based on nanocellulose and polyethersulfone, Qingdao University of Science and Technology, 2017 Search PubMed.
- M. Yong, Y. Zhang, S. Sun and W. Liu, J. Membr. Sci., 2019, 575, 50–59 CrossRef CAS.
- J. Liu, Y. Su, J. Peng, X. Zhao and Y. Dong, Ind. Eng. Chem. Res., 2012, 51, 8308–8314 CrossRef CAS.
- D. M. Wang and J. Y. Lai, Curr. Opin. Chem. Eng., 2013, 2, 229–237 CrossRef.
- K. Y. Lin, D. M. Wang and J. Y. Lai, Macromolecules, 2002, 35, 6697–6706 CrossRef CAS.
- L. F. Fang, H. Y. Yang and L. Cheng, et al., Ind. Eng. Chem. Res., 2017, 56, 11302–11311 CrossRef CAS.
- W. L. Huang, J. Y. Lai and S. C. Chou, J. Membr. Sci., 2016, 505, 537–546 Search PubMed.
- T. Tavangar, F. Z. Ashtiani and M. Karimi, J. Polym. Res., 2020, 27, 252 CrossRef CAS.
- H. Yang, S. H. Liu and S. F. Ji, Polym. Mater.: Sci. Eng., 2020, 36, 15–22 CAS.
- L. F. Fang, S. Jeon, Y. Kakihana, J. Kakehi, B. K. Zhu, H. Matsuyama and S. Zhao, J. Membr. Sci., 2017, 528, 326–335 CrossRef CAS.
- W. Wang, Z. X. Liang and Y. F. Zhang, Polym. Mater. Sci. Eng., 2016, 32, 153–158 CAS.
- Y. Q. Wang, Y. L. Su, X. L. Ma, Q. Sun and Z. Y. Jiang, J. Membr. Sci., 2006, 283, 440–447 CrossRef CAS.
- Z. Zhou, S. Rajabzadeh, A. R. Shaikh, Y. Kakihana, W. Ma and H. Matsuyama, J. Membr. Sci., 2016, 514, 537–546 CrossRef CAS.
- S. W. Li, Z. Y. Cui and L. Zhang, J. Membr. Sci., 2016, 513, 1–11 CrossRef CAS.
- J. S. Yin and P. H.-H. Duong, Sep. Purif. Technol., 2019, 226, 109–116 CrossRef CAS.
- J. Li, S. T. Morthensen and J. Y. Zhu, Sep. Purif. Technol., 2018, 194, 416–424 CrossRef CAS.
- Z. J. Tian, P. L. Jin and Y. C. Xin, J. Membr. Sci., 2019, 580, 214–223 CrossRef.
- W. L. Hung, J. Y. Lai and S. C. Chou, J. Membr. Sci., 2016, 505, 70–81 CrossRef CAS.
- N. Abdullah, N. Yusof, W. J. Lau, J. Jaafar and A. F. Ismail, Ind. Eng. Chem. Res., 2019, 76, 17–38 CrossRef CAS.
- Y. H. Zhao, K. H. Wee and R. Bai, J. Membr. Sci., 2010, 362, 326–333 CrossRef CAS.
- J. X. Li, R. D. Sanderson, G. Y. Chai and D. K. Hallbauer, J. Colloid Interface Sci., 2005, 284, 228–238 CrossRef CAS PubMed.
- E. N. Tummons, V. V. Tarabara, J. W. Chew and A. G. Fang, J. Membr. Sci., 2016, 500, 211–224 CrossRef CAS.
- S. Zhao, W. Yan and M. Shi, J. Membr. Sci., 2015, 478, 105–116 CrossRef CAS.
- V. ChaiP, E. Mahmoudi, Y. H. Teow and A. W. Mohammad, J. Water Process. Eng., 2017, 15, 83–88 CrossRef.
- M. S. Algamdi, I. H. Alsohaimi, J. Lawler, H. M. Ali, A. M. Aldawsari and H. M. A. Hassan, Sep. Purif. Technol., 2019, 223, 17–23 CrossRef CAS.
- X. Liu, H. Yuan, C. Wang, S. Zhang, L. Zhang, X. Liu, F. Liu, X. Zhu, S. Rohani, C. Ching and J. Lu, Sep. Purif. Technol., 2020, 233, 116038 CrossRef.
| This journal is © The Royal Society of Chemistry 2022 |


