DOI:
10.1039/D1RA07490C
(Paper)
RSC Adv., 2022,
12, 1527-1533
Improving the properties of Fe2O3 by a sparking method under a uniform magnetic field for a high-performance humidity sensor
Received
9th October 2021
, Accepted 15th December 2021
First published on 10th January 2022
Abstract
Iron oxide (Fe2O3) thin films are promising semiconductors for electronic applications because Fe2O3 is an earth-abundant semiconductor with an appropriate band gap. However, many methods for the synthesis of Fe2O3 thin films require a corrosive source, complex procedures, and many types of equipment. Here, we report, for the first time, a simple method for Fe2O3 deposition using sparking under a uniform magnetic field. The morphology of Fe2O3 displayed an agglomeration of particles with a network-like structure. The crystallite size, % Fe content, and optical bandgap of Fe2O3 were influenced by changes in the magnitude of the magnetic field. For application in humidity sensors, Fe2O3 at a magnetic field of 200 mT demonstrated a sensitivity of 99.81%, response time of 0.33 s, and recovery time of 2.57 s. These results can provide references for new research studies.
Introduction
Iron oxide (Fe2O3) plays an important part in many applications (e.g., gas sensors, batteries, supercapacitors, and photocatalytic water splitting) because Fe2O3 is an earth-abundant semiconductor with a direct bandgap of ∼2.35 eV and an indirect bandgap of ∼1.38 eV.1–6 Moreover, Fe2O3 nanoparticles coated with fullerene-like shells are also used as “nano-transporters” for radioisotopes, which is beneficial for diagnosing and monitoring in the medical field.2 A high surface area and surface-to-volume ratio with surface modification enables Fe2O3 nanoparticle films to become appropriate materials for humidity sensors.7 Nevertheless, many methods for the synthesis of Fe2O3 thin films (e.g., sputtering and atomic layer deposition) require different types of equipment and involve complex procedures.8,9 In addition, the fabrication of humidity sensor-based Fe2O3 requires a temperature > 1000 °C, for example, for the sintering method.10,11 Therefore, an alternative method with a simple process and low temperature requirement for the synthesis of Fe2O3 thin films is essential.
It has been reported that facile methods such as sparking under a non-uniform magnetic field can influence the properties of magnetic materials such as iron (Fe), nickel (Ni) and cobalt (Co).12,13 Previously, we showed that an increase in the magnitude of a uniform magnetic field reduces the porosity and improves the crystal structure as well as the electrical properties of a NiO film.14,15 Thus, a sparking method under a uniform magnetic field could be employed to produce a Fe2O3 film and optimize its properties for humidity sensors.
Here, we reveal, for the first time, Fe2O3 deposition using a sparking method under a uniform magnetic field. The influence of the magnetic field on the morphology, crystal structure, optical properties, chemical composition, and electrical properties was studied. Furthermore, the capability of the Fe2O3 film to sense humidity was investigated.
Experimental section
Deposition of Fe2O3
A glass substrate of area 1 × 1 cm2 was cleaned by sonication for 5 min each time in deionized (DI) water, acetone, and ethanol, respectively. The sparking method under a uniform magnetic field of 0, 100, 200, and 300 mT was setup according to our previous work (Fig. 1).15 Fe wires (99.98% purity; Advent Research Materials) were deposited onto the glass substrate for 30 min. Then, films were annealed at 450 °C under ambient air for 2 h.
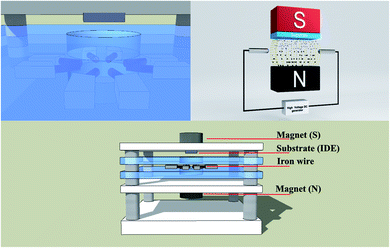 |
| | Fig. 1 Deposition of Fe2O3 and fabrication of a humidity sensor (schematic).15 | |
Fabrication of humidity sensor
Interdigitated electrodes (IDEs) with an area of 1 × 1.5 cm2 and a channel of 450 μm were cleaned by sonication and deposited by the sparking method under a uniform magnetic field, as mentioned above. The deposition time for each condition was 5 h.
Characterization
Fe2O3 films were characterized by scanning electron microscopy (SEM) using a JSM-6335F system (Jeol), X-ray diffraction spectrometry (XRD) employing an X0Pert MPD setup (Philips), ellipsometry using an alpha-SE system (JA Woollam), UV-Vis spectrophotometry employing a Varian Cary 50 setup (Agilent Technologies) and X-ray photoelectron spectrometry (XPS) using an Axis Ultra DLD system (Kratos Analytical). Fe2O3 humidity sensors were evaluated using a source measure unit (2450 series; Keithley Instruments) and a humidity controller (Fig. 2).
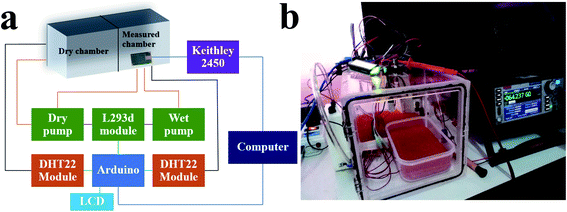 |
| | Fig. 2 (a) Schematic diagram and (b) practical use of the humidity controller. | |
Results and discussion
SEM (Fig. 3) displayed the morphology of Fe2O3 deposited at various magnitudes of the magnetic field. SEM images revealed the agglomeration of particles with a network-like structure. Moreover, the increase in the magnitude of the magnetic field induced accumulation of more particles. Interestingly, this result was not in accordance with our previous work, which indicated that an increase in the magnetic field reduced the porosity of the NiO film.14,15 The reason for this result was the earlier oxidation of Fe particles without annealing, which resulted in misalignment of the particles.12
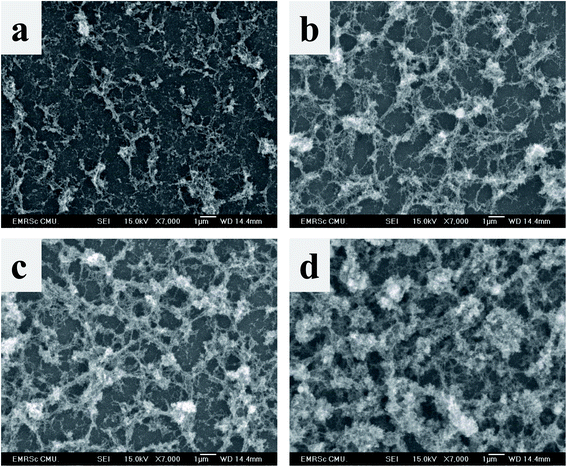 |
| | Fig. 3 SEM images of (a) 0 mT, (b) 100 mT, (c) 200 mT, and (d) 300 mT Fe2O3, respectively, on a glass substrate. | |
The crystal structure of Fe2O3 films analyzed by XRD is displayed in Fig. 4a. The patterns of the Fe2O3 films at a magnetic field of 0 mT did not contain any peaks. For Fe2O3 films at magnetic fields of 100–300 mT, all peaks were in accordance with Joint Committee on Powder Diffraction Standards (JCPDS) 33-0664, which revealed the film deposited by our method to be hematite (α-Fe2O3). Increasing the magnetic field up to 200 mT increased the intensity of the (104) peak and decreased after the magnetic field exceeded 200 mT. To obtain the crystallite size (D) and dislocation density (δ) of Fe2O3 films, we used the following equation:15
| |
D = 0.9λ/β![[thin space (1/6-em)]](https://www.rsc.org/images/entities/char_2009.gif) cos cos![[thin space (1/6-em)]](https://www.rsc.org/images/entities/char_2009.gif) θ θ
| (1) |
| |
 | (2) |
where
λ is the wavelength of the X-ray (1.5418 Å),
β is the full width at half maximum (FWHM) of the diffraction peak and
θ is the Bragg angle of the diffraction peak. This equation revealed that the crystallite size of Fe
2O
3 films at a magnetic field of 100, 200, and 300 mT was 39.2, 41.5 and 30.2 nm, respectively. For a dislocation density of Fe
2O
3 films at a magnetic field of 100, 200, and 300 mT, the value calculated by
eqn (2) was 6.52, 5.81 and 1.1 × 10
15 lines m
−2, respectively.
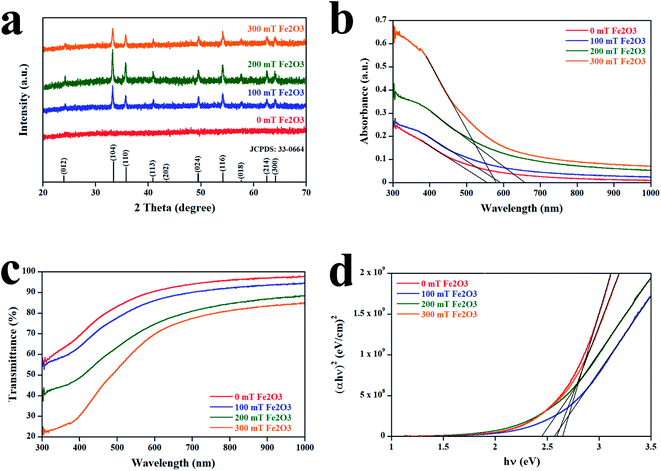 |
| | Fig. 4 (a) XRD patterns of samples. (b) Absorbance of Fe2O3 films. (c) Transmittance of Fe2O3 films. (d) Tauc plot of samples. | |
The optical properties of Fe2O3 films are shown in Fig. 4b and c. The absorption spectra in Fig. 4b reveal that the increase in the magnitude of the magnetic field from 0 mT to 200 mT causes a redshift and increased the absorption intensity. However, a too-high magnetic field (300 mT) led to a blueshift, which originated from an increase in dislocation density as observed by XRD. This result is consistent with data for other metal oxides reported by Zeid and colleagues and Schwinger and collaborators.16,17 Ellipsometry revealed the thickness of the Fe2O3 films at a magnetic field of 0, 100, 200, and 300 mT to be 258, 447, 641, and 901 nm, respectively. The transmittance of the Fe2O3 films is shown in Fig. 4c. The average transmittance (Tavg) of Fe2O3 films at a magnetic field of 0, 100, 200, and 300 mT was 85.65%, 80.70%, 68.04%, and 59.46%, respectively. This result is in accordance with the increase in film thickness measured by ellipsometry because a stronger magnetic field can collect more particles. To reveal the influence of the magnetic field on the bandgap (Eg) of Fe2O3, we used Tauc's relationship, as determined by the following equation:14,15
| |
 | (4) |
where
ν is the photon frequency,
h is the Planck constant,
A is a proportionality constant,
α is the absorption coefficient,
Ab is the absorbance,
t is the thickness of the film, and
n is equal to 2 or 1/2 for indirect and direct transitions, respectively. By using (
αhv)
2 versus hv (
Fig. 4d), the optical bandgap of Fe
2O
3 films at a magnetic field of 0, 100, 200, and 300 mT was evaluated to be 2.65, 2.58, 2.45, and 2.60 eV, respectively. This bandgap value was in agreement with the absorbance result.
The elemental composition of the films was explored by XPS (Fig. 5). The survey spectra in Fig. 5a show that all films consisted of Fe, O, Mg, Na, Ca, C, and Si at the same location for each condition. Mg, Na, Ca, and Si originated from the glass substrate. In addition, the signal for C arose from contamination of the carbon tape, which is used as the electrical contact between the sample and the holder of XPS. By applying a magnetic field of 0, 100, 200, and 300 mT, the atomic concentration of Fe was found to be 9.47%, 10.82%, 13.06%, and 15.75%, respectively. Therefore, the increase in % Fe was in agreement with the number of particles observed by SEM. The XPS core-level spectra of Fe 2p, O 1s, and C 1s are illustrated in Fig. 5b–d, and assignment of elemental bonding is shown in Table 1.
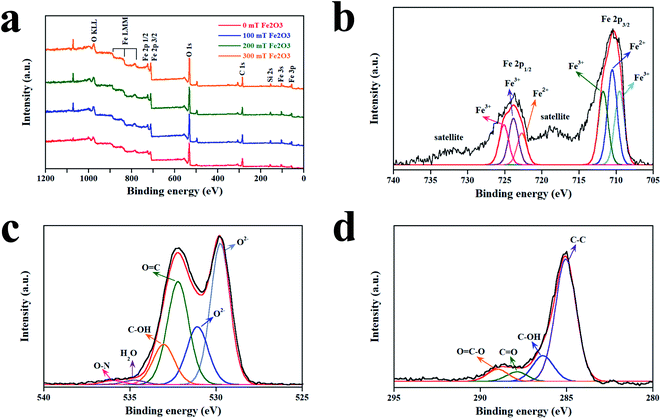 |
| | Fig. 5 XPS of Fe2O3 films deposited at a magnetic field of different strengths. (a) Survey scan of samples. (b) Fe 2p core-level spectrum. (c) O 1s core-level spectrum. (d) C 1s core-level spectrum. | |
Table 1 XPS data of samples
| Peak |
Position (eV) |
Assignment |
Reference |
| Fe 2p3/2 |
710.2 |
Fe3+ |
18 |
| 711.6 |
Fe2+ |
19 |
| 713.2 |
Fe3+ |
19 |
| Fe 2p1/2 |
723.6 |
Fe2+ |
20 |
| 725 |
Fe3+ |
20 |
| 726.5 |
Fe3+ |
21 |
| O 1s |
530 |
O2− |
15 |
| 531 |
O2− |
14 |
| 532.8 |
O![[double bond, length as m-dash]](https://www.rsc.org/images/entities/char_e001.gif) C C |
22 |
| 534 |
C–OH |
22 |
| 535.3 |
H2O |
23 |
| 536 |
O–N |
24 |
| C 1s |
285 |
C–C |
25 |
| 286.2 |
C–OH |
15 |
| 287 |
C![[double bond, length as m-dash]](https://www.rsc.org/images/entities/char_e001.gif) O O |
14 |
| 289 |
O![[double bond, length as m-dash]](https://www.rsc.org/images/entities/char_e001.gif) C–O C–O |
15 |
Fig. 6 illustrates the electrical properties of the Fe2O3 sensor deposited at magnetic fields of different strengths. Electrical properties were characterized under 100% humidity. The current (I)–voltage (V) characteristic curves of the Fe2O3 sensor (Fig. 6a) were linear, revealing ohmic behavior. For the 100 mT Fe2O3 sensor, the device acted as an insulator and did not respond to humidity. By increasing the magnetic field, the slope of the I–V characteristic curve increased, resulting in a reduction in the resistance. However, a magnetic field >200 mT increased the resistance. This effect originates from the crystallite size, which is inversely related to the resistance.25 Therefore, the I–V characteristic curve of the Fe2O3 sensor supported the XRD results. To investigate further the electrical properties and underlying mechanism behind the Fe2O3 sensor, semi-log plots of I–V characteristics were used (Fig. 6b). The curves of 100, 200, and 300 mT Fe2O3 sensors displayed negative shifts. This shift was caused by the electrochemical driving force acting on the ion, which can be explained by the following equation.26,27
| |
 | (7) |
where
I is the ionic current,
G is the conductance of the ion,
VDF is the electrochemical driving force,
VSP is the sensor potential,
VO is the equilibrium potential for the oxygen ions, and
R is the resistance. By considering
eqn (5) and
(6) at 0 V of the semi-log plots (without bias), the current has positive values (
VDF > 0), which is caused by net ionic movement across the electrode of the sensor (
VSP >
VO). This net ionic movement is generated by oxygen ions, whereas the Fe
2O
3 sensor adsorbs moisture.
28 Based on this mechanism along with
eqn (7), the increase in relative humidity (RH) increases the ionic current, which results in a decrease in the resistance of the Fe
2O
3 sensor.
Fig. 7 was used
29 for deeper understanding of the mechanism of the Fe
2O
3 humidity sensor.
 |
| | Fig. 6 Electrical properties of the Fe2O3 sensor at 100% humidity. (a) I–V characteristic curve at various magnetic fields with the inset of the resistance versus magnetic field (red) and crystallite size versus magnetic field (blue). (b) Semi-log plots of the I–V characteristic curve. | |
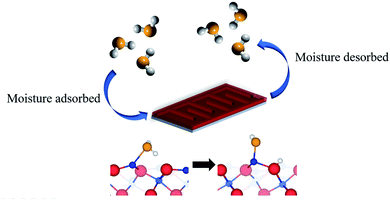 |
| | Fig. 7 Mechanism of the Fe2O3 humidity sensor. The blue, red, orange, and white spheres represent iron, oxygen of iron, oxygen of water, and hydrogen, respectively.29 | |
The resistance versus RH of the Fe2O3 sensor is illustrated in Fig. 8a. Upon increasing the RH from 10% to 100%, the resistance of the Fe2O3 sensor decreased due to formation of a layer of water molecules, thereby generating the ionic current, as mentioned above. In addition, the lowest resistance of 100, 200, and 300 mT Fe2O3 sensors at an RH of 100% also matched the result of I–V curves. The response time and recovery time of the Fe2O3 sensor are shown in Fig. 8b–d. These measurements were made at a humidity of 0% to 100% at 95 °C. The average response time of 100, 200, and 300 mT Fe2O3 sensors was 3.07, 0.33, and 0.75 s, respectively. The average recovery time of the 100, 200, and 300 mT Fe2O3 sensors was 12.53, 2.57, and 6.64 s, respectively. The decrease in the response time is related to the increase in the surface area and surface-to-volume ratio.7 An increment in these two factors also enhances heat transfer from the sensor to moisture, and decreases the recovery time, as observed in 100 and 200 mT Fe2O3 sensors. The response time and recovery time of the 300 mT Fe2O3 sensor increased due to its thickness, which caused an increase in the penetration time and time needed to release moisture. For more information on the sensitivity (S) of the sensors, eqn (8) was used:28
| |
 | (8) |
where Δ
R is the change in resistance and
R0 is the resistance at an RH of 0%. Using
eqn (8), the sensitivity of 100, 200, and 300 mT Fe
2O
3 sensors was calculated to be 99.58%, 99.81%, and 99.71%, respectively. The comparative performance of humidity sensors is shown in
Table 2.
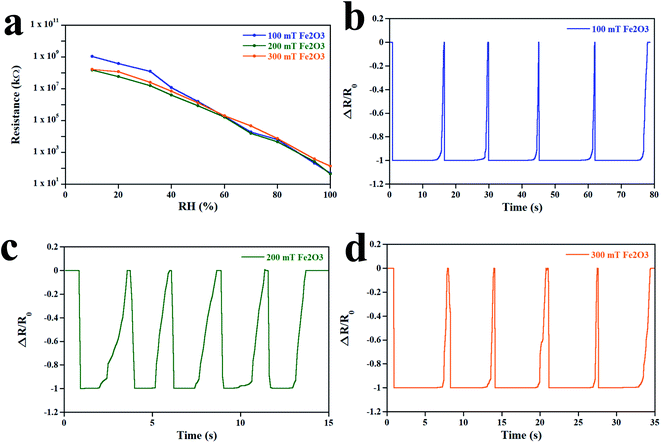 |
| | Fig. 8 (a) Resistance versus RH of the Fe2O3 sensor. The response time and recovery time of the Fe2O3 sensor deposited at (b) 100 mT, (c) 200 mT, and (d) 300 mT at an operating temperature of 95 °C. | |
Table 2 Comparative performance of humidity sensors deposited by different methods
| Method |
Operating temp (°C) |
Response time (s) |
Recovery time (s) |
Reference |
| Spark under 100 mT |
95 |
3.07 |
12.53 |
This work |
| Spark under 200 mT |
95 |
0.33 |
2.57 |
This work |
| Spark under 300 mT |
95 |
0.75 |
6.64 |
This work |
| Spin coating |
26 |
1.79 |
4.97 |
28 |
| Electrospinning |
240 |
10.2 |
23 |
30 |
| Hydrothermal |
25 |
29 |
630 |
7 |
| Hydrothermal |
260 |
12 |
40 |
31 |
| Carbon sphere template |
380 |
14.5 |
10 |
32 |
| Sputtering |
— |
15 |
40 |
33 |
| Sputtering |
— |
3 |
12 |
34 |
The stability of 100, 200, and 300 mT sensors was measured under a humidity of 100% for 1000 min at room temperature (Fig. 9a). The 100, 200, and 300 mT sensors showed stable behavior with an average resistance (in Ω) of 11![[thin space (1/6-em)]](https://www.rsc.org/images/entities/char_2009.gif) 427 ± 5, 6535 ± 2, and 403
427 ± 5, 6535 ± 2, and 403![[thin space (1/6-em)]](https://www.rsc.org/images/entities/char_2009.gif) 322 ± 219, respectively. The resistance of 21 sensors deposited by sparking under a magnetic field of 200 mT is displayed in Fig. 9b. All devices were measured at a humidity of 100%.
322 ± 219, respectively. The resistance of 21 sensors deposited by sparking under a magnetic field of 200 mT is displayed in Fig. 9b. All devices were measured at a humidity of 100%.
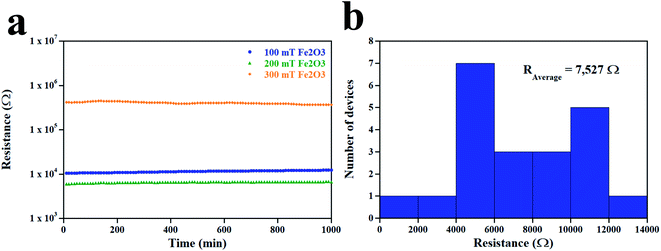 |
| | Fig. 9 (a) Stability of sensors under a humidity of 100% for 1000 min at room temperature. (b) Resistance of 21 devices deposited at a magnetic field of 200 mT. | |
Conclusions
Fe2O3 film was deposited on IDEs and a glass substrate by sparking under a uniform magnetic field. The XRD pattern and SEM revealed that the structure of the Fe2O3 film was hematite and network-like. The crystallite size, optical bandgap, thickness, and electrical properties of Fe2O3 films were influenced by the uniform magnetic field. The performance of humidity sensors based on Fe2O3 film can be improved by deposition at a magnetic field of 200 mT to provide a sensitivity of 99.81%, response time of 0.33 s, and recovery time of 2.57 s, at 95 °C. Our results pave the way for future investigation of the properties and applications of magnetic materials, which can be deposited by sparking under a uniform magnetic field.
Funding
This work was funded by the Research Center in Physics and Astronomy, Chiang Mai University, and the National Research and Innovation Information System, Thailand (FF65/074).
Author contributions
P. T., P. S., and O. W. designed the study, deposited the Fe2O3 films, and measured the sensors. E. K. and W. S. undertook XRD, UV-Vis spectroscopy, and XPS. W. T. and T. K. provided conceptual advice. W. S., T. J., N. S., and A. P. undertook SEM and created I–V curves.
Conflicts of interest
There are no conflicts to declare.
Acknowledgements
The authors thank the Department of Physics and Materials Science, Chiang Mai University, for use of their facilities. This research project was supported by Fundamental Found 2022, Chiang Mai University.
Notes and references
- A. J. Deotale and R. V. Nandedkar, Mater. Today: Proc., 2016, 3, 2069 Search PubMed.
- L. Machala, J. Phys. Chem. B, 2007, 111, 4003 CrossRef CAS PubMed.
- G. Jain, C. J. Capozzi and J. J. Xu, J. Electrochem. Soc., 2003, 150, A806 CrossRef CAS.
- D. Mao, J. Yao, X. Lai, M. Yang, J. Du and D. Wang, Small, 2011, 7, 578 CrossRef CAS PubMed.
- R. Yu, Z. Li, D. Wang, X. Lai, C. Xing, M. Yang and X. Xing, Scr. Mater., 2010, 63, 155 CrossRef CAS.
- Y. Gao, R. Zhou, D. Wang, Q. Huang, C.-H. Cheng and Z. Zheng, Chem. Res. Chin. Univ., 2020, 36, 97 CrossRef CAS.
- U. V. Patil, C. S. Rout and D. J. Late, Adv. Device Mater., 2015, 1, 88 CrossRef.
- M. Aronniemi, J. Saino and J. Lahtinen, Thin Solid Films, 2008, 516, 6110 CrossRef CAS.
- K. Siroky, J. Jiresova and L. Hudec, Thin Solid Films, 1994, 245, 211 CrossRef CAS.
- I. C. Cosentino, E. N. S. Muccillo and R. Muccillo, Mater. Chem. Phys., 2007, 103, 407 CrossRef CAS.
- C. Cantalini and M. Pelino, J. Am. Ceram. Soc., 1992, 75, 546 CrossRef CAS.
- S. S. Ručman, W. Punyodom, J. Jakmunee and P. Singjai, Crystals, 2018, 8, 362 CrossRef.
- S. S. Ručman, C. Boonruang and P. Singjai, Crystals, 2020, 10, 1141 CrossRef.
- P. Tippo, W. Thongsuwan, O. Wiranwetchayan, T. Kumpika, A. Tuantranont and P. Singjai, Mater. Res. Express, 2020, 7, 056403 CrossRef CAS.
- P. Tippo, W. Thongsuwan, O. Wiranwetchayan, T. Kumpika, E. Kantarak and P. Singjai, Sci. Rep., 2020, 10, 15690 CrossRef CAS PubMed.
- S. P. Schwaminger, R. Surya, S. Filser, A. Wimmer, F. Weigl, P. Fraga-García and S. Berensmeier, Sci. Rep., 2017, 7, 12609 CrossRef PubMed.
- E. F. A. Zeid, I. A. Ibrahem, A. M. Ali and W. A. A. Mohamed, Results Phys., 2019, 12, 562 CrossRef.
- S. J. Gerber and E. Erasmus, Mater. Chem. Phys., 2018, 203, 73 CrossRef CAS.
- P. M. Hallam, M. Gomez-Mingot, D. K. Kampouris and C. E. Banks, RSC Adv., 2012, 2, 6672 RSC.
- S. K. Shaw, S. K. Alla, S. S. Meena, R. K. Mandal and N. K. Prasad, J. Magn. Magn. Mater., 2017, 434, 181 CrossRef CAS.
- N. Luo, Y. Lin, J. Guo, E. Quattrocchi, H. Deng, J. Dong, F. Ciucci, F. Boi, C. Hu and S. Grasso, Materials, 2021, 14, 2826 CrossRef CAS PubMed.
- P. Tippo, P. Singjai, S. Choopun and S. Sakulsermsuk, Mater. Lett., 2018, 211, 51 CrossRef CAS.
- C. W. Kao, P. T. Wu, M. Y. Liao, I. J. Chung, K. C. Yang, W. Y. I. Tseng and J. Yu, Pharmaceutics, 2018, 10, 62 CrossRef PubMed.
- C. Wechwithayakhlung, D. M. Packwood, J. Chaopaknam, P. Worakajit, S. Ittisanronnachai, N. Chanlek, V. Promarak, K. Kongpatpanich, D. J. Harding and P. Pattanasattayavong, J. Mater. Chem. C, 2019, 7, 3452 RSC.
- R. B. Vasiliev, M. N. Rumyantseva, S. G. Dorofeev, Y. M. Potashnikova, L. I. Ryabova and A. M. Gaskov, Mendeleev Commun., 2004, 14, 167 CrossRef.
- A. L. Hodgkin and A. F. Huxley, J. Physiol., 1952, 117, 500 CrossRef CAS PubMed.
- D. K. Ferry, Science, 2012, 335, 45 CrossRef CAS PubMed.
- M. U. Khan, G. Hassan, M. Awais and J. Bae, Sens. Actuators, A, 2020, 311, 112072 CrossRef CAS.
- R. Ovcharenko, E. Voloshina and J. Sauer, Phys. Chem. Chem. Phys., 2016, 18, 25560 RSC.
- S. Yan and Q. Wu, J. Mater. Chem. A., 2015, 3, 5982 RSC.
- P. Sun, W. N. Wang, Y. P. Liu, Y. F. Sun, J. Ma and G. Y. Lu, Sens. Actuators, B, 2012, 173, 52 CrossRef CAS.
- Y. F. Kang, L. W. Wang, Y. S. Wang, H. X. Zhang, Y. Wang, D. T. Hong, Y. Qv and S. R. Wang, Sens. Actuators, B, 2013, 177, 570 CrossRef CAS.
- Q. Liang, H. Xu, J. Zhao and S. Gao, Sens. Actuators, B, 2012, 165, 76–81 CrossRef CAS.
- P. K. Kannan, R. Saraswathi and J. B. B. Rayappan, Sens. Actuator A Phys., 2010, 164, 8–14 CrossRef CAS.
|
| This journal is © The Royal Society of Chemistry 2022 |
Click here to see how this site uses Cookies. View our privacy policy here.  Open Access Article
 ab,
Pisith Singjaia,
Waraporn Sroilaa,
Tipsuda Jaisamera,
Nongpanita Suttanona,
Arisara Panthawana,
Ekkapong Kantaraka,
Wattikon Sroilaa,
Wiradej Thongsuwana,
Tewasin Kumpika
 ab and
Orawan Wiranwetchayan*bc


![[thin space (1/6-em)]](https://www.rsc.org/images/entities/char_2009.gif) cos
cos![[thin space (1/6-em)]](https://www.rsc.org/images/entities/char_2009.gif) θ
θ


![[thin space (1/6-em)]](https://www.rsc.org/images/entities/char_2009.gif) 427 ± 5, 6535 ± 2, and 403
427 ± 5, 6535 ± 2, and 403![[thin space (1/6-em)]](https://www.rsc.org/images/entities/char_2009.gif) 322 ± 219, respectively. The resistance of 21 sensors deposited by sparking under a magnetic field of 200 mT is displayed in Fig. 9b. All devices were measured at a humidity of 100%.
322 ± 219, respectively. The resistance of 21 sensors deposited by sparking under a magnetic field of 200 mT is displayed in Fig. 9b. All devices were measured at a humidity of 100%.


![[double bond, length as m-dash]](https://www.rsc.org/images/entities/char_e001.gif) C
C