 Open Access Article
Development of a gliclazide ionic liquid and its mesoporous silica particles: an effective formulation strategy to improve oral absorption properties†
Bijian Zhoua,
Dan Tengb,
Jinghui Lia,
Yanhong Zhanga,
Minghui Qi a,
Minghuang Hong
 *a and
Guo-Bin Ren
 *ac
*ac
aEngineering Research Centre of Pharmaceutical Process Chemistry, Ministry of Education, Laboratory of Pharmaceutical Crystal Engineering & Technology, East China University of Science and Technology, No. 130 Meilong Road, Shanghai 200237, China. E-mail: mhhong@ecust.edu.cn; rgb@ecust.edu.cn
bShanghai Key Laboratory of New Drug Design, School of Pharmacy, East China University of Science and Technology, Shanghai 200237, China
cState Key Laboratory of Bioreactor Engineering, Shanghai Key Laboratory of New Drug Design, East China University of Science and Technology, No. 130 Meilong Road, Shanghai 200237, China
First published on 5th January 2022
Abstract
Ionic liquid (IL) technology provides a useful platform to enhance the oral absorption of therapeutic agents. In the present work, gliclazide (GLI), a second-generation sulfonylurea drug was transformed into an IL with tetrabutylphosphonium. The physicochemical properties of this IL were systematically characterized by DSC, TGA, FT-IR, NMR, and HPLC. For the further preparation development, a solution stability test was conducted. GLI-based IL could improve the solution stability in a neutral environment. To assess oral potential, the solubility characteristics including equilibrium solubility, 24 h kinetic saturation solubilities and supersaturation profiles were first explored. Significant enhancement of solubilities, supersaturation ratio and duration of supersaturation was found for the synthesized IL. Computational methodology was utilized to better understand the improved solubility results. From the simulated results, [TBP][GLI] showed a longer time period when the distance between cation and anion was far above the baseline and a higher deviation degree, indicating less stable ion pairs of [TBP][GLI] in an aqueous environment and it being easy for the cation and anion to tear apart and form interactions with water molecules. The prepared [TBP][GLI] exhibited intestinal transportation ability and safety as evidenced by the in vitro gastrointestinal tract artificial membrane permeability assays (GIT-PAMPA) and cytotoxicity experiments with Caco-2 cells. A mesoporous carrier, AEROPERL® 300 Pharma, was chosen to load the IL and then encapsuled into enteric capsules. The prepared oral capsules containing GLI-based IL loaded mesoporous silica particles released fast and could realize 100% release within 60 min.
1. Introduction
As one of the four major diseases, diabetes mellitus seriously threatens the health of residents around the world. Type 2 diabetes (T2D) is increasingly recognized as a highly heterogeneous disease, including individuals with varying clinical characteristics, disease progression, drug response, and risks of complication.1,2 Therefore, methods to treat diabetes mellitus, especially those for type 2, are very crucial in future health policies.As a second-generation sulfonylurea, gliclazide (GLI) can stimulate the pancreatic β-cells to secrete insulin and then lower the blood glucose level.3 Besides, this drug has beneficial extrapancreatic effects including antiplatelet, antiradical and antioxidant effects.4 GLI was recommended by the World Health Organization (WHO) as one of the drugs in the diabetes section of the essential medicines list for people aged over 60 years in 2014.5 However, as a Biopharmaceutics Classification System (BCS) class II drug, GLI has low aqueous solubility, especially in acidic solution. This property may reduce its absorption vial oral administration and restrict its bioavailability.6 Various techniques including micronization,7 complexation with β-cyclodextrin,8 coamorphization,9 solid dispersion10 and co-crystal formation11–13 have been conducted aiming to improve the solubility of GLI. However, all these techniques generally have some limitations such as complexity, polymorphism and instability. Moreover, this sulfonylurea hypoglycaemic agent tends to degraded by hydrolysis, oxidation and photolysis,14 and two degradation products were found in strong acidic medium.3 To the best of our knowledge, no paper to solve the stability problem of GLI have been reported.
Ionic liquids (ILs) are organic compounds solely made of ions to form salts with melting points below 100 °C.15,16 IL technology has attracted emerging interest in pharmaceutical research since the concept of active pharmaceutical ingredients-ionic liquids (API-ILs), in which API was used as cation or anion or both, was first proposed by Rogers in 2007.17 The technological utility of APIs is greatly enhanced when they are transformed into ILs. In comparison to solid drugs, API-ILs may avoid polymorphism,18 exhibit higher solubility,19,20 higher permeability,21 and better thermal stability.18 As far as we are concerned, about 40% of marketed drugs have low solubility problems.22 Except for solubility enhancement, the API-ILs may also lead to a faster dissolution rate, longer supersaturation duration of API, or increased amount of absorption as compared to the API.23 This provided a new method to solve the solubility issue of BCS class II drugs. The solubility of ibuprofenate ILs containing L-valine alkyl ester was over 40 times higher compared with the parent drug.24 The API-ILs of indomethacin with DBU, DMEA, DABCO and TMG showed really high aqueous solubility (5![[thin space (1/6-em)]](https://www.rsc.org/images/entities/char_2009.gif) 000
000![[thin space (1/6-em)]](https://www.rsc.org/images/entities/char_2009.gif) 000 times higher than the free drug).25 In these papers, the increased solubility was only attributed to the amorphous structure of API-ILs. Further mechanism research was left to better understand the intrinsic nature of solubility improvement and the role of API-ILs played.
000 times higher than the free drug).25 In these papers, the increased solubility was only attributed to the amorphous structure of API-ILs. Further mechanism research was left to better understand the intrinsic nature of solubility improvement and the role of API-ILs played.
Although ILs have many potential advantages, they are difficult to handle during pharmaceutical manufacturing. Turning the liquid form drugs into solid form is an enormous challenge when considering oral route of drug administration. There are some carrier materials including Fujicalin®, Neusilin® and Aerosil® which can be used to address this challenge.26,27 Limited attempt was tried to choose AEROPERL® 300 Pharma, a porous granulated form of colloidal silicon dioxide with good processability and high porosity introduced by Evonik, as an absorbent for the development of liquid active pharmaceutical ingredients such as API-ILs based oral solid product.28 Few literatures on pharmaceutical preparation studies of API-ILs to further validate its value of oral clinical application have been found.
Up till now, only one kind of gliclazide-based ionic liquid was prepared by us in the previous report29 and no literatures on transforming GLI into ionic liquids to improve its oral absorption has been reported. In the present study, another kind of gliclazide-based ILs was successfully prepared for the first time. The structure of this IL was identified by thermal analysis, powder X-ray diffractometry (PXRD) analysis, Fourier transform infrared spectroscopy (FT-IR) and nuclear magnetic resonance spectrometer analysis (NMR). The solubility characteristics including equilibrium solubility, 24 h kinetic saturation solubilities and supersaturation profiles were measured. Computational methodology was used to study the structure of the IL and better understand the experimental results. In vitro gastrointestinal tract artificial membrane permeability assays (GIT-PAMPA) and cytotoxicity experiments against Caco-2 cell were conducted to consider the permeability and the potential gastrointestinal tract toxicity. Then IL-loaded mesoporous silica particles using AEROPERL® 300 Pharma were prepared and systematically characterized. Finally, PCcaps size 9 capsules were used to carry the particles. In vitro dissolution tests were conducted to determine the dissolution properties of this formulation.
2. Materials and methods
2.1 Materials
Gliclazide (GLI) was purchased from Shanghai Macklin Biochemical Co., Ltd (Shanghai, China) with purity greater than 98%. Tetrabutylphosphonium (TBP) hydroxide solution (40% in water, v/v) and tributyl(tetradecyl)phosphonium (P6,6,6,14) chloride were purchased from TCI (Shanghai) Development Co., Ltd (Shanghai, China) with purity greater than 99% and 97% respectively. Ultrapure water (resistivity = 18.2 MΩ cm) was prepared using a Merck Millipore Ming Che D24 UV system (Darmstadt, Germany). AEROPERL® 300 Pharma, was kindly donated by Evonik China Inc. (Shanghai, China). Hard gelatine capsules (PCcaps size 9) were purchased from Suzhou Capsugel Co., Ltd (Suzhou, China). All the rest chemicals and reagents were at least of analytical grade and used without further purification.2.2 Preparation of gliclazide-based ionic liquids
2.3 Characterization
The Tg values were taken as the temperature at the midpoint of the glass transition region. The M-DSC data were analyzed using TA Universal Analysis software (TA instruments, Delaware, USA).
2.4 Solution stability assay
The solution stability of GLI and [TBP][GLI] were investigated in four different media including 0.1 M HCl solution (pH 1), phosphate buffer saline (PBS 7.4), simulated gastric fluid (SGF) and simulated intestinal fluid (SIF), which cover the entire GI tract pH in both fasted and fed state according to the previous report.30 Briefly, GLI and [TBP][GLI] were added to 100 ml media to give a GLI concentration of 20 μg ml−1, respectively. The resulting solutions were maintained at 37 °C. Samples (0.5 ml) were taken at specified time intervals (0, 1, 2, 3, 4, 6, 8, 10, 12, 24 h) and analyzed by HPLC. Tests for [P6,6,6,14][GLI] ionic liquid were not conducted because of its limited solubility in some of the chosen buffer solutions.2.5 Partition coefficients determination
The partition coefficients of [TBP][GLI], [P6,6,6,14][GLI] and GLI were determined by a shake-flask method, described in the Organization for Economic Co-operation and Development (OECD) guidelines.21 Firstly, two bottles charged with sufficient ultrapure water in n-octanol and sufficient n-octanol in ultrapure water were placed in a thermostat shaker for 24 h, and through standing 72 h to separate obtained mutually saturated two phases. Then, approximately 5 ml of water saturated in n-octanol was added to a 10 ml glass vial, the same volume of 1-octanol saturated in water (containing [TBP][GLI]) was added carefully to the vial, to prevent the emulsification of solutions. Next, the vials were placed in shaker, kept under the temperature at 37.0 ± 0.3 °C and stirring at 200 rpm for 24 h to reach the equilibrium. Subsequently, both samples were centrifuged to ensure the complete phase separation. Finally, the concentration of GLI in the octanol phase and water phase were determined by HPLC, and log![[thin space (1/6-em)]](https://www.rsc.org/images/entities/char_2009.gif) P could be then calculated.
P could be then calculated.
The aqueous solution was replaced by 0.01 M phosphate buffer saline (PBS 7.4), which was carried out to determine the distribution coefficients at pH values of 7.4 (log![[thin space (1/6-em)]](https://www.rsc.org/images/entities/char_2009.gif) D7.4). The remaining steps were consistent with the steps for determining log
D7.4). The remaining steps were consistent with the steps for determining log![[thin space (1/6-em)]](https://www.rsc.org/images/entities/char_2009.gif) P.
P.
2.6 Solubility characteristics
![[thin space (1/6-em)]](https://www.rsc.org/images/entities/char_2009.gif) 000 rpm for 10 min. The supernatants were filtered through 0.22 μm cellulose acetate membrane and then analyzed by HPLC. The concentration of GLI in each sample was quantified according to a calibration curve (R2 ≥ 0.999). All the samples were prepared in triplicates.
000 rpm for 10 min. The supernatants were filtered through 0.22 μm cellulose acetate membrane and then analyzed by HPLC. The concentration of GLI in each sample was quantified according to a calibration curve (R2 ≥ 0.999). All the samples were prepared in triplicates.Similarly, the solubility of GLI-ILs and GLI in PBS 7.4, SGF, SIF, blank FaSSIF, FaSSIF, blank FeSSIF and FeSSIF was also measured, respectively. These media were prepared according to the previous reports.31,32
![[thin space (1/6-em)]](https://www.rsc.org/images/entities/char_2009.gif) 000 rpm for 10 min. The supernatants were filtered through 0.22 μm cellulose acetate membrane and then analyzed by HPLC.
000 rpm for 10 min. The supernatants were filtered through 0.22 μm cellulose acetate membrane and then analyzed by HPLC.The initial sample solution was made by adding 0.95 mg GLI or 1.69 mg [TBP][GLI] to 1.5 ml ISA water in a 2.0 ml vial. Then the measured solubility was entered, and “CheqSol” assay was selected. The sample solution was pre-alkalified to pH 12.0 with 0.5 M KOH by the instrument automatically, then titrated with acid from pH 12 to pH 2 to get the value of aqueous solubility, supersaturation rate and duration of supersaturation.
2.7 Bind energies, electrostatic potential and molecular dynamics simulations
The internal stored 6-31+G* basis set of Gaussian 09 D.01 program at the B3LYP/6-31+G* level were used to calculate the frequencies of the stable configurations of the ILs. The binding energies were corrected for the basis set superposition error (BSSE).33 The interaction energy, ΔEint, was evaluated by the following equation:| ΔEint = Eion-pair − (Ecation + Eanion) | (1) |
Multiwfn program34 and Winvmd program35 in Gaussian 09 suite were used for the electrostatic potential (ESP) analysis. Structural optimization and frequency analysis were performed using the B3LYP-D3 functional with the 6-31 G* basis set, and single-point energies were calculated at the B3LYP-D3/6-31+G* level. Frequency calculations indicated that all configurations were local minima with no imaginary frequencies, which ensured the presence of the minimum.
To explore the interaction between anion and cation in ionic liquids, molecular dynamics simulations on single ion pairs in water were performed using Gromacs V.4.6.5 (ref. 36) and the parameters for ion pairs were taken from optimized potentials for liquid simulations (OPLS) force field.37 The simulation box of each system was created by editconf module of Gromacs and filled with the extend simple point charge (SPC/E) water model.38 Firstly, the systems were subjected to a 1000-step energy minimization using the steepest descent method. Then, the systems were gradually heated from 0 K to 298 K followed by a 1000 ps initial equilibration at the constant volume and temperature at 298 K (NVT), and an integration time of 0.002 ps was adopted using the leapfrog algorithm. All of the simulations were carried out in the NPT ensemble using velocity rescaling39 to maintain temperature at 298 K and Parrinello–Rahman barostat40 to maintain pressure at 1 bar. Long-range electrostatic interactions were calculated by the particle mesh Ewald summation scheme. All bond lengths to hydrogen atoms were constrained with LINCS algorithm.41 The distances between anion and cation in the ion pair were calculated by gmx_distance module and the results of the simulations were visualized in PyMOL.
2.8 Gastrointestinal tract parallel artificial membrane permeability assay (GIT-PAMPA)
In order to compare the gastrointestinal absorption of GLI-based ILs with that of GLI, in vitro permeation tests with GIT-PAMPA were carried out with little modification.42 Stock solutions were prepared in Tris buffer pH 6.5 to obtain the donor drug solution with different GLI concentration ranging from 150 μg ml−1 to 1000 μg ml−1. The assay procedure was initiated by filling each well of the microtiter plate (MultiScreen®, catalogue no. MATRNPS50, Millipore Corporation, Bedford, MA, USA) with 300 μl of each donor drug solution. Carefully, and avoiding the pipette tip contact with the filter, the hydrophobic filter (0.45 μm) of each acceptor well of the 96-well microfilter plate (MultiScreen®-IP, catalogue no. MAIPNTR10, Millipore Corporation, Bedford, MA, USA) was impregnated with 6 μl of the artificial lipid solution composed of 2% of L-α-phosphatidylcholine from soybean in n-dodecane. Immediately after this application, 150 μl of Tris buffer pH 7.4 were added to the acceptor well. Then, receptor plate was gently placed onto the donor plate, making sure that the underside of the membrane was in contact with donor solution without entrapment of air bubbles. The assembled donor–acceptor plates were incubated at room temperature for 16 h. Afterwards, plates were separated and test compounds were quantified by HPLC in the receiver solution. Experiments were carried out in replicate (n = 6) and the apparent permeability (Papp) of each drug, in centimeter per second, was calculated applying the eqn (2), which was previously reported by Fortuna et al.42
 | (2) |
2.9 Cytotoxicity test
Caco-2 cell line was used to determine the inhibitory effects of compounds on cell growth using the CCK-8 assay. Caco-2 cells were incubated in Dulbecco's Modified Eagle's Medium (DMEM) supplemented with 10% fetal bovine serum and 1% penicillin/streptomycin and grown at 37 °C in 95% air and 5% CO2 environmental conditions. Exponentially well growing cells were plated at 4 × 10³ cells per well into 96-well microtiter tissue culture plates (Corning, New York, USA) and incubated for 16 h before the addition of the drugs. GLI, [TBP][GLI] and the related counterion were dissolved in DMSO, and diluted with DMEM to form solutions with a series of concentrations. The cells were treated with various concentrations of drugs and incubated for 24 h. 20 μl of CCK-8 solution was then added and incubated for another 3 h. Finally, the absorbance at 450 nm was measured and recorded with microplate reader (Biotek, Vermont, USA). The IC50 values were calculated by plotting the relationship between concentration and cell survival rate (%) using SPSS 22. Each result was expressed as mean ± SD for triplicates.2.10 Preparation of GLI-loaded mesoporous silica particles
AEROPERL® 300 Pharma was dried in the vacuum oven until it reached constant weight before loading the drug. Drug loading was achieved by introducing 750 mg AEROPERL® 300 Pharma to 20 ml methanolic solution of GLI or [TBP][GLI] (conc. ∼20 mg ml−1 of GLI) under constant stirring at 250 rpm for 6 h. The suspension was left for 24 h to reach equilibrium. Afterwards, the suspension was centrifuged at 12![[thin space (1/6-em)]](https://www.rsc.org/images/entities/char_2009.gif) 000 rpm for 8 min and the mesoporous silica particles were washed thrice with methanol to remove the surface bound drug. The GLI-loaded mesoporous silica particles were dried at 60 °C in vacuum oven for 24 h to completely remove the solvent. In this study, GLI loaded mesoporous silica particle was named as GLI/MSP, [TBP][GLI] loaded mesoporous silica particle was named as [TBP][GLI]/MSP. Herein, MSP was short for mesoporous silica particle. The successfully prepared MSP were loaded into PCcaps size 9 hard gelatine capsules for further experiments.
000 rpm for 8 min and the mesoporous silica particles were washed thrice with methanol to remove the surface bound drug. The GLI-loaded mesoporous silica particles were dried at 60 °C in vacuum oven for 24 h to completely remove the solvent. In this study, GLI loaded mesoporous silica particle was named as GLI/MSP, [TBP][GLI] loaded mesoporous silica particle was named as [TBP][GLI]/MSP. Herein, MSP was short for mesoporous silica particle. The successfully prepared MSP were loaded into PCcaps size 9 hard gelatine capsules for further experiments.
2.11 Drug load verification and quantification
A light microscope (Leitz Ortophlan, Wetzlar, Germany) connected to a CMEX-1 digital camera (Euromex Microscopen BV, Arnhem, Netherlands) was used to observe the dry powder images to monitor the impregnation of GLI or [TBP][GLI] into GLI/MSP or [TBP][GLI]/MSP. Samples were spread gently between the glass slide and cover slide and then observed at 320×magnification.The drug content of the GLI formulations was determined by suspending 10 mg of the loaded particles in 25 ml of methanol (n = 3). These suspensions were sonicated for 30 min in an ultrasonic bath, after which the GLI was separated from the methanol solution by filtration (PTFE-membrane filter, 0.22 μm pore size). The concentration of the drug in solution was determined by HPLC.
The drug loading was calculated according to the following equation:43
 | (3) |
2.12 Solid-state characterization
Solid-state characterization of GLI, [TBP][GLI], blank MSP, physical mixture of GLI and AEROPERL® 300 Pharma (GLI + MSP), GLI/MSP and [TBP][GLI]/MSP was conducted using a variety of analytical tools.The surface appearance and shape were visualized by SEM (S-3400N, Hitachi Instruments, Tokyo, Japan). Samples were fixed on double-sided sticky tape mounted on aluminum stubs and then coated with a gold layer under an argon atmosphere. The scanning was performed at an accelerating voltage of 15 kV. Surface area of blank MSP, GLI/MSP and [TBP][GLI]/MSP was determined by N2 adsorption/desorption analysis (Micromeritics TriStar II 3020). The samples were degassed before subjecting to N2 adsorption/desorption analysis at 77 K. The specific surface area (SSA) was calculated by the Brunauer–Emmett–Teller (BET) method using adsorption data at relative pressure (p/p0).44 The particle sizes and particle size distributions of the samples, with a refractive index of 1.5, were measured with Malvern MS2000 laser particle size analyzer (Malvern Instruments Ltd, Malvern, UK) through dry procedure. Span values was calculated according to the eqn (4). Particle size was analyzed using the Dispersion Technology Software provided by Malvern Instruments. PXRD patterns of selected samples were obtained as described in 2.3.1. DSC was conducted by the same instrument as described in 2.3.2. All samples weighed 1–3 mg and were heated in hermetically sealed aluminum pans at a rate of 10 °C min−1 under a nitrogen gas flow of 50 ml min−1. The DSC data were analyzed using the same software as described in 2.3.2.
 | (4) |
2.13 In vitro dissolution test
Transfer dissolution experiment of SGF to FaSSIF was conducted to simulate the in vivo gastric-to-intestinal transition. GLI/MSP or [TBP][GLI]/MSP capsules with a dose of 5 mg (calculated by GLI) was dispersed in 10 ml of SGF. At predetermined time intervals, 0.8 ml of the samples were withdrawn during the SGF stage. After 30 min, 1 ml of SGF together with the capsules were transferred to 9 ml of FaSSIF. This transfer was thus accompanied with a 10-fold dilution, such that the (theoretical) final concentration in FaSSIF amounted to 50 μg ml−1. The relative amount in solution in FaSSIF after transfer from SGF was calculated based on the expected amount of drug present in FaSSIF (i.e. 10% of the nominal dose that was dispersed in SGF). Three parallel experiments were conducted for each test capsule.The GLI concentrations of samples were measured by HPLC and calculated according to the calibration curves which were constructed by plotting peak areas of GLI versus GLI concentrations over the concentration range of 1–100 μg ml−1 (R2 = 0.9997).
2.14 Statistical analysis
Results were expressed as mean ± standard deviation. Statistical analysis of data was carried out using independent-samples t-test with SPSS 25.0 software (SPSS, Chicago, USA). Results with P < 0.05 showed that the difference was statistically significant.3. Results and discussion
3.1 Structure and physical characteristics
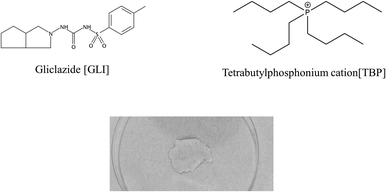
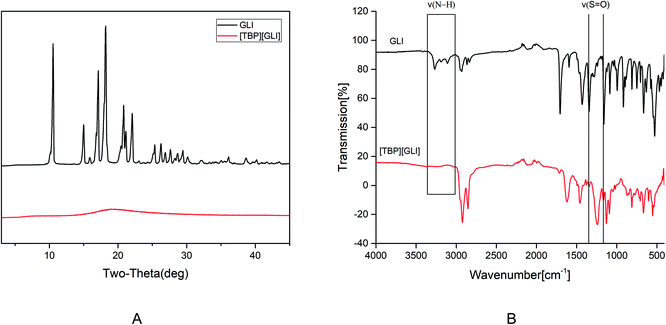
[TBP][GLI] ionic liquid, which was light yellow viscous liquid at room temperature (Fig. 1), was successfully synthesized. Observed by polarized light microscopy, there was no birefringence. For GLI, birefringence phenomenon could be seen clearly (Fig. S1†). Meanwhile, GLI was crystalline with characteristic peaks at 10.54, 15.00, 17.14, 18.22, 20.82, 22.06° whereas [TBP][GLI] showed amorphous halos from PXRD patterns (Fig. 2A). Thus, the crystalline nature of GLI and the amorphous nature of the [TBP][GLI] were confirmed.The synthesized [TBP][GLI] IL was systemic characterized by MDSC, TGA, FT-IR and 1H NMR. The density and viscosity were also determined. The results of the density, viscosity and thermal analyses were showed in Table 1. The density (ρ) and viscosity (η) of [TBP][GLI] was 941.2 kg m−3 and 1105 mPa s respectively. These results were very similar to that of [TBP][Pro] reported before.45 The melting point of GLI was 171 °C. As for [TBP][GLI], no melting point but a subzero glass transition temperature of −40.01 °C was observed, which further indicated the successful preparation of the IL. To indicate thermal stability of API, the temperature of 5% of the total weight loss (T5% onset) had been used.17 GLI and its IL both had a good thermal stability with a single-step decomposition temperature more than 180 °C. Meanwhile, there was almost no residual solvent in the IL and could have little effect on its properties as evidenced by the TGA results that mass loss at 150 °C was less than 2%, and the KF test that less than 1% amount of water was remaining in the IL.
In the structure of GLI, the N–H group near the sulfonyl group is acidic and can be the potential salt forming site. The successful preparation of [TBP][GLI] could also be proven from the FT-IR spectrum (Fig. 2B). On one hand, characteristic stretching vibrations between 3300 cm−1 and 3100 cm−1 belonging to the acidic N–H group was not detected. On the other hand, the absorption band for the sulfonyl group was blue-shifted from 1342 cm−1 and 1159 cm−1 to 1246 cm−1 and 1129 cm−1.
The results of 1H NMR (Fig. S2†) could be a further convincing proof for the successful salt formation. The proton of the N–H group near the sulfonyl group showed peak at δ = 8.7 on the spectrum of GLI. Whereas this peak was not detected on the spectrum of [TBP][GLI]. Besides, near 1![[thin space (1/6-em)]](https://www.rsc.org/images/entities/char_2009.gif) :
:![[thin space (1/6-em)]](https://www.rsc.org/images/entities/char_2009.gif) 1 molar ratio of the GLI and counterion was verified based on the integration of assignable peaks in the spectra (for GLI: δ = 7.78, for TBP: δ = 0.96–0.81).
1 molar ratio of the GLI and counterion was verified based on the integration of assignable peaks in the spectra (for GLI: δ = 7.78, for TBP: δ = 0.96–0.81).
3.2 Solution stability assay
Solution stability is an essential property for the success of drugs, which, is applied by project teams to make go/no-go decisions at all stages of drug discovery and development.46 For oral dosing, compounds encounter various pH and enzymatic challenges in the gastrointestinal (GI) tract, therefore the stability in the GI tract is critical in order to achieve good oral bioavailability.47 Stability of drug candidates in the simulated GI fluids is usually tested early in drug discovery process so that stability “baggage” is not carried into the later phase when more resources are invested.As it can be observed in Fig. 3A, the degradation behavior of GLI and [TBP][GLI] was very similar in strong acidic environment (pH 1 and SGF). The concentration of GLI decreased rapidly, reaching a concentration below the detect limitation of HPLC after only 6 h of exposure. Both GLI and [TBP][GLI] were relatively stable in SIF during the whole experiment period. In pH 7.4 buffer, the concentration of GLI decreased gradually to zero at the end of the experiment. While for the [TBP][GLI], it was much more stable. At 24 h, still 62.72% of the initial content were remained. The observation that GLI degraded in strong acidic and neutral medium was consistent with the previous report.3 The presence of sulfonylurea moiety in GLI makes it susceptible to hydrolytic to produce two degradation products as displayed in Fig. 3C. In order to explain the solution stability enhancement of [TBP][GLI] in neutral media (pH 7.4), 2D NOESY was utilized to explore the intermolecular interactions. D2O was used to prepare pH 7.4 buffer solution. As seen in Fig. 3B, the 1H–1H-NOESY cross-peak between the protons on the benzene ring of GLI and the protons on the carbon chain of tetrabutylphosphonium cation was observed, indicating potential intermolecular NOE interactions of [TBP][GLI] when dissolved in pH 7.4 buffer solution.
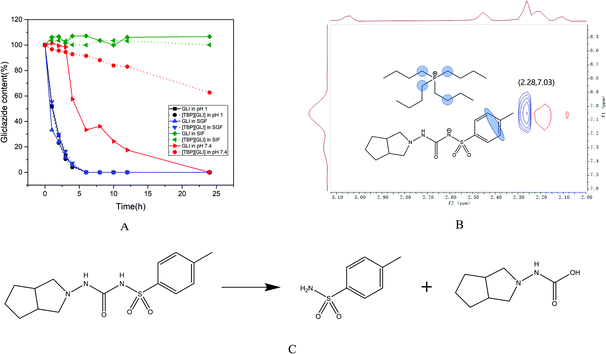 | ||
| Fig. 3 Solution stability of GLI and [TBP][GLI] (A), contour plot of the 1H–1H-NOESY spectrum of [TBP][GLI] in pH 7.4 buffer solution (B), typical degradation route of GLI (C). | ||
The salt formation site in the sulfonylurea moiety of GLI and the existence of ion pair in neutral solution were benefit for the stability enhancement of [TBP][GLI]. However, in strong acidic environment, such interactions could not be found by 2D NOESY experiment, which meant that GLI and the counterion were not existed in the form of ion pair to prevent the even faster degradation of GLI from strong acid.
3.3 Partition coefficients
The value of log![[thin space (1/6-em)]](https://www.rsc.org/images/entities/char_2009.gif) P and log
P and log![[thin space (1/6-em)]](https://www.rsc.org/images/entities/char_2009.gif) D7.4 were listed in Table 2. [TBP][GLI] had a lower log
D7.4 were listed in Table 2. [TBP][GLI] had a lower log![[thin space (1/6-em)]](https://www.rsc.org/images/entities/char_2009.gif) P and log
P and log![[thin space (1/6-em)]](https://www.rsc.org/images/entities/char_2009.gif) D7.4 than GLI, while [P6,6,6,14][GLI] showed improvement in log
D7.4 than GLI, while [P6,6,6,14][GLI] showed improvement in log![[thin space (1/6-em)]](https://www.rsc.org/images/entities/char_2009.gif) P and log
P and log![[thin space (1/6-em)]](https://www.rsc.org/images/entities/char_2009.gif) D7.4 values when comparing with GLI. The lipophilic properties of the GLI-based ionic liquids and GLI were ranked as follows: [P6,6,6,14][GLI] > GLI > [TBP][GLI], which was opposite to the rank of the equilibrium solubility in Section 3.4.
D7.4 values when comparing with GLI. The lipophilic properties of the GLI-based ionic liquids and GLI were ranked as follows: [P6,6,6,14][GLI] > GLI > [TBP][GLI], which was opposite to the rank of the equilibrium solubility in Section 3.4.
![[thin space (1/6-em)]](https://www.rsc.org/images/entities/char_2009.gif) P and log
P and log![[thin space (1/6-em)]](https://www.rsc.org/images/entities/char_2009.gif) D7.4 of GLI and its two ILs
D7.4 of GLI and its two ILs
| Compound | Solubility (μg ml−1) | log![[thin space (1/6-em)]](https://www.rsc.org/images/entities/char_2009.gif) P P |
log![[thin space (1/6-em)]](https://www.rsc.org/images/entities/char_2009.gif) D7.4 D7.4 |
|||||||
|---|---|---|---|---|---|---|---|---|---|---|
| Water | PBS 7.4 | SGF | SIF | Blank FaSSIF | FaSSIF | Blank FeSSIF | FeSSIF | |||
| a Not detected at the end of the test.b Multiples when compare [TBP][GLI] to GLI. | ||||||||||
| GLI | 43.52 ± 1.67 | 1586.68 ± 102.85 | nda | 583.91 ± 22.97 | 190.59 ± 0.63 | 196.12 ± 3.32 | 28.68 ± 0.99 | 30.13 ± 1.07 | 1.71 ± 0.03 | 0.45 ± 0.01 |
| [TBP][GLI] | 2153.19 ± 119.86 | 4102.62 ± 192.56 | nda | 981.52 ± 23.03 | 484.05 ± 0.42 | 486.71 ± 22.83 | 49.82 ± 17.81 | 53.39 ± 10.48 | 1.36 ± 0.03 | 0.25 ± 0.02 |
| [P6,6,6,14][GLI] | 1.51 ± 0.13 | 301.87 ± 6.82 | nda | 102.43 ± 11.54 | 32.14 ± 1.56 | 34.53 ± 2.79 | nda | nda | 2.72 ± 0.24 | 0.69 ± 0.02 |
| [TBP][GLI] vs. GLIb | 49.48 | 2.58 | 1.68 | 2.54 | 2.48 | 0.80 | 0.56 | |||
The induced cationic alkyl side-chain length of the counterion in [P6,6,6,14][GLI] could create strong van der Waals interactions with the hydrophobic part of octanol, so as to increase its solubility in organic media48 and exhibited higher log![[thin space (1/6-em)]](https://www.rsc.org/images/entities/char_2009.gif) P value than GLI. For [TBP][GLI], the short side-chain of counterion was not long enough, so that no obvious increasement of solubility in organic media was observed.
P value than GLI. For [TBP][GLI], the short side-chain of counterion was not long enough, so that no obvious increasement of solubility in organic media was observed.
3.4 Solubility characteristics
For BCS II drugs, it is meaningful to briefly discuss the solubility of the model compounds in various solvent systems. The equilibrium solubility of the two GLI-ILs and GLI in water, PBS 7.4 and simulated gastrointestinal fluids were summarized in Table 2. In this section, solubility results of all compounds, including ILs, all refers to the solubility of GLI.GLI displayed a slight solubility (43.52 ± 1.67 μg ml−1) in water, while GLI-based ILs exhibited various solubilities depended on the counter-ion. The solubility of [TBP][GLI] could achieve over 50-fold higher than that of GLI with the value of 2153.19 ± 119.86 μg ml−1, but the solubility of [P6,6,6,14][GLI] was much lower than that of GLI, only 1.5 μg ml−1 in water. The solubility tendency of GLI and GLI-ILs in PBS 7.4 were the same as that in water, i.e., [TBP][GLI] > GLI > [P6,6,6,14][GLI]. Solubility in simulated gastrointestinal fluids were also determined to better understand the in vivo behavior. In SGF, the solubility of all three compounds were under the limit of quantitation of HPLC method (con. <200 ng ml−1). In four kinds of simulated intestinal fluids, [TBP][GLI] exhibited the highest equilibrium solubility among three compounds as in water and in PBS 7.4. The solubility of all the compounds increased as the pH values increasing in the simulated intestinal media (pH of SIF is 6.8; pH of FaSSIF is 6.5 and pH of FeSSIF is 5). Higher pH may cause higher degree of drug ionization and then higher solubility. Another observation was that the increase solubility of GLI in the simulated intestinal media was only marginal as compared to the corresponding blank media (i.e. media having the same pH but not containing sodium taurocholate or lecithin), which suggested that both GLI and GLI ILs had low affinity for the mixed micelles present in FaSSIF and FeSSIF.
To further study the dissolution characteristics of GLI and [TBP][GLI], 24 h kinetic saturation solubilities were recorded. Tests for [P6,6,6,14][GLI] ionic liquid were not conducted because of its limited equilibrium solubilities. In water, GLI achieved a peak concentration at 4 h, and then the concentration decreased to its equilibrium solubility within 24 h. [TBP][GLI] showed quite a different behavior. The concentration of released drug increased rapidly and then achieved a plateau with much higher concentration than that of GLI (2053.29 μg ml−1 vs. 40.27 μg ml−1, p < 0.001) at 12 h (Fig. 4A). While in PBS 7.4, SIF and FaSSIF, a peak concentration was achieved within 6 h both for GLI and [TBP][GLI]. [TBP][GLI] could reach its peak and plateau more quickly than GLI itself. In addition, from the beginning to the end, the concentrations of [TBP][GLI] were higher than those of GLI with significantly difference (p < 0.05) at all sampling timepoints (Fig. 4B–D). In SGF, four sampling time points were added within the starting 45 min in consideration of its low equilibrium solubility. It was found that for [TBP][GLI] group, it could achieve a much higher concentration of 1677.49 ± 149.87 μg ml−1 within 10 min, and then sharply reduced to 200.84 ± 18.88 μg ml−1 within the next 5 min (Fig. 4E). That is, the “spring”49 phenomenon, which means a thermodynamically unstable, supersaturated solution of a drug can only be generated starting from a higher energy form of the drug (as compared to the crystalline powder). After supersaturation has been induced, concentration will decrease to its equilibrium solubility in a very short period. This was confirmed by the phenomenon that both groups experienced a concentration reduction after 2 h and the concentration was lower than 200 ng ml−1 after 24 h.
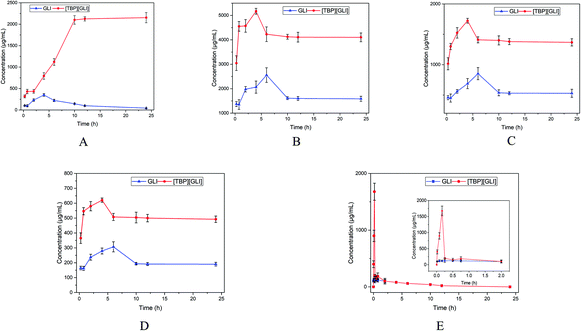 | ||
| Fig. 4 Concentration in μg ml−1 versus time in hours profiles of GLI and [TBP][GLI] over 24 h ((A) in ultrapure water; (B) in PBS 7.4; (C) in SIF; (D) in FaSSIF; (E) in SGF). | ||
For ionizable compounds, a potentiometric method, termed the chasing equilibrium method (CheqSol), has been developed to rapidly measure the kinetic and equilibrium solubilities.50 The result of CheqSol assay (Fig. 5A) showed that the supersaturation ratio (kinetic solubility/intrinsic solubility) of [TBP][GLI] was over 3-fold larger than that of GLI. The duration of supersaturation, calculated from the neutral species concentration versus time profiles determined by potentiometric titration, was 8.33 ± 0.83 min for GLI and 25.27 ± 2.02 min for [TBP][GLI], respectively (Fig. 5B). The duration observed for [TBP][GLI] was significantly longer as compared to the GLI, which could potentially improve bioavailability, in particular for poorly soluble compounds whose absorption are limited due to the low in vivo GI concentrations.50
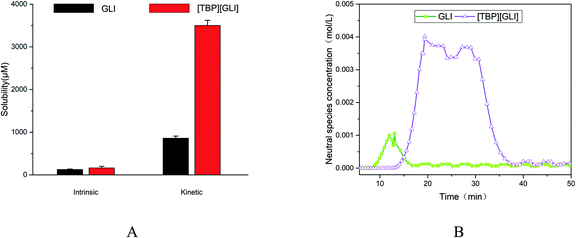 | ||
| Fig. 5 Supersaturation profiles of GLI and [TBP][GLI] ((A) intrinsic and kinetic solubility; (B) neutral species concentration–time profile). | ||
3.5 Stable configurations, electrostatic potential and molecular dynamic simulations
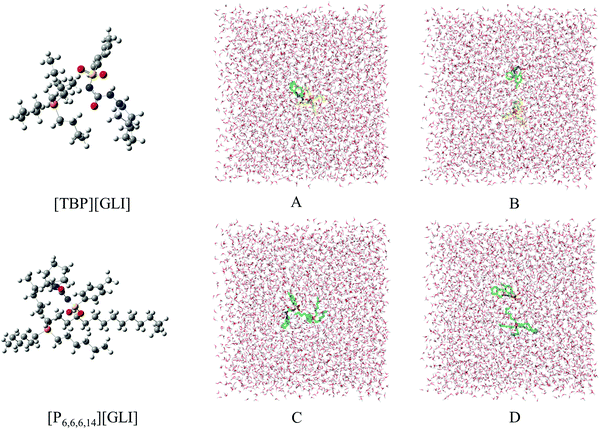
Computational chemistry, including stable configurations and molecular dynamic simulations, was conducted to better understand the structures and solubility results of the ILs, respectively.The optimized stable geometries for ion pairs of GLI ILs were displayed in the left column of Fig. 6 and the corresponding interaction energy between cation and anion were listed in Table 3. The interaction energy (ΔEint) were −1393.68 kJ mol−1 and −1378.52 kJ mol−1 for [TBP][GLI] and [P6,6,6,14][GLI] respectively, which were both at a very high level and the difference between them was just around 1%. As a stability index, the higher interaction energy implies better stability.51 In a previous work, Wang et al. reported the interaction energies of a set of aprotic ILs including [Bmim][NO3], [BuPy][NO3], [Pyr14][NO3], [PP14][NO3] and [Bu-choline][NO3].51 The highest energy among these ILs was only −363.38 kJ mol−1. The prepared GLI-based ILs in this article showed much higher energies, demonstrating the good stability of the neat ion pairs.
| IL | Eion-pair (hartree) | Ecation (hartree) | ΔEint (kJ mol−1) |
|---|---|---|---|
| [TBP][GLI] | −2344.567163 | −972.758903 | −1393.68 |
| [P6,6,6,14][GLI] | −2973.639662 | −1601.825629 | −1378.52 |
Electrostatic potential (ESP) was used to qualitatively understand the potential properties of [TBP][GLI]. The surface of ESP analysis was coloured using a blue-red scale (Fig. 1). The most positively charged region in red was near the central phosphorus atom on the TBP part and the most negatively charged one in blue was near the sulfonyl group on the GLI part, which provided strong electrostatic interactions between each other. The modeling of the [TBP][GLI] formation was consistent with the structure characterization result.
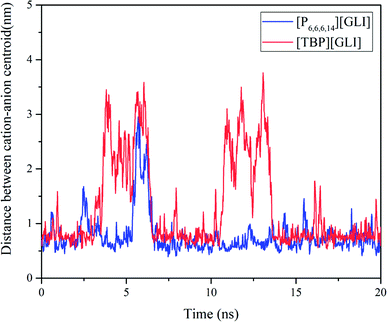
Molecular dynamics (MD) simulation was utilized to understand the state of ILs in solution at molecular level.51 To simplify the calculation, only one ion pair was put in the simulation system. Considering the different size of ion pair, 4043 and 4023 water molecules were put in the system for [TBP][GLI] and [P6,6,6,14][GLI], respectively. The simulated results were displayed in Fig. 6, which clearly revealed the state of combined or separated ion pair of GLI ILs in aqueous circumstance. Time evolution of the distance between the cation–anion centroid of the ILs could be used to evaluate the interaction strength between anion and cation. As seen from Fig. 7, the baseline represented the distances of contact ion pairs was around 0.75 nm and 0.50 nm for [TBP][GLI] and [P6,6,6,14][GLI], respectively. For [TBP][GLI], the time period when distance was far above baseline was about 8 s, while for [P6,6,6,14][GLI], this time period was only about 4 s. The deviation degree above baseline of [P6,6,6,14][GLI] was also lower than that of [TBP][GLI]. The shorter time period when distance was far above baseline and the lower deviation degree indicated a more stable ion pair could be formed in water for [P6,6,6,14][GLI] than [TBP][GLI]. These results could partially explain the higher aqueous solubility of [TBP][GLI] than [P6,6,6,14][GLI], that is, less stable ion pairs would help its dissolution and make it easy for cation and anion to tear apart and form interactions with water molecules.
3.6 Gastrointestinal tract parallel artificial membrane permeability assay (GIT-PAMPA)
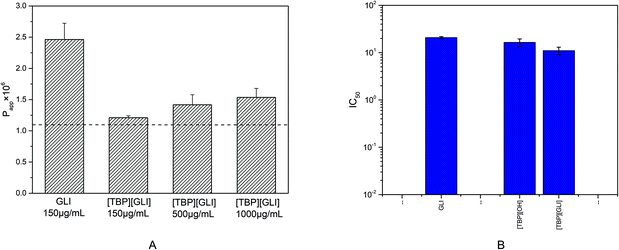
The parallel artificial membrane permeability model (PAMPA), firstly introduced by Kansy et al. in 1998,52 has become widely used, especially in early drug discovery, to discriminate lead compounds by human intestinal permeability in vitro53 since it is more cost-effective, less complex, and less time-consuming than the conventional cellular methods. Compounds with permeability above 1.10 × 10⁻⁶ cm s−1 was considered to have the ability to be absorbed in the intestine through passive transcellular pathway and a high human intestinal absorption fraction (Fa) (≥85%) can be anticipated.54Only one dose of 150 μg ml−1 was administrated to the donor because of the solubility limitation of GLI itself (178 μg ml−1) in the experimental buffer solutions. For [TBP][GLI], three dose level of 150 μg ml−1, 500 μg ml−1 and 1025 μg ml−1 (its equilibrium solubility in Tris buffer pH 6.5) were applied. The permeability value of GLI was 2.46 × 10⁻⁶ cm s−1 (Fig. 8A). The formation of [TBP][GLI] decreased the intestinal permeability of GLI. The Papp values of [TBP][GLI] with different dosage were 1.21 × 10⁻⁶ cm s−1, 1.42 × 10⁻⁶ cm s−1 and 1.53 × 10⁻⁶ cm s−1 respectively, which showed no statistically significant differences. The permeability value of [TBP][GLI] was still above the critical value, indicating that intestinal transportation would not be a problem after the IL formation with TBP.
3.7 Cytotoxicity test
Caco-2 cells are commonly used physiological model for obtaining first rough estimation of intestinal barrier and transport toxicity.55The cytotoxic effect of GLI, [TBP][GLI] and the corresponding counterion tetrabutylphosphonium hydroxide ([TBP][OH]) on Caco-2 cells were expressed as IC50 values and plotted in Fig. 8B. GLI showed a low toxicity with the IC50 value at mM level (20.80 ± 1.11 mM). The counterion showed slightly higher toxicity than GLI, as evidenced by the IC50 values of 16.47 ± 3.24 mM. The calculated IC50 value of [TBP][GLI] was two times lower than that of GLI (11.02 ± 2.08 mM vs. 20.80 ± 1.11 mM), but were still of the same order of magnitude. Overall, the counterion chosen in this study was safe, and the ionic liquid consists of it could not cause severe cytotoxicity problem for further oral pharmaceutical use.
3.8 Drug load verification and quantification of GLI-loaded mesoporous silica particles
The drug loading of GLI-loaded mesoporous silica particles was monitored by light microscopy with 320× magnification. Blank MSP displayed a transparent, spherical and hollow structure (Fig. 9A). Some broken particles were observed because of the fragility of the porous structure. Fig. 9B and C showed the typical structure of GLI and [TBP][GLI] ionic liquid respectively. GLI was plate-shaped crystals. For [TBP][GLI], no tiny crystal particle was found, which was fit with its amorphous nature. Fig. 9D was the micrography of physical mixture of blank MSP and crystalline GLI (GLI + MSP). The observed transparent spherical structure of blank MSP and unchanged crystalline GLI, indicated no change of solid state for both materials during the mix process. Since the pores of the blank MSP were filled by GLI or [TBP][GLI] ionic liquid, the internal structure of MSP turned into non-transparent (Fig. 9E and F). Besides, no more GLI crystals or transparent liquid state [TBP][GLI] were found. This provided evidence that GLI or [TBP][GLI] ionic liquid was encapsulated into the blank MSP by addition of drug solution. The maximum and uniform drug loading of 25.03 ± 0.52% and 25.12 ± 0.36% (calculated by GLI) were achieved (RSD < 2%) for GLI/MSP and [TBP][GLI]/MSP, respectively.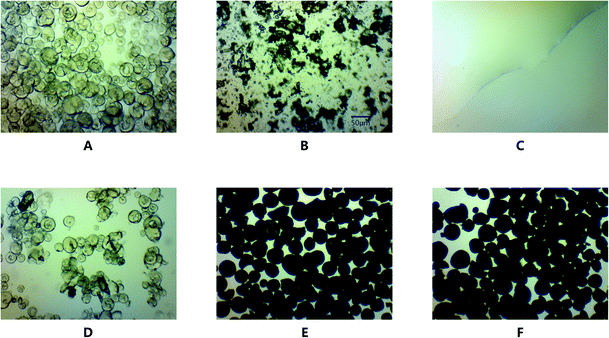 | ||
| Fig. 9 Light microscopy pictures of blank MSP (A), GLI (B), [TBP][GLI] (C), GLI + MSP (D), GLI/MSP (E), and [TBP][GLI]/MSP (F) (magnification 320×, scale = 50 μm). | ||
3.9 Solid-state characteristics of GLI-loaded mesoporous silica particles
SEM measurements were conducted to observe the morphology of GLI-loaded mesoporous silica particles and the pictures were taken at two different magnifications: 200× and 2000×, as shown in Fig. 10. Picture A and picture a both showed the bulk crystal structure of GLI. Similar to Fig. 9, the spherical and mesoporous structure of the blank MSP were confirmed by picture B and picture b. Crystalline GLI and spherical blank MSP were both displayed in picture C and several crystalline drug particles scattered around the blank MSP can be observed in picture c with 2000× magnifications. By and large, the drug was found to be uniformly adsorbed within the pores of MSP in GLI/MSP systems as shown in picture D. Drug particles in the pore and limited tiny surface precipitation can be seen in picture d. In picture E and picture e, no other solids except the spherical and mesoporous structure of MSP could be observed, indicating no phase transition were occurred for [TBP][GLI] ionic liquid. The size of the drug-loading MSPs in both picture D and picture E was larger than blank MSP in picture B, which was consistent with particle size distribution results which would be discussed later.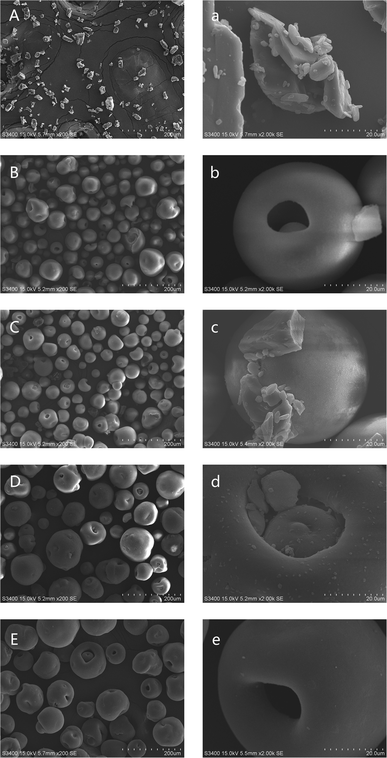 | ||
| Fig. 10 SEM images of GLI (A/a), blank MSP (B/b), GLI + MSP (C/c), GLI/MSP (D/d) and [TBP][GLI]/MSP (E/e) at different magnifications. Left: 200× magnification, right: 2000× magnification. | ||
The specific surface area and particle size distribution of blank MSP, GLI/MSP and [TBP][GLI]/MSP were listed in Table 4. The specific surface area of blank MSP was 231.364 m2 g−1. The process of drug loading resulted in a significant decrease in the specific surface area of MSP. At the same API content level, the specific surface area of [TBP][GLI]/MSP was only 11.04% of GLI/MSP, which meant [TBP][GLI] occupied more space and surface area than GLI. As a liquid, [TBP][GLI] had better fluidity, which allowed it easier to enter the pores and lower the surface area. DLS results revealed that blank MSP had an average size of 14.169 μm and a wide size distribution with the span value of 2.876. Loading of GLI or [TBP][GLI] in the pores increased the particle size to 31.650 μm and 34.086 μm respectively. In addition, GLI/MSP and [TBP][GLI]/MSP exhibited narrow size distribution with the smaller span values of 2.363 and 1.087, which was beneficial to the further formulation development.
| Sample | Specific surface area (m2 g−1) | Mean particle size (μm) | Span |
|---|---|---|---|
| Blank MSP | 231.364 | 14.169 | 2.876 |
| GLI/MSP | 101.763 | 31.650 | 2.363 |
| [TBP][GLI]/MSP | 11.230 | 34.086 | 1.087 |
To investigate the solid state of GLI in the mesoporous silica particles formulation, PXRD tests were performed. The crystal nature of GLI and amorphous nature of [TBP][GLI] were confirmed in Section 3.1. From Fig. 11A, there were no characteristic diffraction peaks for blank MSP, demonstrated its amorphous nature. For the physical mixture of GLI and MSP, characteristic diffraction peaks of GLI at 2θ = 10.54, 15.00, 17.14, 18.22, 20.82, 22.06° were observed, illustrating that the crystal form of GLI was not changed and there were no interactions between GLI and blank MSP. GLI was transformed to amorphous state after it was loaded into the MSP, which was evidenced by the PXRD spectrum of GLI/MSP without any diffraction peaks. This transformation may be attributed to the tiny pore size of the carrier, interactions between GLI and the silicate groups on the pore surfaces, and rapid evaporation of the solvent.56 The amorphous state was also found in the PXRD pattern of [TBP][GLI]/MSP, which was in consistent with the SEM observation.
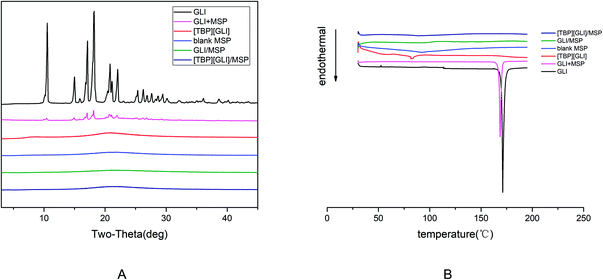 | ||
| Fig. 11 X-ray diffractogram patterns (A) and DSC thermograms (B) showing: GLI, [TBP][GLI], blank MSP, GLI + MSP, GLI/MSP and [TBP][GLI]/MSP. | ||
DSC measurements of GLI, [TBP][GLI], blank MSP, GLI + MSP, GLI/MSP and [TBP][GLI]/MSP were performed. The results were in accordance with PXRD results. As seen in Fig. 11B, a melting peak at 168.60 °C were observed in the DSC curve of GLI + MSP, which was slightly lower than that of GLI (171.18 °C). No obvious melting peaks were found in the DSC curve of GLI/MSP, confirming that GLI was existed as amorphous form in the formulation. Meanwhile, no melting endotherm behavior was detected for [TBP][GLI]/MSP, which pointed out that the ionic liquid kept its amorphous state in the formulation.
3.10 In vitro dissolution test
In vitro dissolution test constitutes an important activity in drug formulation development and quality control. Transfer dissolution test in this paper simulated the dissolution behavior of the formulations first in the gastric compartment and then in the small intestinal condition. Considering the instability of GLI and “spring” phenomenon of [TBP][GLI] in strong acidic environment, enteric-coated capsules were used to encapsulating the drug-loaded MSP.The release profiles of [TBP][GLI]/MSP, GLI/MSP, [TBP][GLI] and GLI were displayed in Fig. 12. All the four groups stayed stable in the SGF stage and did not release any drugs. During the FaSSIF stage, [TBP][GLI]/MSP capsules released fast and could reach 100% release within 60 min. GLI/MSP could also achieve a fast release and released 86.85 ± 1.36% of GLI at 210 min. The cumulative release amount at the end of the experiment ranked as follows: [TBP][GLI]/MSP > GLI/MSP > [TBP][GLI] > GLI.
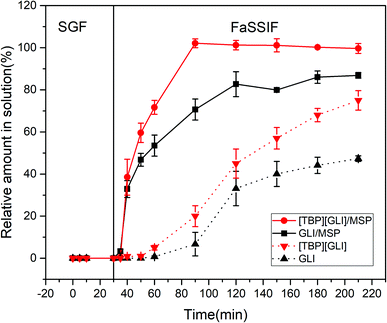 | ||
| Fig. 12 In vitro transfer cumulative-release profiles for enteric capsules of GLI, [TBP][GLI] and their corresponding MSPs. | ||
With high water solubility, [TBP][GLI] was expected to exhibit a favorable dissolution rate in FaSSIF media. However, neat IL formed large semisolid substance in the dissolution media upon the disintegration of the capsule shell, resulting in the smaller surface area and slower release profile in this condition. This result was similar with a previous report.57 [TBP][GLI]/MSP enhanced the dissolution by increasing surface area as compared to neat [TBP][GLI], since that large contacting area was achieved after loading of [TBP][GLI] into blank MSP. Comparing to neat GLI, GLI/MSP also showed improved dissolution profiles. Except for the increase of exposed surface area, amorphous state of GLI in GLI/MSP also contributed to the results. Though the same amorphous state as [TBP][GLI]/MSP, GLI/MSP could not reach total release at 210 min.
Better dissolution profile of [TBP][GLI]/MSP than GLI/MSP could be explained by the following aspects. First, [TBP][GLI] exerted improved solubility characteristics and supersaturation properties than GLI as we mentioned before. Second, although GLI was amorphous in GLI/MSP, it could recrystallized58 in the dissolution media and caused incomplete release.
4. Conclusions
In this work, [TBP][GLI] IL was successfully prepared and systemic characterized for the first time. Improved solubility characteristics of GLI after IL formation were observed, including 50-fold higher aqueous solubility and 3-fold larger supersaturation ratio than those of GLI. These results were verified by molecular dynamic simulations. With less stable ion pairs in aqueous environment, it was easy for cation and anion of [TBP][GLI] to tear apart and form interaction with water molecules. Besides, stability improvement in neutral media was also found. The prepared [TBP][GLI] exhibited intestinal transportation ability and safety as evidenced by the in vitro GIT-PAMPA tests and cytotoxicity experiments of Caco-2 cell. [TBP][GLI]/MSP was successfully prepared using AEROPERL® 300 Pharma with average particle size of 30–40 μm. Finally, [TBP][GLI]/MSP loaded enteric capsules exhibited improved dissolution properties (100% release within 60 min) as demonstrated by in vitro dissolution test. Therefore, IL technology represents a useful and promising oral preparation strategy to improve absorption properties of GLI.Author contributions
Bijian Zhou: methodology, investigation, writing – original draft. Dan Teng: investigation, formal analysis. Jinghui Li: validation. Yanhong Zhang: software. Minghui Qi: resources. Minghuang Hong: conceptualization, supervision, funding acquisition, methodology, writing – review & editing. Guo-Bin Ren: conceptualization, supervision, funding acquisition, project administration.Conflicts of interest
There are no conflicts to declare.Acknowledgements
The authors acknowledge the financial support received from Natural Science Foundation of Shanghai (No. 20ZR1413600) and the National Natural Science Foundation of China (No. 21576080), for their support and encouragement in carrying out his college work.References
- E. Ahlqvist, R. B. Prasad and L. Groop, Diabetes, 2020, 69, 2086 CrossRef CAS PubMed.
- S. R. Mishra, M. Waller, H. F. Chung and G. D. Mishra, Maturitas, 2022, 155, 14–23 CrossRef PubMed.
- G. Bansal, M. Singh and K. C. Jindal, Chromatographia, 2007, 66, 751–755 CrossRef CAS.
- A. Mooranian, R. Negrulj, S. Mathavan, J. Martinez, J. Sciarretta, N. Chen-Tan, T. Mukkur, M. Mikov, M. Lalic-Popovic, M. Stojancevic, S. Golocorbin-Kon and H. Al-Salami, J. Pharm. Innovation, 2014, 9, 150–157 CrossRef PubMed.
- S. P. Chan and S. Colagiuri, Diabetes Res. Clin. Pract., 2015, 110, 75–81 CrossRef CAS PubMed.
- O. Dwichandra Putra, E. Yonemochi and H. Uekusa, Cryst. Growth Des., 2016, 16, 6568–6573 CrossRef CAS.
- J. Varshosaz, R. Talari, S. A. Mostafavi and A. Nokhodchi, Powder Technol., 2008, 187, 222–230 CrossRef CAS.
- Y. Özkan, T. Atay, N. D
![[i with combining dot above]](https://www.rsc.org/images/entities/char_0069_0307.gif) kmen, A. Işimer and H. Y. Aboul-Enein, Pharm. Acta Helv., 2000, 74, 365–370 CrossRef.
kmen, A. Işimer and H. Y. Aboul-Enein, Pharm. Acta Helv., 2000, 74, 365–370 CrossRef. - G. Yuan, W. Shanshan, Z Jianjun, Peop. Rep. China Pat., CN104447502-A, 2015 Search PubMed.
- S. Jondhale, S. Bhise and Y. Pore, AAPS PharmSciTech, 2012, 13, 448–459 CrossRef CAS PubMed.
- R. Chadha, D. Rani and P. Goyal, CrystEngComm, 2016, 18, 2275–2283 RSC.
- R. Chadha, D. Rani and P. Goyal, Pharm. Res., 2017, 34, 552–563 CrossRef CAS PubMed.
- A. Samie, G. R. Desiraju and M. Banik, Cryst. Growth Des., 2017, 17, 2406–2417 CrossRef CAS.
- A. Doomkaew, B. Prutthiwanasan and L. Suntornsuk, J. Pharm. Biomed. Anal., 2015, 102, 119–128 CrossRef CAS PubMed.
- S. P. Kelley, A. Narita, J. D. Holbrey, K. D. Green, W. M. Reichert and R. D. Rogers, Cryst. Growth Des., 2013, 13, 965–975 CrossRef CAS.
- K. Paduszynski, K. Klebowski and M. Krolikowska, J. Mol. Liq., 2021, 344, 117631 CrossRef CAS.
- W. L. Hough, M. Smiglak, H. Rodríguez, R. P. Swatloski, S. K. Spear, D. T. Daly, J. Pernak, J. E. Grisel, R. D. Carliss, M. D. Soutullo, J. J. H. Davis and R. D. Rogers, New J. Chem., 2007, 31, 1429 RSC.
- A. Balk, U. Holzgrabe and L. Meinel, Eur. J. Pharm. Biopharm., 2015, 94, 291–304 CrossRef CAS PubMed.
- A. Balk, J. Wiest, T. Widmer, B. Galli, U. Holzgrabe and L. Meinel, Eur. J. Pharm. Biopharm., 2015, 94, 73–82 CrossRef CAS PubMed.
- R. Md Moshikur, M. R. Chowdhury, M. Moniruzzaman and M. Goto, Green Chem., 2020, 22, 8116–8139 RSC.
- C. Florindo, J. M. Araujo, F. Alves, C. Matos, R. Ferraz, C. Prudencio, J. P. Noronha, Z. Petrovski, L. Branco, L. P. Rebelo and I. M. Marrucho, Int. J. Pharm., 2013, 456, 553–559 CrossRef CAS PubMed.
- N. J. Babu and A. Nangia, Cryst. Growth Des., 2011, 11, 2662–2679 CrossRef CAS.
- A. Balk, T. Widmer, J. Wiest, H. Bruhn, J. C. Rybak, P. Matthes, K. Muller-Buschbaum, A. Sakalis, T. Luhmann, J. Berghausen, U. Holzgrabe, B. Galli and L. Meinel, Pharm. Res., 2015, 32, 2154–2167 CrossRef CAS.
- E. Janus, P. Ossowicz, J. Klebeko, A. Nowak, W. Duchnik, L. Kucharski and A. Klimowicz, RSC Adv., 2020, 10, 7570–7584 RSC.
- V. Fernandez-Stefanuto and E. Tojo, Proceedings, 2019, 9, 48 CrossRef.
- C. Kutza, H. Metz, J. Kutza, F. Syrowatka and K. Mader, Eur. J. Pharm. Biopharm., 2013, 84, 172–182 CrossRef CAS PubMed.
- S. Mohanta, S. K. Singh, B. Kumar, M. Gulati, J. Jyoti, S. Som, S. Panchal, I. Melkani, M. Banerjee, S. K. Sinha, R. Khursheed, A. K. Yadav, V. Verma, R. Kumar, D. S. Sharma, A. H. Malik, N. K. Pandey and S. Wadhwa, Int. J. Biol. Macromol., 2018, 120, 1975–1998 CrossRef CAS PubMed.
- J. Knapik, Z. Wojnarowska, K. Grzybowska, K. Jurkiewicz, A. Stankiewicz and M. Paluch, Mol. Pharm., 2016, 13, 1308–1316 CrossRef CAS PubMed.
- B. Zhou, S. Liu, H. Yin, M. Qi, M. Hong and G.-B. Ren, Eur. J. Pharm. Sci., 2021, 164, 105915 CrossRef CAS PubMed.
- L. Di and E. H. Kerns, Curr. Drug Metab., 2008, 9, 860–868 CrossRef CAS PubMed.
- M. Vertzoni, N. Fotaki, E. Kostewicz, E. Stippler, C. Leuner, E. Nicolaides, J. Dressman and C. Reppas, J. Pharm. Pharmacol., 2004, 56, 453–462 CrossRef CAS PubMed.
- E. Galia, E. Nicolaides, D. Hoerter, R. Loebenberg, C. Reppas and J. B. Dressman, Pharm. Res., 1998, 15, 698–705 CrossRef CAS PubMed.
- S. F. Boys and F. Bernardi, Mol. Phys., 1970, 19, 553–566 CrossRef CAS.
- T. Lu and F. Chen, J. Comput. Chem., 2012, 33, 580–592 CrossRef CAS PubMed.
- W. Humphrey, A. Dalke and K. Schulten, J. Mol. Graphics, 1996, 14, 33–38 CrossRef CAS PubMed.
- B. Hess, C. Kutzner, D. V. Der Spoel and E. Lindahl, J. Chem. Theory Comput., 2008, 4, 435–447 CrossRef CAS PubMed.
- J. P. Ulmschneider and M. B. Ulmschneider, J. Chem. Theory Comput., 2009, 5, 1803–1813 CrossRef CAS PubMed.
- J. M. Andanson, M. Traïkia and P. Husson, J. Chem. Thermodyn., 2014, 77, 214–221 CrossRef CAS.
- G. Bussi, D. Donadio and M. Parrinello, J. Chem. Phys., 2007, 126, 014101 CrossRef PubMed.
- R. Sadeghi and N. Ebrahimi, J. Phys. Chem. B, 2011, 115, 13227–13240 CrossRef CAS PubMed.
- B. Hess, J. Chem. Theory Comput., 2008, 4, 116–122 CrossRef CAS PubMed.
- A. Fortuna, G. Alves, P. Soares-da-Silva and A. Falcao, J. Pharm. Sci., 2012, 101, 530–540 CrossRef CAS PubMed.
- S. Papadimitriou and D. Bikiaris, J. Controlled Release, 2009, 138, 177–184 CrossRef CAS PubMed.
- S. Brunauer, P. H. Emmett and E. Teller, J. Am. Chem. Soc., 1938, 60, 309–319 CrossRef CAS.
- T. Makino, M. Kanakubo, T. Matsuki, E. Kamio, H. Takaba and H. Matsuyama, Fluid Phase Equilib., 2016, 420, 89–96 CrossRef CAS.
- M. Sobol, Chem. Aust., 2018, 28–29 Search PubMed.
- L. Di and E. H. Kerns, Curr. Drug Metab., 2008, 9, 860–868 CrossRef CAS PubMed.
- J. Stoimenovski, D. R. MacFarlane, K. Bica and R. D. Rogers, Pharm. Res., 2010, 27, 521–526 CrossRef CAS PubMed.
- J. Brouwers, M. E. Brewster and P. Augustijns, J. Pharm. Sci., 2009, 98, 2549–2572 CrossRef CAS PubMed.
- Y. L. Hsieh, G. A. Ilevbare, B. Van Eerdenbrugh, K. J. Box, M. V. Sanchez-Felix and L. S. Taylor, Pharm. Res., 2012, 29, 2738–2753 CrossRef CAS PubMed.
- H. Wang, M. Liu, Y. Zhao, X. Xuan, Y. Zhao and J. Wang, Sci. China: Chem., 2017, 60, 970–978 CrossRef CAS.
- M. Kansy, F. Senner and K. Gubernator, J. Med. Chem., 1998, 41, 1007–1010 CrossRef CAS PubMed.
- M. H. Oh, H. J. Lee, S. H. Jo, B. B. Park, S. B. Park, E. Y. Kim, Y. Y. Zhou, Y. H. Jeon and K. Lee, Biol. Pharm. Bull., 2017, 40, 419–424 CrossRef CAS PubMed.
- M. Matias, A. Fortuna, J. Bicker, S. Silvestre, A. Falcao and G. Alves, Eur. J. Pharm. Sci., 2017, 109, 334–346 CrossRef CAS PubMed.
- N. S. M. Vieira, J. C. Bastos, L. P. N. Rebelo, A. Matias, J. M. M. Araujo and A. B. Pereiro, Chemosphere, 2019, 216, 576–586 CrossRef CAS PubMed.
- O. Planinšek, B. Kovačič and F. Vrečer, Int. J. Pharm., 2011, 406, 41–48 CrossRef PubMed.
- C. Wang, S. A. Chopade, Y. Guo, J. T. Early, B. Tang, E. Wang, M. A. Hillmyer, T. P. Lodge and C. C. Sun, Mol. Pharm., 2018, 15, 4190–4201 CrossRef CAS PubMed.
- M. Aljohani, P. McArdle and A. Erxleben, Drug Dev. Ind. Pharm., 2021, 47, 302–307 CrossRef CAS PubMed.
Footnote |
| † Electronic supplementary information (ESI) available. See DOI: 10.1039/d1ra07499g |
| This journal is © The Royal Society of Chemistry 2022 |

