 Open Access Article
Novel mesoporous Co3O4–Sb2O3–SnO2 active material in high-performance capacitive deionization
Ehsan Delfani a,
Alireza Khodabakhshia,
Sajjad Habibzadeh
 *a,
Leila Naji
 b and
Mohammad Reza Ganjalic
aSurface Reaction and Advanced Energy Materials Laboratory, Department of Chemical Engineering, Amirkabir University of Technology (Tehran Polytechnic), P.O. Box 15875-4413, Tehran, Iran. E-mail: sajjad.habibzadeh@mail.mcgill.ca
bDepartment of Chemistry, Amirkabir University of Technology (Tehran Polytechnic), P.O. Box 15875-4413, Tehran, Iran
cCenter of Excellence in Electrochemistry, School of Chemistry, College of Science, University of Tehran, P.O. Box 11155-4563, Tehran, Iran
First published on 4th January 2022
Abstract
Capacitive deionization (CDI), as an emerging eco-friendly electrochemical brackish water deionization technology, has widely benefited from carbon/metal oxide composite electrodes. However, this technique still requires further development of the electrode materials to tackle the ion removal capacity/rate issues. In the present work, we introduce a novel active carbon (AC)/Co3O4–Sb2O3–SnO2 active material for hybrid electrode capacitive deionization (HECDI) systems. The structure and morphology of the developed electrodes were determined using X-ray diffraction (XRD), X-ray photoelectron spectroscopy (XPS), scanning electron microscopy (SEM), energy-dispersive X-ray spectroscopy (EDS), and Brunauer–Emmett–Teller (BET)/Barrett–Joyner–Halenda (BJH) techniques, as well as Fourier-transform infrared (FT-IR) spectroscopy. The electrochemical properties were also investigated by cyclic voltammetry (CV) and impedance spectroscopy (EIS). The CDI active materials AC/Co3O4 and AC/Co3O4–Sb2O3–SnO2 showed a high specific capacity of 96 and 124 F g−1 at the scan rate of 10 mV s−1, respectively. In addition, the newly-developed electrode AC/Co3O4–Sb2O3–SnO2 showed high capacity retention of 97.2% after 2000 cycles at 100 mV s−1. Moreover, the electrode displayed excellent CDI performance with an ion removal capacity of 52 mg g−1 at the applied voltage of 1.6 V and in a solution of potable water with initial electrical conductivity of 950 μs cm−1. The electrode displayed a high ion removal rate of 7.1 mg g−1 min−1 with an excellent desalination–regeneration capability while retaining about 99.5% of its ion removal capacity even after 100 CDI cycles.
1. Introduction
The shortage of potable water has lately turned into an inevitable challenge. Therefore, freshwater production from brackish water (salinity < 5 g L−1)1 through the desalination process has been looked upon as a promising resolution to address the water crisis.2,3 Several desalination technologies have been applied to remove dissolved solids in water.3 Namely, the large-scale desalination techniques for greater salt concentration encompass reverse osmosis (RO) and thermal separation systems. Such techniques which eliminate the major phase (i.e., water) from the solution suffer from high energy consumption and complex operation.4,5 However, water with lower salt concentration, e.g., brackish water, can be effectively desalinated with various newly developed techniques. Specifically, capacitive deionization (CDI) has been recognized as an eco-friendly electrochemical desalination technology for removing ionic species from aqueous solutions, which has been engaged to desalinate brackish water and seawater.6–8In CDI technology, influent saltwater passes through two high capacitive porous electrodes with a separator in between. Such porous electrodes are charged with an applied voltage lower than 2 V. As a result, cations and anions are electrostatically adsorbed onto an electrical double layer of porous carbon electrodes, which resembles the principles of the electrical double-layer capacitors.7,9,10 Therefore, similar to the capacitors, the electrode materials should benefit from extensive ion accessibility, high specific surface area and electronic conductivity, fast ion mobility within the pore network, robust electrochemical stability, good wettability, low contact resistance between the electrode and the current collector, and more importantly low-cost active components.11,12
Thus far, numerous structures of carbon-based electrode materials, including activated carbon (AC), ordered mesoporous carbons (OMCs), carbon nanofibers (CNFs), carbon nanotubes (CNTs), carbon aerogel (CA), and graphene, have been investigated.10,13–15 However, the carbon-based supercapacitors are restricted by their ion adsorption capacity per available surface area.16,17 Moreover, these carbon materials cannot fully exploit the available capacitance in lower electrolyte concentrations due to ions' limited access through the porous structure.18 Therefore, hybrid electrodes, i.e., carbon composites such as carbon/carbon, carbon/polymer, carbon/metal oxide, and carbon/polymer/metal oxide composites, have widely been employed in high-performance CDI systems. This is due to its moderate pore size distribution and high specific surface area.11,19 Besides, hybrid electrode capacitive deionization (HECDI) combines adsorption mechanisms of non-faradaic and faradaic reactions. The former is based on the formation of electric double-layer capacitors, while the latter relies on the redox process occurring on the surface of the carbon/metal oxides electrodes.20 Besides, the carbon/metal oxide composites reveal enhanced desalination performance compared with pristine carbon materials. This is mostly due to the increase of ion removal capacity, improvement in wettability, selective adsorption of ionic species affecting the targeted ion adsorption, or modification of the surface charge of the carbon electrodes, which enhance the charge efficiency.11,12,20 Several metal oxides, including Co3O4,21 TiO2,22–24 Fe3O4,25 Fe2O3,24 MnO2,26 ZnO,21 ZrO2,27 CeO2,24 and SnO2 (ref. 28) have so far been used in various CDI systems and supercapacitor's applications. Cai and coworkers have reported NiCo2S4 nanotube arrays on Ni foam for supercapacitors, which displayed a specific capacity of 15.58 F cm−2 at 10 mA cm−2, and low capacity retention of 79.3% after 2000 cycles at 8 mA cm−2.29 Particularly, Co3O4, as the low-cost transition metal oxide, has fascinated more attention due to its high theoretical capacity of 3560 F g−1.30 Wang et al. synthesized 3D self-supported Co3O4@CoMoO4 core–shell nano-pine forest (NPF) for supercapacitor application, which showed the specific capacity of 1902 F g−1.31 Kandasamy et al. fabricated 2D Co3O4/graphene using a hydrothermal method, which presented a low specific capacity of 1.75 F cm−2 at 1 mA cm−2.32 However, Co3O4 suffers from poor electrical conductivity and cycling stability.33
Herein, we developed a composite electrode of AC and mixed metal oxides (MMO) for HCDI system. The Co3O4 and Co3O4–Sb2O3–SnO2 nanopowders have been synthesized by the solution combustion method. As a result, constructing a composite of AC/Co3O4 with SnO2 as a promising cycling stability agent and Sb2O3 as an electronic conductivity promoter seems to address the poor performance of the pure Co3O4.34–36 In the present study, we developed a synergetic approach to preparing a novel HCDI electrode composed of AC/Co3O4–Sb2O3–SnO2.
2. Experimental method
2.1. Chemicals and substrates
Activated carbon, polytetrafluoroethylene (PTFE), and dimethylformamide (DMF) were purchased from Sigma-Aldrich. In addition, cobalt(II) nitrate hexahydrate (Co(NO3)2·6H2O), tin(II) chloride dihydrate (SnCl2·2H2O), antimony(III) chloride (SbCl3), urea (CO(NH2)2), nitric acid (HNO3), and all other chemicals were provided from Merck.2.2. Synthesis of metal oxides
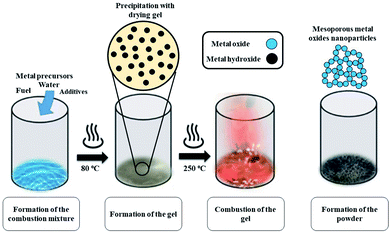
Mesoporous Co3O4 and Co3O4–Sb2O3–SnO2 nanoparticles were prepared by solution combustion synthesis (SCS) method similar to the approach were explained in our previous works.37,38 The growth mechanism of metal oxides preparation by SCS method is demonstrated in Fig. 1. The SCS method can be regarded into four steps; (1) formation of the combustion mixture, (2) formation of the gel, (3) combustion of the gel, and (4) formation of the powder. The pH increase by the urea decomposition (urea as the fuel) induces the metal hydroxides in the dried gel, which is subsequently transformed into metal oxides. This coincides with metal oxide nucleation.39 After burning the dried gel, the metal oxides particles form large aggregates. The aggregation mechanism determines the growth of the formed nuclei since the combustion reaction generates a considerable amount of heat. However, the mesoporous structure of the metal oxide can be somehow controlled by releasing a large number of gases such as CO2, N2, and NOx, etc. Hence, a trade-off of the generated heat and the gas evolution can shape the porous structure of the synthesized nanoparticles. In the synthesis process of Co3O4, (CO(NH2)2) and Co(NO3)2·6H2O were used as the fuel and oxidizer, respectively. The combustion reaction is illustrated as:
 | (1) |
 | (2) |
This reaction is also balanced for stoichiometric combustion. As a result of using the chloride precursors, HNO3 was used as combustion aid. In order to investigate the effect of thermal annealing on the electrochemical properties of the synthesized metal oxides, calcination processes of the synthesized samples were performed at 400 °C for 2 h.
2.3. Fabrication of composite electrodes
PVDF was first dissolved in DMF to synthesize the CDI electrodes at 50 °C. Next, AC, CB, and the synthesized metal oxides powder were added while stirred for one hour. Following evaporation of the excess solvent at 100 °C, the dense slurries were dropwise cast onto the graphite as the current collector. The fabricated electrodes were coated on graphite (as the substrate) for characterization, electrochemical, and CDI tests with an average mass load of 5 mg cm−2. Finally, the coated electrodes were dried in a fan-forced oven at 110 °C overnight. The corresponding mass ratios of each synthesized electrode are shown in Table 1.| Sample | Active materials | Mass ratio (%) |
|---|---|---|
| AC | AC + PVDF | 90![[thin space (1/6-em)]](https://www.rsc.org/images/entities/char_2009.gif) : :![[thin space (1/6-em)]](https://www.rsc.org/images/entities/char_2009.gif) 10 10 |
| AC/CB | AC + CB + PVDF | 80![[thin space (1/6-em)]](https://www.rsc.org/images/entities/char_2009.gif) : :![[thin space (1/6-em)]](https://www.rsc.org/images/entities/char_2009.gif) 10 10![[thin space (1/6-em)]](https://www.rsc.org/images/entities/char_2009.gif) : :![[thin space (1/6-em)]](https://www.rsc.org/images/entities/char_2009.gif) 10 10 |
| AC/Co3O4 | AC + CB + Co3O4 + PVDF | 70![[thin space (1/6-em)]](https://www.rsc.org/images/entities/char_2009.gif) : :![[thin space (1/6-em)]](https://www.rsc.org/images/entities/char_2009.gif) 10 10![[thin space (1/6-em)]](https://www.rsc.org/images/entities/char_2009.gif) : :![[thin space (1/6-em)]](https://www.rsc.org/images/entities/char_2009.gif) 10 10![[thin space (1/6-em)]](https://www.rsc.org/images/entities/char_2009.gif) : :![[thin space (1/6-em)]](https://www.rsc.org/images/entities/char_2009.gif) 10 10 |
| AC/Co3O4–Sb2O3–SnO2 | AC + CB + (Co3O4–Sb2O3–SnO2) + PVDF | 70![[thin space (1/6-em)]](https://www.rsc.org/images/entities/char_2009.gif) : :![[thin space (1/6-em)]](https://www.rsc.org/images/entities/char_2009.gif) 10 10![[thin space (1/6-em)]](https://www.rsc.org/images/entities/char_2009.gif) : :![[thin space (1/6-em)]](https://www.rsc.org/images/entities/char_2009.gif) 10 (70 10 (70![[thin space (1/6-em)]](https://www.rsc.org/images/entities/char_2009.gif) : :![[thin space (1/6-em)]](https://www.rsc.org/images/entities/char_2009.gif) 2.4 2.4![[thin space (1/6-em)]](https://www.rsc.org/images/entities/char_2009.gif) : :![[thin space (1/6-em)]](https://www.rsc.org/images/entities/char_2009.gif) 27.6) 27.6)![[thin space (1/6-em)]](https://www.rsc.org/images/entities/char_2009.gif) : :![[thin space (1/6-em)]](https://www.rsc.org/images/entities/char_2009.gif) 10 10 |
2.4. Electrodes characterization
An Inel Equinox 3000 X-ray diffractometer performed XRD for crystalline phase analysis. The FT-IR spectra were studied using NICOLET 10-Thermo Fisher Scientific (ATR). Further, X-ray photoelectron spectroscopy (XPS) tests were performed for the synthesized nanoparticles. Scanning SEM images of the electrodes were obtained using a VEGA3-TESCAN scanning electron microscope with Energy-dispersive X-ray spectroscopy. Nitrogen sorption isotherms were measured at 77.3 K on an automatic N2 adsorption/desorption instrument (Quantachrome Autosorb Automated Gas Sorption System), where the samples were outgassed in the vacuum at 300 °C for 3 h before the adsorption/desorption experiment. The BET method and the BJH model were used to obtain specific surface areas and pore size distributions.2.5. Electrochemical characterization of the electrodes
The electrochemical performances and capacitance measurement of the electrodes were evaluated with cyclic voltammetry (CV), galvanostatic charge–discharge (GCD), and electrochemical impedance spectroscopy (EIS) using a potentiostat (Zive sp100- Edaq). All electrochemical tests were conducted by a three-electrode system, consisting of the synthesized electrode, platinum, and Ag/AgCl, as the working, counter, and reference electrodes, respectively, and 1 M NaCl solution as electrolyte. The CV responses of the electrodes were measured at different scan rates varying from 10 to 100 mV s−1 and potentials between −0.3 and 0.7 V (vs. Ag/AgCl) in a 1 M of NaCl solution. The GCD tests of the electrode were performed at different current densities of 0.2, 0.4, 0.6, 0.8, 1, and 2 A g−1 in the potential window of −0.3 to 0.7 V (vs. Ag/AgCl) in a 1 M of NaCl solution. Impedance spectroscopy measurements were performed by applying a sinusoidal signal in the frequency range of 0.01 Hz to 10 kHz.The specific capacity values (CCV (F g−1)) of the synthesized composite electrodes were determined using the cyclic voltammetry curve according to eqn (3):40,41
 | (3) |
The calculated specific capacity (CGCD (F g−1)) by the GCD test is according to eqn (4).42
 | (4) |
2.6. CDI experiment
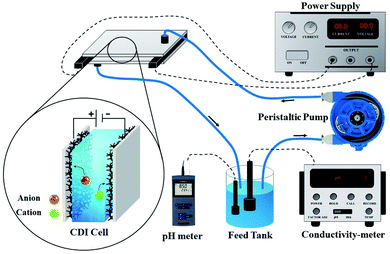
The desalination performances of the electrodes were examined by conducting batch-mode electrosorption experiments using a continuously recycling system. The schematic diagram of this system is presented in Fig. 2. Feed solution (ca. 160 mL) was continuously passed through the CDI system using a peristaltic pump at the flow rate of 20 mL min−1. The electrical conductivity and pH of the treated water were determined by the electrical conductivity meter and pH meter, as shown in Fig. 1. Treated effluent was redirected to the feed vessels until the electrical conductivity of the water became constant. Plexiglass sheet (20 cm × 20 cm × 1 cm) with fitting indentations were used as the supporting foundation for the CDI system, and a hallow silicon rubber was used to hold the electrodes separated by 1 mm.According to eqn (2), the ion removal capacity (IRC) in mg g−1 was defined as the number of removed ions per mass of electrode material.8
 | (5) |
3. Results and discussion
3.1. Characterization of synthesized materials and electrodes
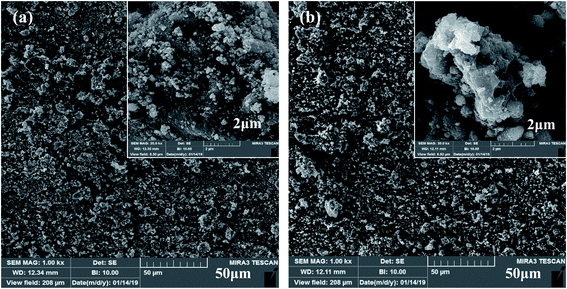
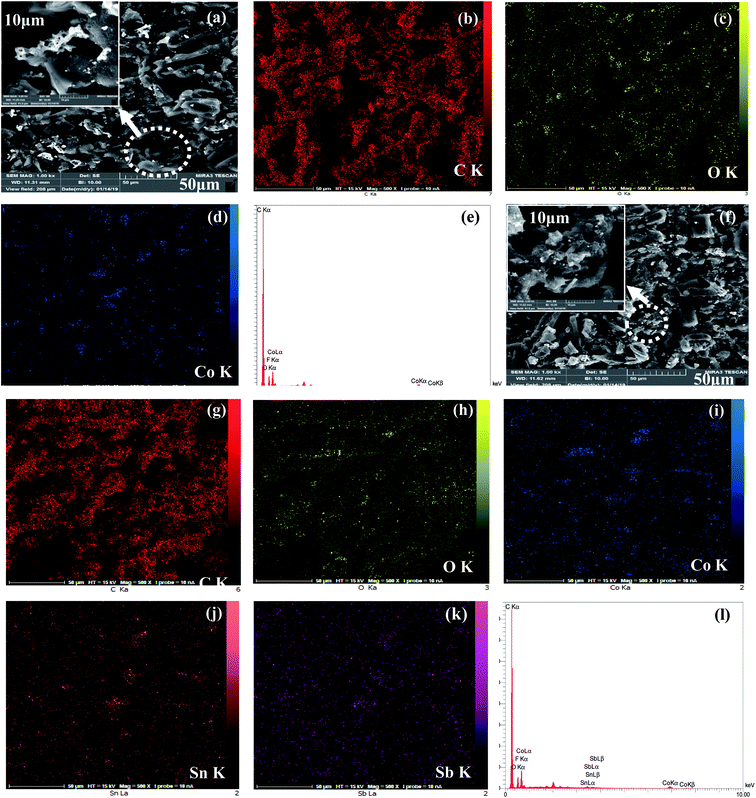
The surface morphologies of the Co3O4 and Co3O4–SnO2–Sb2O3 nanoparticles are demonstrated by using FE-SEM at different magnifications of 2 and 50 μm, as shown in Fig. 3(a) and (b). Fig. 3(a) and(b) shows the porous structures of Co3O4 and Co3O4–SnO2–Sb2O3 nanoparticles originated from the solution combustion synthesis. As shown in Fig. 4, the surface morphology and compositions of the synthesized electrodes were analyzed using SEM and EDS, respectively. Fig. 4(a) and (f) show the porous structures of AC/Co3O4 and AC/Co3O4–Sb2O3–SnO2 nanoparticles resulting from the presence of Co3O4 and Co3O4–Sb2O3–SnO2 nanoparticles. In addition, a lower degree of agglomeration is found for the coating material, including Sb and Sn, which is in line with the outcomes of the crystallite sizes (see Fig. 5(a)). Moreover, the composition of the electrodes is presented by EDS and elemental mapping (Fig. 4(b)–(e) and (g)–(k)). One can observe that the metal oxides are dispersed homogeneously in the electrode structure. The homogeneous porous structure of AC/Co3O4–Sb2O3–SnO2 nanoparticles can provide numerous channels for electrolyte transport which is beneficial for the CDI performance.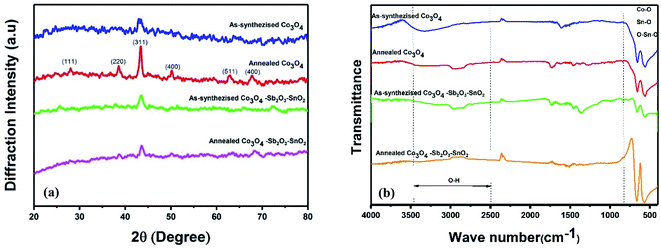 | ||
| Fig. 5 (a) XRD patterns of as-synthesized and annealed nanoparticles. (b) FT-IR spectrums of as-synthesized and annealed nanoparticles. | ||
Fig. 5(a) shows the XRD patterns of the synthesized samples. In the XRD patterns of as-synthesized Co3O4 and annealed Co3O4, the peaks at 2θ = 19.3°, 31.6°, 37°, 45.2°, 59.5°, 65.5°, are assigned to the diffraction of the crystalline planes with the miller indices of (111), (220), (311), (400), (511) and (440) planes of cubic spinel Co3O4 nanoparticles, which are more intense at annealed Co3O4 pattern.43,44 The crystallite size (D) of as-synthesized Co3O4 is determined by about 16.65 nm, calculated by the Debye–Scherrer's formula according to the eqn (6):
D = Kλ/β![[thin space (1/6-em)]](https://www.rsc.org/images/entities/char_2009.gif) cos cos![[thin space (1/6-em)]](https://www.rsc.org/images/entities/char_2009.gif) θ θ
| (6) |
| Samples | BET (m2 g−1) | Average pore size (nm) | Total pore volume (cm3 g−1) |
|---|---|---|---|
| As-synthesized Co3O4 | 54.60 | 15.40 | 0.2101 |
| Annealed Co3O4 | 27.12 | 24.88 | 0.2487 |
| As-synthesized Co3O4–Sb2O3–SnO2 | 99.82 | 6.34 | 0.1456 |
| Annealed Co3O4–Sb2O3–SnO2 | 91.63 | 8.01 | 0.1835 |
The chemical composition of the synthesized electrodes was characterized by FT-IR spectroscopy, as shown in Fig. 5(b). The two peaks at 570 cm−1 and 663 cm−1 correspond to the Co–O vibrations for all the synthesized samples.44–46 The molecular vibrations between 600 and 680 cm−1 indicate the fundamental stretching vibration of Sn–O and Sn–O–Sn in the as synthesized and annealed Co3O4–Sb2O3–SnO2 nanoparticles.47 The peak at 739 cm−1 is attributed to the Sb–O vibration.48 The peaks around 1550–1650 cm−1 and 2800–3000 cm−1 correspond to the bending vibration of absorbed molecular water and stretching vibrations of the OH group.44
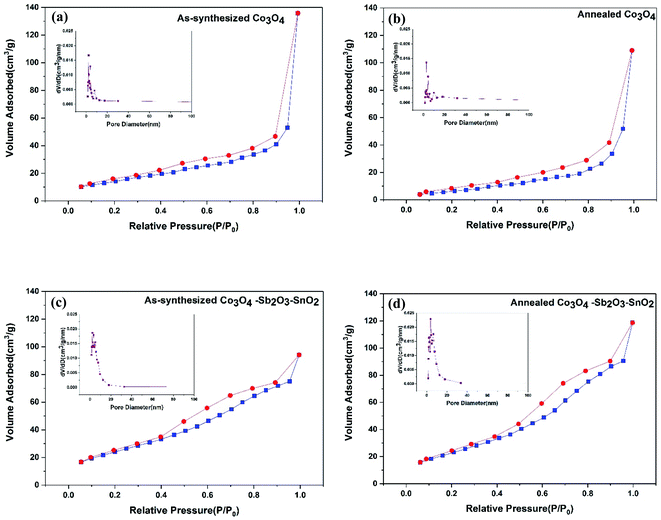
The nitrogen adsorption–desorption isotherms and the BJH pore-size distribution of all the synthesized active materials are shown in Fig. 6. The isotherms of as-synthesized Co3O4, annealed Co3O4, as-synthesized Co3O4–Sb2O3–SnO2, and annealed Co3O4–Sb2O3–SnO2 are shown from Fig. 6(a) to 4(d), respectively, which can be categorized as type IV according to the IUPAC classification.49
The specific BET surface areas, average pore sizes, and total pore volumes of the synthesized nanopowders are listed in Table 2. The result shows that the pore size of as-synthesized and calcined nanopowders is in the range of mesoporous (between 2 and 50 nm).15 It can be seen that the total pore volume for as-synthesized and annealed Co3O4 is greater than as-synthesized and annealed Co3O4–Sb2O3–SnO2 nanopowders, the broader pore size distribution in their structures leading to larger average pore size. However, the higher surface areas of the as-synthesized and annealed Co3O4–Sb2O3–SnO2 nanopowders can be attributed to their more mesoporous structure with greater ion-accessible sites. This can increase the specific capacitance and ion removal capacity by providing more available sites to proceed with the pseudocapacitive reaction.50 As a result, the AC/Co3O4–Sb2O3–SnO2 electrode displays efficient desalination using EDL and pseudocapacitive mechanisms.
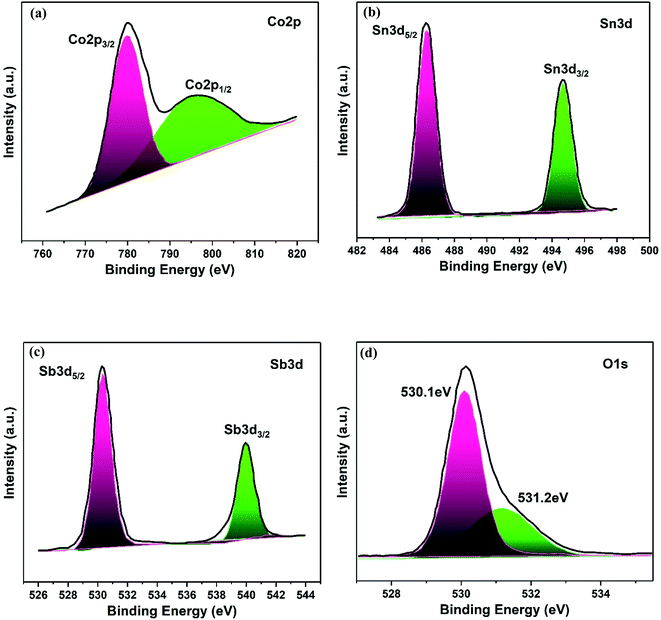
The elemental composition and electronic states of the Co3O4–Sb2O3–SnO2 nanopowder were investigated by XPS analysis, as demonstrated in Fig. 7. The Co 2p XPS spectra display a doublet with binding energies at 779.8 and 794.8 eV, corresponding to Co 2p3/2 and Co 2p1/2 (Fig. 7(a)), which are the characteristics of the Co3O4 phase.51 Furthermore, the high-resolution Sn 3d spectra of the Co3O4–Sb2O3–SnO2 nanopowder represent two symmetric doublet peaks are centered at 486.2 and 494.7 eV related to Sn 3d5/2 and Sn 3d3/2, indicating the presence of Sn in the oxidation of +4 (Fig. 7(b)).52 The Sb 3d5/2 and Sb 3d3/2 peaks at 529.9 and 539.2 are assigned to Sb3+, which illustrate the presence of Sb2O3 in Co3O4–Sb2O3–SnO2 nanopowder (Fig. 7(c)).53 As shown in Fig. 7(d), there are two distinct peaks. Precisely, the peak at 530.1 eV corresponds to the binding between oxygen and metal atoms, the peak at 531.2 eV is attributed to the oxygen vacancies.54
3.2. Electrochemical properties
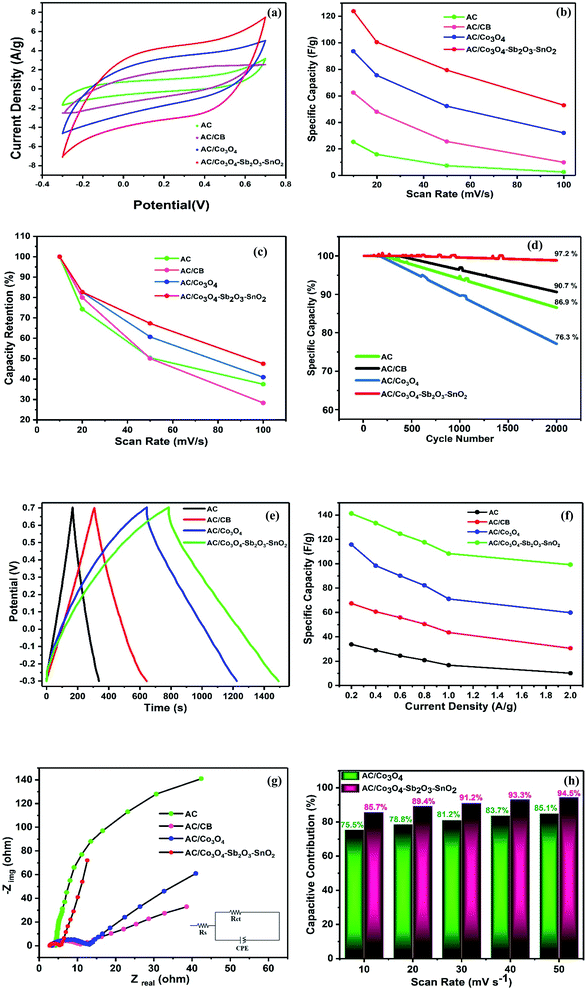
In order to characterize the electrochemical properties of the synthesized electrodes, CV and EIS techniques were employed. Fig. 8(a) shows the typical CV curves of the electrodes at the scan rate of 10 mV s−1 in 1 M NaCl electrolyte solution. According to the quasi-rectangular shapes of the diagrams without any prominent redox peaks, an excellent electrochemical double layer (EDL) capacitance behavior can be implied. Besides, symmetric voltammogram concerning the x-axis indicates a highly reversible capacitive behavior of the electrodes.55–57 The CV specific capacities for CDI electrodes were calculated by 33, 68, 96, and 124 F g−1 at the scan rate of 10 mV s−1 for AC, AC/CB, AC/Co3O4, AC/Co3O4–Sb2O3–SnO2 electrodes, respectively. It could be clearly seen that the AC/Co3O4–Sb2O3–SnO2 electrode reveals a remarkable improvement in AC capacitance due to the synergic effects resulting from pseudo-capacitance behavior of Co3O4–Sb2O3–SnO2 and EDLs property from AC.Moreover, the Co3O4–Sb2O3–SnO2 nanopowder shows the most specific surface area (see BET analysis in Table 2) among all the synthesized materials. Hence, the mesopore nanopowder of Co3O4–Sb2O3–SnO2 with a higher specific surface area improves the capacitive performance of AC/Co3O4–Sb2O3–SnO2 electrode by increasing the accessible sites for the ion adsorption, leading to a higher specific capacity. The CV results in Fig. 8(a) also show that carbon black in the composite structure can improve electronic conductivity, decreasing charge transfer resistance. This result is consistent with the result of charge transfer resistance in the EIS plot (see Fig. 8(g)), resulting in a higher current density in the voltammograms of AC/CB composites (Fig. 8(a)). As shown in Fig. 8(b), the decline of the specific capacity as a function of the scan rate is attributed to the insufficient time of EDL formation and the emergence of the pseudo-capacitive behavior of the electrodes. Besides, the AC/Co3O4–Sb2O3–SnO2 electrode shows the highest specific capacity in the scan rates between 10 and 100 mV s−1 (see Fig. 8(b)).
Fig. 8(c) demonstrates the capacity retention of the electrodes. The AC/Co3O4–Sb2O3–SnO2 electrode displays the highest capacity retention of 47.5% at the scan rate of 100 mV s−1, indicating the higher rate capability and faster charge storage process of the electrode. The higher rate capability of the AC/Co3O4–Sb2O3–SnO2 electrode originates from the more pseudo-capacitive reaction in the surface of the electrode because of the more accessible sites or available surface area of the Co3O4–Sb2O3–SnO2 nanopowder.
In order to represent the effect of SnO2 as a promising cycling stability agent, the specific capacity of the electrodes was carried out at a high scan rate of 100 mV s−1 for 2000 cycles. As shown in Fig. 8(d), the specific capacity of AC, AC/CB electrodes are reserved 86.9 and 90.7% of its initial specific capacities after 2000 cycles, respectively. After adding Co3O4 for AC/Co3O4 electrode, the capacity retention decreases to 76.3% due to the poor cycling stability of Co3O4. On the other hand, the AC/Co3O4–Sb2O3–SnO2 electrode is maintained 97.2% of initial specific capacity, indicating the excellent stability of the AC/Co3O4–Sb2O3–SnO2 electrode, which originates from the high cycling stability of the SnO2 nanopowder.35
Fig. 8(e) shows the typical charge–discharge curves of the electrodes at a potential sweep window from −0.3 to 0.7 V (vs. Ag/AgCl) at a current density of 0.2 A g−1. In line with the CV results, the AC/Co3O4, AC/Co3O4–Sb2O3–SnO2 electrodes represent a much longer discharge time than AC and AC/CB electrodes, indicating the higher specific capacity of AC/Co3O4 and AC/Co3O4–Sb2O3–SnO2 electrodes. It can be found that the GCD profile is non-linear for AC/Co3O4 and AC/Co3O4–Sb2O3–SnO2 electrodes, suggesting the pseudocapacitive nature of charge storage for these electrodes. The specific capacities of the electrodes derived from the discharge curves at current densities of 0.2, 0.4, 0.6, 0.8, 1, and 2 A g−1 (see Fig. 8(f)). The specific capacities calculated by discharge time are 33.8, 67.4, 115.7, and 141.2 F g−1 for AC, AC/CB, AC/Co3O4, and AC/Co3O4–Sb2O3–SnO2 electrodes, at the current density of 0.2 A g−1. The results reveal that the AC/Co3O4–Sb2O3–SnO2 electrode exhibits a much higher specific capacity than other electrodes at all current densities.
The EIS analysis was used to examine further the electrochemical capacitive and kinetics of the synthesized electrodes. The Nyquist plots of the electrodes at frequencies from 0.01 Hz to 10 kHz are presented in Fig. 5(e). It is known that the Nyquist plots are divided into three sections: (1) the high-frequency intercept on the real Z′ axis indicates the bulk electrolyte resistance (Rs). Namely, such resistance includes the ionic resistance of electrolyte (2), the diameter of the small semicircle displayed at high-frequency region demonstrates the charge transfer resistance (Rct) at the interface of the electrode and electrolyte, and (3) the linear zone at the low-frequency region is attributed to the diffusion impedance resulting from the mass transfer resistance in the system.48 Simultaneously, the EIS data were fitted to an equivalent electric circuit (EEC), and the fitting procedure demonstrates good compliance between theoretical and experimental data by using Rs, Rct, and a constant phase element (CPE – Qdl and exponent n). The EIS data simulation results are presented in Table 3. It can be observed that after adding CB to the AC electrode, the Rct decreases from 156.4 to 9.7 Ω since CB enhances the electrical conductivity of the electrode. By adding the Sb2O3 as an electrical conductivity promoter, the AC/Co3O4–Sb2O3–SnO2 electrode shows an excellent electrical conductivity with Rct of 2.6 Ω.
| Samples | Rs (Ω) | Rct (Ω) | Qdl (μF sn−1) | N |
|---|---|---|---|---|
| AC | 4.2 | 156.4 | 187 | 0.62 |
| AC/CB | 3.7 | 9.7 | 212 | 0.54 |
| AC/Co3O4 | 3.5 | 11.3 | 456 | 0.79 |
| AC/Co3O4–Sb2O3–SnO2 | 2.9 | 2.6 | 635 | 0.93 |
In addition, in the low-frequency region, the slope of the curve corresponding to the AC/Co3O4–Sb2O3–SnO2 electrode is significantly greater than the other electrodes (as shown in Fig. 8(g)). The AC/Co3O4–Sb2O3–SnO2 electrode shows the highest Qdl and n values of 635 μF sn−1 and 0.93, respectively, indicating a lower diffusion resistance and an ideal electrical double layer capacitance, suggesting faster ion diffusion and confirming the improvement of capacity for AC/Co3O4–Sb2O3–SnO2 electrode.58 The lowest Rs of 2.9 Ω assigned to the AC/Co3O4–Sb2O3–SnO2 electrode points out the respective active material's superior conductivity and the minimum contact resistance with the current collector. In light of the discussed results, it can be stated that the AC/Co3O4–Sb2O3–SnO2 electrode facilitates the charge transfer with the reduced contact resistance due to the homogeneous structure of the electrode with high ion accessible sites.
In order to analyze the proportion of the capacitive and (K1v) diffusion (K2v0.5) control charge storage processes, following equation, have been used:59
| i(V) = K1v + K2v0.5 | (7) |
3.3. Desalination performance in CDI system
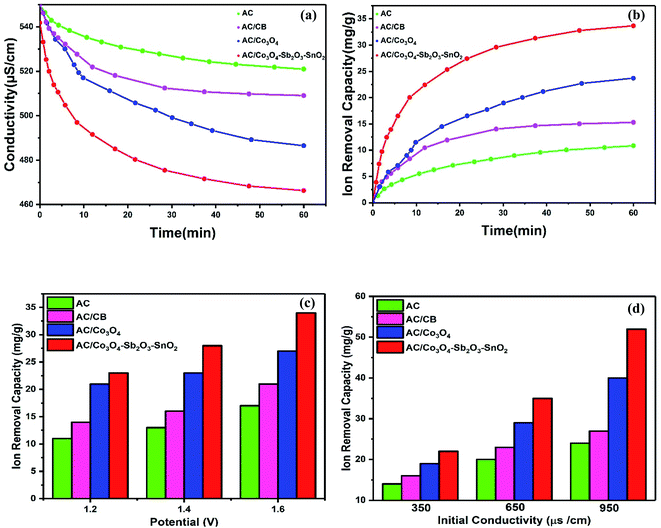
The desalination performances of the synthesized electrodes were studied in a batch mode experiment while applying a cell voltage of 1.6 V. Potable water (160 mL) was pumped into the reactor in a mixing mode for about 60 min where the conductivity of the solution was recorded versus time. The experiments were performed for potable water with initial electrical conductivity of 550 μs cm−1. Fig. 9(a) illustrates the change in the solution conductivity of the various electrode materials. When a cell voltage of 1.6 V is applied on the CDI electrodes, the conductivity of AC and AC/CB decreases, and a drastic drop in the solution conductivity of AC/Co3O4 and AC/Co3O4–Sb2O3–SnO2 can be observed, indicating the adsorption of salt ions from the aqueous solution which subsequently forms the EDL. The desalination is conducted until reaching ion-storage saturation. The final conductivity of the solution for AC, AC/CB, AC/Co3O4, and AC/Co3O4–Sb2O3–SnO2 electrodes are determined about 521, 509, 486, and 458 μs cm−1. The AC and AC/CB electrodes show a typical desalination behavior during deionization. In contrast, the AC/Co3O4 and AC/Co3O4–Sb2O3–SnO2 electrodes result in a superior desalination performance, indicating high ion accessible sites attributed to the high respective available surface area (see Fig. 6).Fig. 9(b) demonstrates the variation of ion removal capacity as a function of time. The AC, AC/CB, and AC/Co3O4 electrodes demonstrate the ion removal capacity of 10, 14, and 24 mg g−1, whereas AC/Co3O4–Sb2O3–SnO2 electrode reveals the maximum ion removal capacity of 34 mg g−1, under the same operating condition. It is clear that adding Co3O4, Sb2O3, and SnO2 to the electrode material improves the ion removal capacity where the AC/Co3O4–Sb2O3–SnO2 electrode displays a superior desalination rate as compared to the other electrode materials. The excellent adsorption efficiency of the AC/Co3O4–Sb2O3–SnO2 electrode can be related to (i) incorporation of Co3O4–Sb2O3–SnO2 to AC leads to the porous structure and a lower degree of agglomeration in AC/Co3O4–Sb2O3–SnO2 electrode which increases the specific surface area and provides ions diffusion easily through intra-channel pathway on the electrode surface, (ii) a promising tuning of the porous structure of the latter active material and (iii) higher specific capacitance and lower charge transfer resistance of AC/Co3O4–Sb2O3–SnO2 electrode which were inferred from the EIS test. To investigate the effect of voltage on the IRC of the CDI system, deionization experiments were conducted at different voltages, as shown in Fig. 9(c). Applying the cell voltages of 1.2, 1.4, and 1.6 V result in the IRC of 21, 23, and 27 mg g−1, respectively, for the AC/Co3O4 electrode, while the IRC was measured by 23, 25, and 34 mg g−1 for AC/Co3O4–Sb2O3–SnO2 electrode, respectively. Such increases result from greater electrosorption capacity and reaction rate resulting from strong electrostatic forces at higher voltages.6,7
The effect of the initial conductivity of potable water on the IRC was also investigated in the CDI system for the electrode materials of AC/Co3O4 and AC/Co3O4–Sb2O3–SnO2, as shown in Fig. 9(d). The IRC of the AC/Co3O4 at 1.6 V is determined by 19, 29, and 40 mg g−1 for the potable water with the conductivity of 350, 650, and 950 μs cm−1, respectively. The IRC of the AC/Co3O4–Sb2O3–SnO2 electrode was measured by 22, 35, and 52 mg g−1, respectively, under the same condition. As the initial conductivity of potable water increases, forming a compressed electrical double layer enhances the diffusion of ions inside the pores, consequently reducing the ion insertion resistance and providing good accessibility for the ions.60,61
Representing the variation of effluent pH is a promising method to investigate the presence of electrode reactions in CDI cells. A considerable pH variation can be observed when oxidization, reduction, or water splitting reactions occur at the surface of the electrodes.62 For example, reducing dissolved oxygen in water can increase the pH in the electrolyte. Besides, the high applied voltage can conduct carbon redox reactions where the carbon oxidation can diminish the stability of the electrode.63 Fig. 10 shows the changes in the effluent pH during the desalination process at the highest voltage of 1.6 V with initial conductivity of 950 μs cm−1. However, it can clearly be seen that there is no significant pH variation for all electrodes at the voltage of 1.6 V, but according to the literature, the pH variation is inevitable during the CDI process. Therefore, slightly acidic pH can be observed in the first 20 min of the desalination process for all the synthesized electrodes, which can be related to the acidic functional groups of the AC or different transport and adsorption/desorption rate of H+ and OH− during a CDI cycle.64 Thus, concerning small pH changes that occurred during desalination, it can be inferred that there is no oxygen reduction and carbon oxidation reaction. In our experiment, the optimum voltage was 1.6 V, but no oxygen bubbles were observed during the experiment, and the weight loss of the electrodes was negligible. Although the high cell voltage typically leads to water splitting on the electrode,65 the electrode potential is more important than the potential difference between cathode and anode, so that the applied potential of the electrode considerably drops depending on series resistance of CDI cell components, including current collectors, electrode material, polymeric binder and wires, and this potential does not inevitably can direct the faradaic reaction.66
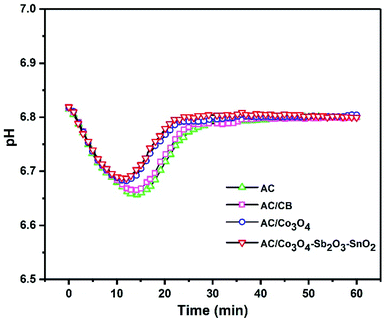 | ||
| Fig. 10 Effluent pH as a function of time at a cell voltage of 1.6 V with initial conductivity 950 μs cm−1. | ||
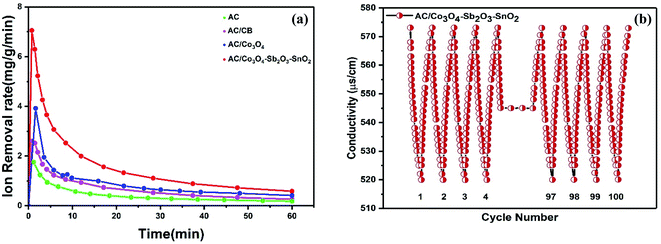
The ion removal rate is the ion removal capacity of the electrodes per operation time (mg g−1 min−1). As shown in Fig. 11(a), the maximum ion removal rate of the AC, AC/CB, AC/Co3O4, and AC/Co3O4–Sb2O3–SnO2 electrodes at the applied voltage of 1.6 V are 1.8, 2.3, 3.9, and 7.1 mg g−1 min−1, respectively. It can be seen that the CDI system with AC/Co3O4–Sb2O3–SnO2 electrode shows a superior ion removal rate compared to the other electrode materials. This result displays the faster ion insertion of the AC/Co3O4–Sb2O3–SnO2 electrode, which originates from higher ion-accessible sites and specific surface areas. This was already concluded from the BET results. As demonstrated in Fig. 11(b), to explore the desalination–regeneration ability of AC/Co3O4–Sb2O3–SnO2 electrode, an electrosorption–desorption experiment has been performed between 1.6 V and 0 V for 100 cycles for the potable water of 573 μs cm−1. A potential difference of 1.6 V was applied for 60 min in the charging step, while a potential of 0 V was applied for 60 min in the discharging step. It can be seen that the conductivity of the solution decreases from 573 to 520 μs cm−1 during the desalination and returns to its initial value during the regeneration step. Besides, by adding SnO2 as a good cycling stability agent, the electrode retains about 99.5% of its ion removal capacity even after 100 cycles. This result shows that the hybrid electrode of AC/Co3O4–Sb2O3–SnO2 can be completely regenerated and reused for ten cycles and reveals excellent desalination–regeneration capability.
Furthermore, the AC/Co3O4 and AC/Co3O4–Sb2O3–SnO2 electrodes revealed a considerable ion removal capacity compared to the several reported carbon/metal oxide-based CDI and HECDI systems (Table 4). The much more IRC enhancement in the present work than the other reports by fabricating carbon/metal oxide electrodes with a low percent of metal oxide should also appreciate the quite cost-effective developed active material. The IRC of 52 mg g−1 (for AC/Co3O4–Sb2O3–SnO2 electrode) in this work is about 3.9 and 2.1 times greater than the average (13.22 mg g−1) and highest (24.2 mg g−1) values of the selected eight reported carbon/metal oxide-based materials.
| Active material | Initial concentration or initial conductivity | V | Ion removal capacity (mg g−1) | Ref. |
|---|---|---|---|---|
| Graphene aerogel (GA)–TiO2 | 6000 mg L−1 | 1.2 | 24.2 | 24 |
| Graphene–Co3O4 | 250 mg L−1 | 1.6 | 18.63 | 6 |
| AC–TiO2 | 584.4 mg L−1 | 1.2 | 17 | 22 |
| ZrO2–AC | 104 mg L−1 | 1.2 | 16.35 | 27 |
| Graphene–Fe3O4 | 300 μs cm−1 | 1.6 | 10.30 | 25 |
| AC–MnO2 | 584 mg L−1 | 1.0 | 9.3 | 26 |
| ACC–ZnO | 100 mg L−1 | 1.2 | 8.5 | 21 |
| Graphene–SnO2 | N.A. | 1.4 | 1.49 | 28 |
| AC/Co3O4 | 950 μs cm−1 | 1.6 | 40 | Present work |
| AC/Co3O4–Sb2O3–SnO2 | 950 μs cm−1 | 1.6 | 52 | Present work |
4. Conclusion
Brackish water desalination via capacitive deionization is an energy-efficient desalination method. Therefore, the preparation of suitable, cost-effective electrodes is an important consideration which can boost the efficiency of CDI systems. In this study, AC/Co3O4 and AC/Co3O4–Sb2O3–SnO2 were successfully prepared and examined as the new carbon–metal oxide electrode materials for the HECDI system. The AC/Co3O4 and AC/Co3O4–Sb2O3–SnO2 electrodes in the HECDI system demonstrated higher ion removal capacity of 40 and 52 mg g−1, respectively, compared to the other carbon–metal oxide-based materials for treating 950 μs cm−1 potable water at the applied potential of 1.6 V. The highest ion removal rate was found to be 7.1 mg g−1 min−1 for the of AC/Co3O4–Sb2O3–SnO2 electrode. The presence of SnO2 in the active material illustrated a good effect on cycling stability, and the AC/Co3O4–Sb2O3–SnO2 electrode preserved 99.5% of its initial ion removal capacity after 100 cycles, demonstrating excellent electrochemical stability and desalination/regeneration capability. Moreover, the small amount of Sb2O3 (0.24% in active material) as a conductivity promoter could exclude the negative effect of the polymeric binder on the electrical conductivity of the active material. The main advantages of the AC/Co3O4–Sb2O3–SnO2 electrode for the CDI technology were found to rely on the high ion removal capacity, high ion removal rate, high desalination–regeneration stability, and excellent electrical conductivity, which are counted as the essential parameters to use the CDI technology in a larger scale.Author contributions
Ehsan Delfani: data curation, formal analysis, investigation, methodology, validation, writing – original draft. Alireza Khodabakhshi: data curation, formal analysis, investigation, methodology, validation. Sajjad Habibzadeh: conceptualization, funding acquisition, writing – review & editing, project administration, resources, supervision. Leila Naji: writing – review & editing. Mohammad Reza Ganjali: conceptualization.Conflicts of interest
There are no conflicts to declare.References
- S. Y. Pan, A. Z. Haddad, A. Kumar and S. W. Wang, Water Res., 2020, 183, 116064 CrossRef CAS.
- M. Zong, Y. Zhang, K. Li, C. Lv, P. Tian, Y. Zhao and B. Liang, Electrochim. Acta, 2020, 329, 135089 CrossRef CAS.
- R. Broséus, J. Cigana, B. Barbeau, C. Daines-Martinez and H. Suty, Desalination, 2009, 249(1), 217–223 CrossRef.
- M. A. Anderson, A. L. Cudero and J. Palma, Electrochim. Acta, 2010, 55(12), 3845–3856 CrossRef CAS.
- Q. Jiang, Y. Han, W. Tang, H. Zhu, C. Gao, S. Chen and Z. L. Wang, Nano Energy, 2015, 15, 266–274 CrossRef CAS.
- G. Divyapriya, K. K. Vijayakumar and I. Nambi, Desalination, 2019, 451, 102–110 CrossRef CAS.
- A. Hassanvand, PhD thesis, Universuty of Melbourne, 2018.
- K. Tang, Y. H. Kim, J. Chang, R. T. Mayes, J. Gabitto, S. Yiacoumi and C. Tsouris, Chem. Eng. J., 2019, 357, 103–111 CrossRef CAS.
- M. R. Vengatesan, I. F. F. Darawsheh, B. Govindan, E. Alhseinat and F. Banat, Electrochim. Acta, 2019, 297, 1052–1062 CrossRef CAS.
- S. Kim, J. Lee, C. Kim and J. Yoon, Electrochim. Acta, 2016, 203, 265–271 CrossRef CAS.
- J. Oladunni, J. H. Zain, A. Hai, F. Banat, G. Bharath and E. Alhseinat, Sep. Purif. Technol., 2018, 207, 291–320 CrossRef CAS.
- W. Tang, J. Liang, D. He, J. Gong, L. Tang, Z. Liu and G. Zeng, Water Res., 2019, 150, 225–251 CrossRef CAS.
- J. Ma, L. Wang and F. Yu, Electrochim. Acta, 2018, 263, 40–46 CrossRef CAS.
- B. Senthilkumar, D. Meyrick, Y. S. Lee and R. K. Selvan, RSC Adv., 2013, 3(37), 16542–16548 RSC.
- S. Porada, R. Zhao, A. Van Der Wal, V. Presser and P. M. Biesheuvel, Prog. Mater. Sci., 2013, 58(8), 1388–1442 CrossRef CAS.
- M. E. Suss, S. Porada, X. Sun, P. M. Biesheuvel, J. Yoon and V. Presser, Energy Environ. Sci., 2015, 8(8), 2296–2319 RSC.
- J. Lee, S. Kim, C. Kim and J. Yoon, Energy Environ. Sci., 2014, 7(11), 3683–3689 RSC.
- O. Barbieri, M. Hahn, A. Herzog and R. Kötz, Carbon, 2005, 43(6), 1303–1310 CrossRef CAS.
- F. Zhou, T. Gao, M. Luo and H. Li, Sep. Purif. Technol., 2018, 191, 322–327 CrossRef CAS.
- C. Zhang, D. He, J. Ma, W. Tang and T. D. Waite, Water Res., 2018, 128, 314–330 CrossRef CAS.
- M. T. Z. Myint, S. H. Al-Harthi and J. Dutta, Desalination, 2014, 344, 236–242 CrossRef CAS.
- C. Kim, J. Lee, S. Kim and J. Yoon, Desalination, 2014, 342, 70–74 CrossRef CAS.
- A. G. El-Deen, J.-H. Choi, C. S. Kim, K. A. Khalil, A. A. Almajid and N. A. M. Barakat, Desalination, 2015, 361, 53–64 CrossRef CAS.
- H. Yin, S. Zhao, J. Wan, H. Tang, L. Chang, L. He and Z. Tang, Adv. Mater., 2018, 201325(43), 6270–6276 CrossRef PubMed.
- X. Gu, M. Hu, Z. Du, J. Huang and C. Wang, Electrochim. Acta, 2015, 182, 183–191 CrossRef CAS.
- Y.-H. Liu, H.-C. Hsi, K.-C. Li and C.-H. Hou, ACS Sustainable Chem. Eng., 2016, 4(9), 4762–4770 CrossRef CAS.
- A. S. Yasin, M. Obaid, I. M. A. Mohamed, A. Yousef and N. A. M. Barakat, RSC Adv., 2017, 7(8), 4616–4626 RSC.
- A. G. El-Deen, N. A. M. Barakat, K. A. Khalil, M. Motlak and H. Y. Kim, Ceram. Int., 2014, 40(9), 14627–14634 CrossRef CAS.
- D. Cai, D. Wang, C. Wang, B. Liu, L. Wang, Y. Liu and T. Wang, Electrochim. Acta, 2015, 151, 35–41 CrossRef CAS.
- Y. Gao, S. Chen, D. Cao, G. Wang and J. Yin, J. Power Sources, 2010, 195(6), 1757–1760 CrossRef CAS.
- J. Wang, X. Zhang, Q. Wei, H. Lv, Y. Tian, Z. Tong and L. Mai, Nano Energy, 2016, 19, 222–233 CrossRef CAS.
- M. Kandasamy, S. Sahoo, S. K. Nayak, B. Chakraborty and C. S. Rout, J. Mater. Chem. A, 2021, 9(33), 17643–17700 RSC.
- S. Sahoo, K. Krishnamoorthy, P. Pazhamalai, V. K. Mariappan and S. J. Kim, Inorg. Chem. Front., 2019, 6(7), 1775–1784 RSC.
- Z. Cao, Z. Yang, C. Zhang, L. Xie, X. Zhao, P. Pan and J. Zhao, J. Mater. Sci.: Mater. Electron., 2020, 31(3), 2406–2415 CrossRef CAS.
- S. Wang, S. Wang, G. Wang, X. Che, D. Li, C. Li and J. Qiu, Mater. Today Commun., 2020, 23, 100904 CrossRef CAS.
- D. Xie, S. Chen, Z. Zhang, J. Ren, L. Yao, L. Wu and X. Xu, J. Power Sources, 2018, 389, 140–147 CrossRef CAS.
- S. Habibzadeh, A. Kazemi-Beydokhti, A. A. Khodadadi, Y. Mortazavi, S. Omanovic and M. Shariat-Niassar, Chem. Eng. J., 2010, 156(2), 471–478 CrossRef CAS.
- S. Habibzadeh, A. A. Khodadadi and Y. Mortazavi, Sens. Actuators, B, 2010, 144(1), 131–138 CrossRef CAS.
- H. Fathi, S. M. Masoudpanah, S. Alamolhoda and H. Parnianfar, Ceram. Int., 2017, 43(10), 7448–7453 CrossRef CAS.
- S. K. Meher and G. R. Rao, J. Phys. Chem. C, 2011, 115(31), 15646–15654 CrossRef CAS.
- P. Simon, Y. Gogotsi and B. Dunn, Science, 2014, 343(6176), 1210–1211 CrossRef CAS.
- V. Augustyn, P. Simon and B. Dunn, Energy Environ. Sci., 2014, 7(5), 1597–1614 RSC.
- J. Lang, X. Yan and Q. Xue, J. Power Sources, 2011, 196(18), 7841–7846 CrossRef CAS.
- J. Xie, H. Cao, H. Jiang, Y. Chen, W. Shi, H. Zheng and Y. Huang, Anal. Chim. Acta, 2013, 796, 92–100 CrossRef CAS PubMed.
- H. Younes, F. Ravaux, N. El Hadri and L. Zou, Electrochim. Acta, 2019, 306, 1–8 CrossRef CAS.
- H. Chen, C. Xue, Z. Hai, D. Cui, M. Liu, Y. Li and W. Zhang, J. Alloys Compd., 2020, 819, 152939 CrossRef CAS.
- B. Babu, A. N. Kadam, R. Ravikumar and C. Byon, J. Alloys Compd., 2017, 703, 330–336 CrossRef CAS.
- Y. Qi and J. Zhang, Composites, Part B, 2019, 162, 112–121 CrossRef CAS.
- H. Wang, Y. Fu, X. Wang, J. Gao, Y. Zhang and Q. Zhao, J. Alloys Compd., 2015, 639, 352–358 CrossRef CAS.
- A. N. Naveen and S. Selladurai, RSC Adv., 2015, 5(80), 65139–65152 RSC.
- J. Yan, T. Wei, W. Qiao, B. Shao, Q. Zhao, L. Zhang and Z. Fan, Electrochim. Acta, 2010, 55(23), 6973–6978 CrossRef CAS.
- W. Tong, Y. Wang, Y. Bian, A. Wang, N. Han and Y. Chen, Nanoscale Res. Lett., 2020, 15(1), 1–12 CrossRef PubMed.
- S. Zhu, X. Yang, T. Li, F. Li and W. Cao, J. Alloys Compd., 2017, 721, 149–156 CrossRef CAS.
- Y. Chen, Y. Zhang and S. Fu, Mater. Lett., 2007, 61(3), 701–705 CrossRef CAS.
- X. Yang, Y. Wang, H. Xiong and Y. Xia, Electrochim. Acta, 2007, 53(2), 752–757 CrossRef CAS.
- R. K. Sharma, H.-S. Oh, Y.-G. Shul and H. Kim, Phys. B, 2008, 403(10–11), 1763–1769 CrossRef CAS.
- X. He, M. Yang, P. Ni, Y. Li and Z.-H. Liu, Colloids Surf., A, 2010, 363(1–3), 64–70 CrossRef CAS.
- F. Manteghi, S. H. Kazemi, M. Peyvandipour and A. Asghari, RSC Adv., 2015, 5(93), 76458–76463 RSC.
- Z. Tong, S. Liu, Y. Zhou, J. Zhao, Y. Wu, Y. Wang and Y. Li, Energy Storage Mater., 2018, 13, 223–232 CrossRef.
- Q. Jiang, Y. Han, W. Tang, H. Zhu, C. Gao, S. Chen and Z. L. Wang, Nano Energy, 2015, 15, 266–274 CrossRef CAS.
- M. R. Vengatesan, I. F. Fahmi Darawsheh, B. Govindan, E. Alhseinat and F. Banat, Electrochim. Acta, 2019, 297, 1052–1062 CrossRef CAS.
- R. Fateminia, S. Rowshanzamir and F. Mehri, Sep. Purif. Technol., 2021, 274, 119108 CrossRef CAS.
- Y. Bouhadana, E. Avraham, M. Noked, M. Ben-Tzion, A. Soffer and D. Aurbach, J. Phys. Chem. C, 2011, 115(33), 16567–16573 CrossRef CAS.
- Y. M. Volfkovich, Russ. J. Electrochem., 2020, 56(1), 18–51 CrossRef CAS.
- J. Lee and J. Choi, J. Membr. Sci., 2012, 409–410, 251–256 CrossRef CAS.
- Y. Ha, H. Lee, H. Yoon, D. Shin, W. Ahn, N. Cho and Y. Cho, Sep. Purif. Technol., 2021, 254, 117500 CrossRef CAS.
| This journal is © The Royal Society of Chemistry 2022 |

