
 Open Access Article
 This Open Access Article is licensed under a Creative Commons Attribution-Non Commercial 3.0 Unported Licence
Optimization and characterization of biosurfactant produced by indigenous Brevibacillus borstelensis isolated from a low permeability reservoir for application in MEOR†
Hao Dong a,
Anying Zhengb,
Yanlong Hec,
Xiaotong Wangde,
Yang Lib,
Gaoming Yub,
Yongan Gub,
I. M. Banatf,
Shanshan Sunb,
Yuehui She*b and
Fan Zhang*g
a,
Anying Zhengb,
Yanlong Hec,
Xiaotong Wangde,
Yang Lib,
Gaoming Yub,
Yongan Gub,
I. M. Banatf,
Shanshan Sunb,
Yuehui She*b and
Fan Zhang*g
aCollege of Chemistry and Environmental Engineering, Yangtze University, Jingzhou 434023, China
bCollege of Petroleum Engineering, Yangtze University, Wuhan, Hubei 430010, China. E-mail: sheyuehui@163.com
cCollege of Petroleum Engineering, Xi'an Shiyou University, Xi'an 710065, China
dState Key Laboratory of Microbial Resources, CAS Key Laboratory of Microbial Physiological and Metabolic Engineering, Institute of Microbiology, Chinese Academy of Sciences, Beijing 100101, China
eUniversity of Chinese Academy of Sciences, Beijing 100049, PR China
fFaculty of Life and Health Sciences, School of Biomedical Sciences, University of Ulster, Northern Ireland, UK
gThe Key Laboratory of Marine Reservoir Evolution and Hydrocarbon Accumulation Mechanism, Ministry of Education, College of Energy Resources, China University of Geosciences (Beijing), Beijing 100083, China. E-mail: fanzhang123@126.com
First published on 12th January 2022
Abstract
Biosurfactants are expected to be a key factor for microbial enhanced oil recovery (MEOR). In this study, we described the novel biosurfactant-producing strain Brevibacillus borstelensis YZ-2 isolated from a low permeability oil reservoir. We purified and characterized the biosurfactants produced by this YZ-2 strain via thin-layer chromatography and MALDI-TOF-MS, revealing them to be fengycins. We additionally used a Box–Behnken design approach to optimize fermentation conditions in order to maximize the biosurfactants production. Core flooding experiments showed that biosurfactants produced by YZ-2 can significantly enhance crude oil recovery. Micro-model tests showed that emulsification and IFT reduction was the main EOR mechanism of the YZ biosurfactant in the oil wet model. In summary, these findings highlight the potential of Brevibacillus borstelensis YZ-2 and its metabolites for MEOR.
1 Introduction
Microbial enhanced oil recovery (MEOR) has been a topic of increasing academic and industrial interest owing to the fact that it has the potential to simultaneously be environmentally friendly and cost-effective.1,2 MEOR is a technique wherein microbes and their metabolites are applied to oil reservoirs in a manner that results in improved oil recovery.3–6 Several studies to date have found that biosurfactant-producing microbes play a key role in the MEOR process.7,8 Biosurfactants are able to emulsify crude oil and to reduce the interfacial tension (IFT) between oil and water, thereby leading to increased crude oil fluidity.9Biosurfactant-producing microbes have been isolated from diverse settings including soil, oil reservoirs, seawater and marine sediments. Of these microbes, those originally derived from oil reservoirs have been found to be more readily adapted to use in similar oil reservoir settings.10 Species of Bacillus, Acinetobacter, Rhodococcus, Enterobacter, Dietzia, Paenibacillus and Pseudomonas isolated from oil reservoirs have been found to produce a range of biosurfactants including lipopeptides, glycolipids, phospholipids and fatty acids.11–15 Lipopeptides are generally amphiphilic compounds with excellent surface activity. Lipopeptides have been shown to be produced by species of Bacillus, Brevibacillus, Streptomyces, Arthrobacter and Pseudomonas.16,17 Bacillus species including B.licheniformis, B. subtilis,18 B. cereus,16 and B. amyloliquefaciens19 have all been identified as major lipopeptide producers. As such, many Bacillus species have been studied to date in order to study the potential applications of their metabolites.20,21 However, to date there has not been sufficient study of the properties of oil reservoir-derived Brevibacillus species or of their potential value in MEOR applications.
Biosurfactants are generally produced a mixture of congeners that can be readily extracted in crude forms.22 Purification or refining are usually not required for MEOR applications unlike the case when using in pharmaceuticals and cosmetics industries.23,24 The cost of using biosurfactant in enhancing oil recovery is often mainly the cost of their production. It is essential that fermentation conditions be optimized in order to increase the cost-effectiveness.25 Industrial waste represented a potential source of inexpensive substrate that can be used for biosurfactant production,26 with studies having used residues composed of molasses,27 corn steep liquor,28 glycerol29 and cassava wastewater30 to successfully produce biosurfactant from a variety of microbes.
Factors affecting biosurfactant production from many microbes, and particularly from Bacillus, Pseudomonas and Candida species, has been a topic of intensive research.31,32 Few studies have sought to optimize biosurfactant production by Brevibacillus species. The lipopeptide production of a novel bacterial strain Brevibacillus sp. AVN 13 was optimized by using Box–Behnken design.33,34 The optimum conditions for bioemulsifier and exopolysaccharides production by thermophilic Brevibacillus borstelensis were obtained by different statistical optimization approaches.35 However, studies on the optimization of lipopeptide production by Brevibacillus borstelensis are scarce. Optimizing fermentation conditions can be challenging owing to the complexity of the fermentation environment.36 Response surface method (RSM) is a kind of chemometric method which have been frequently applied to the optimization of analytical methods, fermentation process, soil remediation method et al., because of their advantages such as a reduction in the number of experiments that need be executed resulting in lower reagent consumption and considerably less laboratory work. Box–Behnken design (BBD) is an approach of RSM wherein models are constructed and the simultaneous impact of multiple variables is assessed through a variety of statistical approaches in an effort to optimize appropriate experimental conditions. BBD approaches explore the relationships between several explanatory variables and one or more response variables, and such approaches have been used as an effective means of increasing biosurfactant production by optimizing culture conditions and media components in an efficient manner.37
At present, there are few reports focused on Brevibacillus borstelensis isolated from oil reservoirs based on MEOR. Bioemulsifier produced by Brevibacillus borstelensis were reported.35 However, studies on biosurfactant produced by Brevibacillus borstelensis were scarce. In the present study, we report the isolation and characterization of a novel biosurfactant producing B. borstelensis strain isolated from the CQ Oilfield in China. To reveal the characterization of biosurfactant produced by Brevibacillus borstelensis and its application in MEOR, column chromatography, gel chromatography and HPLC were used to separate and purify the biosurfactants produced by YZ-2. Composition of biosurfactants produced by YZ-2 was characterized via MALDI-TOF-MS/MS. We further utilize Box–Behnken design (BBD) in order to maximize biosurfactant production efficiency. The potential of YZ-2 for reducing interfacial tension was examined. Core flooding and micro-model tests were also conducted to further investigate the ability of microorganism toward MEOR process.
2 Materials and methods
2.1 Microbe isolation and identification
Oil and formation water were collected from oil wells of the CQ Oilfield in China which was located in Northwest China. Individual 2 mL samples were then combined with 50 mL mineral enrichment medium (MEM; 7 g L−1 NH4NO3, 1 g L−1 K2HPO4, 1 g L−1 KH2PO4, 0.3 g L−1 MgSO4, 0.01 g L−1 Na2MoO4, and 0.01 g L−1 FeSO4; pH of 7.0–7.2), amended with 0.2 g sucrose and 2 mL crude oil collected from the same well. Samples were incubated at 35 °C for 72 hours with constant shaking at 150 rpm.Next, 50 μL culture supernatant samples were isolated and spread onto lysogeny broth (LB) agar plates, which were then incubated at 35 °C for 24 hours. The surface tension of the culture was determined using a surface tensiometer JK99B (Zhongchen Electronic Technology Co., Ltd., China). Those strains capable of decreasing surface tension were then selected and grown for 3 days at 35 °C in MEM supplemented with sucrose, with constant 150 rpm shaking. The strain YZ-2 was chosen for further study as high yielding strain which reduced the surface tension of the culture up to 30.11 ± 0.3 mN m−1 and produced biosurfactant with high emulsification activity of E24 = 72% ± 0.4%.
Bergey's Manual of Systemic Bacteriology was referenced when assessing the YZ-2 stain in order to understand its morphology, physiology and phylogeny. In addition, the identification of the strain YZ-2 was followed the method described in previous reports.38
2.2 Preparation of biosurfactant extracts produced by YZ-2
A 5% (v/v) inoculum of the YZ-2 strain in LB (optical density, OD600 = 1) was added to the fermentation medium (1 L: 20 g corn steep powder, 0.5 g yeast extract, 20 g NaNO3, 0.35 g KH2PO4, 1.0 g Na2HPO4, 0.25 g MgSO4·7H2O, 0.0075 g CaCl2, 0.006 g, MnSO4·H2O, pH 7.0), followed by incubation at 35 °C for 96 h with constant shaking at 200 rpm. The broth was then centrifuged for 8 minutes at 10![[thin space (1/6-em)]](https://www.rsc.org/images/entities/char_2009.gif) 000 rpm, and the cell-free supernatant was collected. Next, 5 mol L−1 HCl was used to adjust the supernatant pH to 2.0, and the mixture was then stored for 10 h at 4 °C to precipitate the lipopeptides, after which solid crude lipopeptides were collected via spinning for 10 minutes at 10000 rpm at 4 °C. Crude lipopeptides was extracted with 30 mL methanol. The insoluble impurities were removed through filtration. A rotary evaporator was then used for methanol evaporation, yielding a crude biosurfactants extract.39
000 rpm, and the cell-free supernatant was collected. Next, 5 mol L−1 HCl was used to adjust the supernatant pH to 2.0, and the mixture was then stored for 10 h at 4 °C to precipitate the lipopeptides, after which solid crude lipopeptides were collected via spinning for 10 minutes at 10000 rpm at 4 °C. Crude lipopeptides was extracted with 30 mL methanol. The insoluble impurities were removed through filtration. A rotary evaporator was then used for methanol evaporation, yielding a crude biosurfactants extract.39
2.3 YZ-2 biosurfactant purification and structural analysis
YZ-2 biosurfactant were dissolved using CHCl3 and loaded onto a silica gel column (100–200 meshes). Chloroform/methanol solvent (5/0, 4/1, 3/2, 1/4, 0/5; v/v) systems were used to wash the column in sequence to achieve biosurfactant recovery.40 The eluate being collected in 10 mL fractions. Each fraction was dried by rotary evaporation and dissolve in equal volume of deionized water. The Emulsification Index (E24) of each fraction was measured as described previously.41 The solution of each fraction was added with kerosene in a 1:1 ratio (v/v). The mixture solution was vortexed well and kept in an ambient condition for 24 h. After incubation, the emulsifying index (E24) of each fraction was calculated by the following formula: 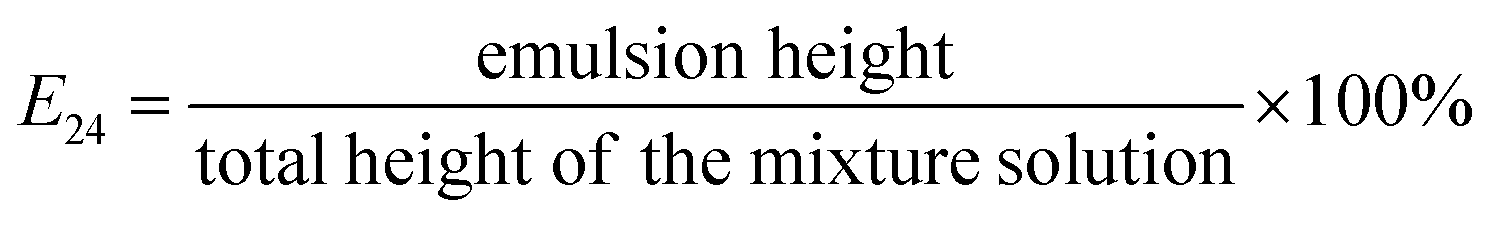 . The eluted fractions for which E24 was >50% were then combined and evaporated in a rotary at 50 °C in a vacuum to yield purified lipopeptides. These lipopeptides were then dissolved with methanol prior to loading onto a Daisogel-packed column for HPLC (SP-120-40/60-ODS-RPS, DAISO CO., Ltd, Japan). This column was washed with methanol/H2O solvent systems (5/0, 4/1, 3/2, 1/4, 0/5; v/v) in sequence to mediate biosurfactant recovery, with the eluate again being collected in 10 mL fractions and those fractions for which E24 was >50% being pooled to yield further purified lipopeptides. Finally, 0.8% NaCl was used to dissolve these lipopeptides which were then loaded onto a Sephadex LH-20 column, with eluates again being pooled as above to yield a final preparation of purified lipopeptides.
2.4 Biosurfactant evaluation
Distilled water was used to prepare a range of concentrations of the purified lipopeptide (0–100 mg L−1). Changes in the surface tension in these samples were assessed, with the critical micelle concentration (CMC) being determined accordingly. In addition, the E24 for these biosurfactants was determined as in previous reports.41The pendant drop apparatus was used for measuring the IFT followed by the method described in previous reports.42 The apparatus was designed in a way that it is possible to analyze the IFT by using an online image capturing system which enables us to record the data upon our desire periodically. In general, the analysis of IFT measurement is performed by injecting a drop from the needle with 2.05 mm diameter into a bulk phase under 30 °C. The IFT between oil and different concentration of purified biosurfactant were measured.
The contact angle and interfacial tension were measured to investigate the ability of YZ-2 biosurfactant to alter the wettability of the rock surface. Interfacial tension between different concentration of biosurfactant solution and petroleum used in the micromodel test were measured at room temperature by using an interfacial tensiometer (KRUSS DSA30, Germany). A clean microscope glass slide was washed by chromic acid pickling solution and distilled water successively and was dried under 60 °C. After that, the microscope glass slide was aged in dewatered oil at 60 °C for about three weeks. The microscope glass slide was washed by toluene lightly to remove free oil on the glass surface. One of the glass slides was steeped in biosurfactant solution for one hour to allow the interaction between biosurfactant and glass surface. The contact angle of water and biosurfactant solution on the glass surface were measured by sessile drop method via a contact angle goniometer (KRUSS DSA30, Germany).
2.5 Reverse-phase HPLC
CH3OH was used to dissolve purified lipoproteins, which were then subjected to 0.22 μm filtration. A 25 μL volume of biosurfactant solution was then injected into an InterSustain C18 column (5 μm, 250 mm × 4.6 mm) in an HPLC system (Agilent 1260, USA) in order to separate out the lipopeptides within the crude preparation. The mobile phases were methanol (A) and water (B) containing 0.1% trifluoroacetic acid (TFA). Ultraviolet detector was used to detect lipopeptides in the eluent. The gradient strategy for this mobile phase system was as described in previous reports.432.6 MALDI-TOF-MS
A SCIEX 4800 Plus analyzer (Applied Biosystems, USA) with a 337 nm nitrogen laser for desorption and ionization was used for the assessment of HPLC-purified lipopeptides structures as previously described.432.7 Optimization of biosurfactant production
A Box–Behnken design (BBD) approach was used to optimize the variables involved in the biosurfactant production. Based on previous studies, three input parameters were considered in the development of this optimized model: the concentrations of corn steep powder, MgSO4, and peptone in the fermentation broth.The codes ranged for each of these three parameters were listed in Table 1. Three concentrations were tested for each of these three parameters, with these concentrations having been selected based upon preliminary experimental results. All other components of the fermentation medium were identical to that described in Section 2.2. Cultures were incubated for 96 h at 35 °C with constant shaking at 200 rpm. In total, 15 experimental groups were tested (Table 2), with biosurfactant yield being measured based on the weight of the crude biosurfactant preparations that were prepared as in Section 2.2.
| Variables | Range and levels | ||
|---|---|---|---|
| −1 | 0 | 1 | |
| Corn steep liquor A (g L−1) | 20 | 35 | 50 |
| MgSO4 (B) (g L−1) | 0.2 | 0.35 | 0.5 |
| Peptone (C) (g L−1) | 1.2 | 1.8 | 2.4 |
| Run | Corn steep liquor (A) | MgSO4 (B) | Peptone (C) | Observed biosurfactant yield (g L−1) | Predicted biosurfactant yield (g L−1) |
|---|---|---|---|---|---|
| 1 | 0 | 1 | 1 | 2.51 | 2.44 |
| 2 | 1 | 0 | 1 | 3.09 | 3.08 |
| 3 | −1 | −1 | 0 | 3.32 | 3.24 |
| 4 | 0 | −1 | −1 | 2.70 | 2.77 |
| 5 | 1 | 1 | 0 | 3.27 | 3.35 |
| 6 | 0 | 0 | 0 | 3.88 | 3.92 |
| 7 | −1 | 1 | 0 | 2.31 | 2.28 |
| 8 | 0 | −1 | 1 | 3.36 | 3.33 |
| 9 | 0 | 0 | 0 | 3.91 | 3.92 |
| 10 | 1 | 0 | −1 | 3.43 | 3.33 |
| 11 | 0 | 0 | 0 | 3.97 | 3.92 |
| 12 | 1 | −1 | 0 | 3.66 | 3.69 |
| 13 | 0 | 1 | −1 | 2.33 | 2.35 |
| 14 | −1 | 0 | −1 | 1.98 | 1.99 |
| 15 | −1 | 0 | 1 | 2.79 | 2.89 |
The optimized values from BBD were determined by analyzing the results of this experiment. Analyses of variance (ANOVA) with 95% confidence intervals (CIs) were used to gauge the significant of these effects, allowing for the identification of which conditions and interactions were necessary in order to achieve optimal biosurfactant production.44
2.8 Core flooding
The physical simulation experiments were performed to simulate the reservoir environment and to assess the ability of biosurfactants produced by YZ-2 to enhance oil recovery. Standard core flooding equipment was used as previously described.45 Core flooding equipment included a constant flow pump (Szweico 2PB, China), core holder, high pressure vessels, oven and confining pressure pump. The schematic of the experimental setup for the physical simulation experiment was shown in Fig. 1. The properties of oil and formation water were shown in Tables S2 and S3.†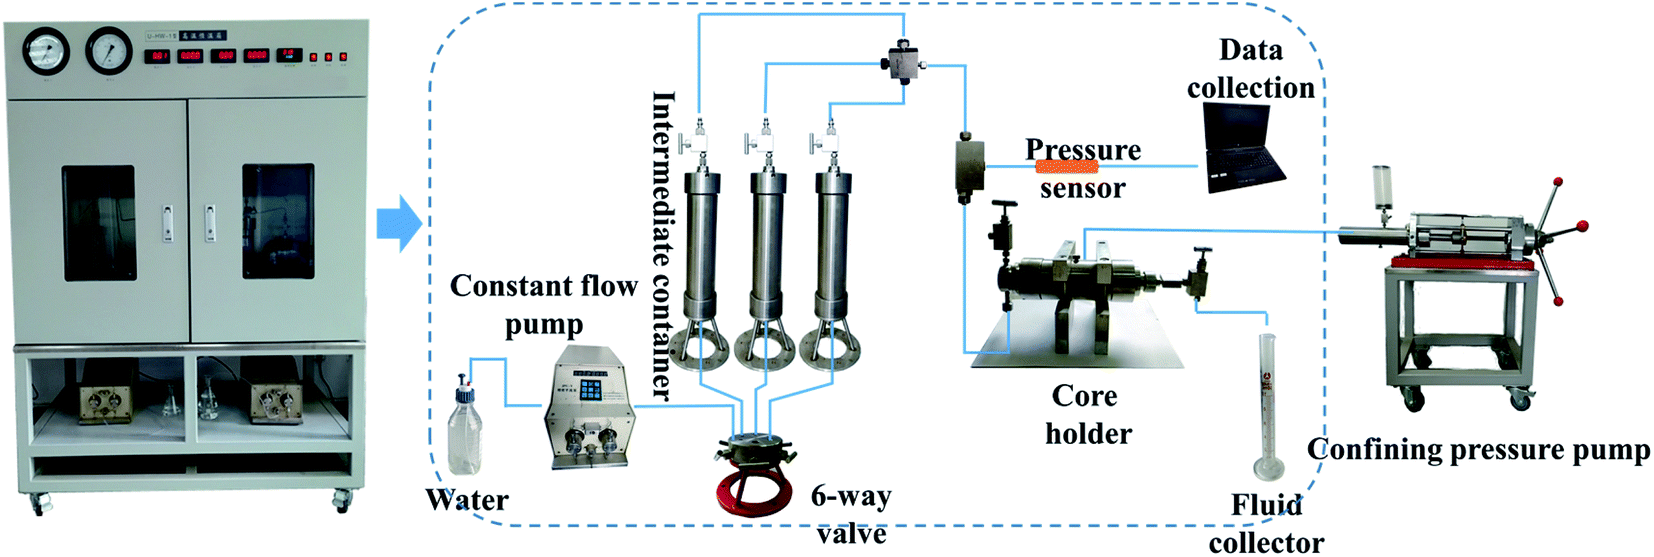 | ||
| Fig. 1 Schematic of the core displacement experiment set up. | ||
The core samples used in the experiments were collected from Chang 6 reservoir of the CQ Oilfield in China. Cores were 7 cm long and 2.5 cm in diameter, with permeability values ranging from 42–47 mD (Table S1†). They were cleaned with benzene and alcohol through Soxhlet apparatus and dried at 80 °C for 24 hours. The dry weight was measured. The dry core samples were evacuated for 2 hours and then saturated with formation water. The wet weight was measured. Pore volume (PV) and porosity were calculated based on the weight difference before and after the core was water saturated. The core samples were placed inside the core holder under a confining pressure of 1000 psi, and the initial liquid permeability was determined by flowing the formation water across the cores at a constant flow rate of 0.2 mL min−1. The dewatered and degassed oil were injected into the cores with a flow rate of 0.2 mL min−1 to establish initial oil saturation at 30 °C which was consistent with the reservoir temperature. After the saturation of water and oil, the core holder was kept at 30 °C for 3 days. Subsequently, cores were flooded with formation water until the water cut in the core effluent was >98%. Oil recovery was then calculated based upon the volume of recovered oil.46
After secondary injection, cores D, A, B and E were injected with 1 PV of 60 mg L−1, 90 mg L−1, 120 mg L−1 and 150 mg L−1 biosurfactant solution, respectively. As a control, core C was injected with 1 PV of formation water and incubating for 2 hours. Then, the subsequent water flooding was conducted. The water injection was stopped when water cut reached 98%. The accumulative oil production was recorded. The biosurfactant and subsequent water flooding recovery was calculated as above.12
2.9 Micromodel test
The oil used in this test was the same as in the Section 2.8. The manufacturing process of the micromodels has been described by Dunsmore.47 Briefly, a micromodel consisted of two glass plates, one with an interconnected, acid-etched network being annealed to the other, un-etched plate. The inner radius of the core channels was approximately 50 μm (ESI Fig. S1†). A schematic diagram of the micromodel apparatus was followed by Dong.12 The basic elements of the apparatus are the pumping system and the associated flow lines, the micromodel in its holder, the photography system, and the monitoring computer system. Micromodels were first saturated with crude oil at 60 °C for 3 weeks. Then, formation water was injected into the micromodels to simulate the first water flooding. The flow rate of the flooding water was controlled at 1 μL min−1 with a constant flow pump (LongerPump TS-1B, China). The pump and micromodels were connected with Masterflex 06409-13 tygon tubing (Saint-Gobain, France). The temperature of the flow system and micromodel was maintained at 30 °C via a micro warm plate (Kitazato, Japan). Subsequently, cell free fermentation broth containing biosurfactants was injected into model for 20 min, followed by second water flooding. Photographs were taken during the flooding period every 2 min with an EOS550D digital single lens reflex camera (Canon, Inc., Japan).3 Results and discussion
3.1 Isolation of a biosurfactant-producing microbe
We selected the strain YZ-2 isolated from oil well production water for further study owing to its ability to emulsify oil and to effectively reduce ST. Strain YZ-2 was a motile Gram-positive microbe that grew well in temperatures from 20–60 °C, pH values from 4–11, and salinity values from 0%–20%. We were able to obtain a nearly complete YZ-2 16S rRNA gene sequence (1382 bp), and a phylogenetic analysis (Fig. 2) revealed it to have 99% sequence similarity to that of Brevibacillus borstelensis. Brevibacillus species have been isolated from petroleum reservoirs, petroleum contaminated soil. Phenanthrene-degrading bacterial strain Brevibacillus sp. PDM-3 which was isolated from hydrocarbon contaminated sludge samples has the ability to produce glycolipid-biosurfactant during phenanthrene degradation.48 Brevibacillus brevis HOB1 was isolated from the formation water of an oil field and found to produce lipopeptides and have the ability to enhance oil recovery.49 Brevibacillus originally derived from petroleum reservoir showed potential application in microbial oil recovery. | ||
| Fig. 2 Phylogenetic relationship based on the 16S rDNA gene sequences between strain YZ-2 and species in the Pseudomonas as determined by the neighbor-joining algorithm and evaluated by the maximum-likelihood and maximum parsimony algorithms. | ||
3.2 The production and characterization of biosurfactants produced by Brevibacillus borstelensis YZ-2
After a 72 h fermentation, biosurfactants were extracted from the broth and lyophilized. These purified biosurfactants were able to reduce the ST of water from 72 ± 0.2 mN m−1 to 30.11 ± 0.3 mN m−1 at room temperature when added at a 60 mg L−1 concentration. We further characterized the oil spreading, kerosene emulsification, and variation of surface tension versus concentration for purified biosurfactant (Fig. 3a–c). The CMC value for this biosurfactant preparation was estimated to be ∼60 mg L−1, with a minimum ST value of 30.11 ± 0.3 mN m−1. The purified biosurfactants were able to reduce the water–oil interfacial tension from 18.51 ± 0.1 mN m−1 to 1.32 ± 0.09 mN m−1 at room temperature when added at a 60 mg L−1 concentration. Poulami Datta et al. compared the oil washing efficiencies of lipopeptides, trehalose lipids and rhamnolipids produced by different strains. The CMC, surface tension and interfacial tension were ranged from 20–250 mg L−1, 25–38.4 mN m−1 and 0.32–11.3 mN m−1, respectively. These results showed the excellent interfacial active of biosurfactant produced by YZ-2.50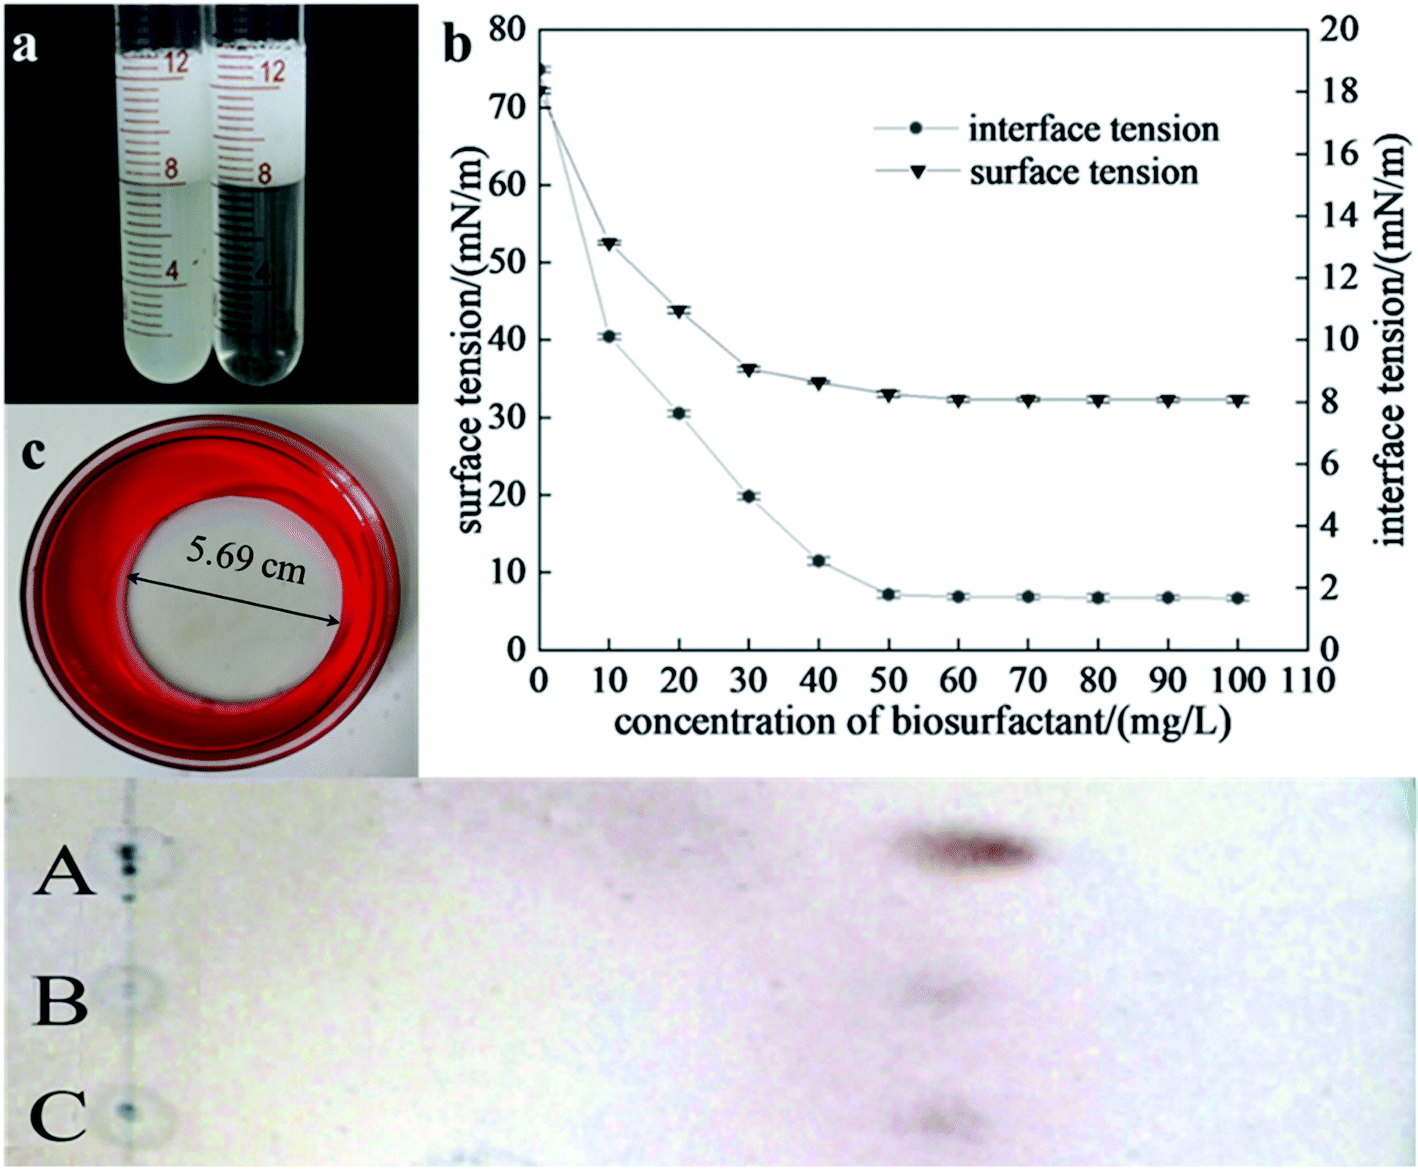 | ||
| Fig. 3 Characteristic of biosurfactant produced by strain YZ-2. (a) Showed the kerosene emulsification caused by biosurfactant produced by strain; (b) showed oil spreading of biosurfactant produced by strain YZ-2. (c) Showed the surface tension and water–oil interfacial tension of different concentration of biosurfactant. | ||
3.3 Structural characterization
We next used reverse-phase HPLC to characterize these purified biosurfactants produced by strain YZ-2, with all active fractions in the resultant chromatogram being analyzed (Fig. 4a). Retention times ranged from 2–6 min, 10–30 min and 32–35 min. The rapidly eluted fraction was ultimately determined to contain homologs with shorter fatty acid chains and pigments.18 These separated HPLC fractions were then assessed for their ability to modulate surface activity via a surface tension meter, with the surface-active fractions that were eluted at 23.12 minute being collected and analyzed via MAIDI-TOF-MS.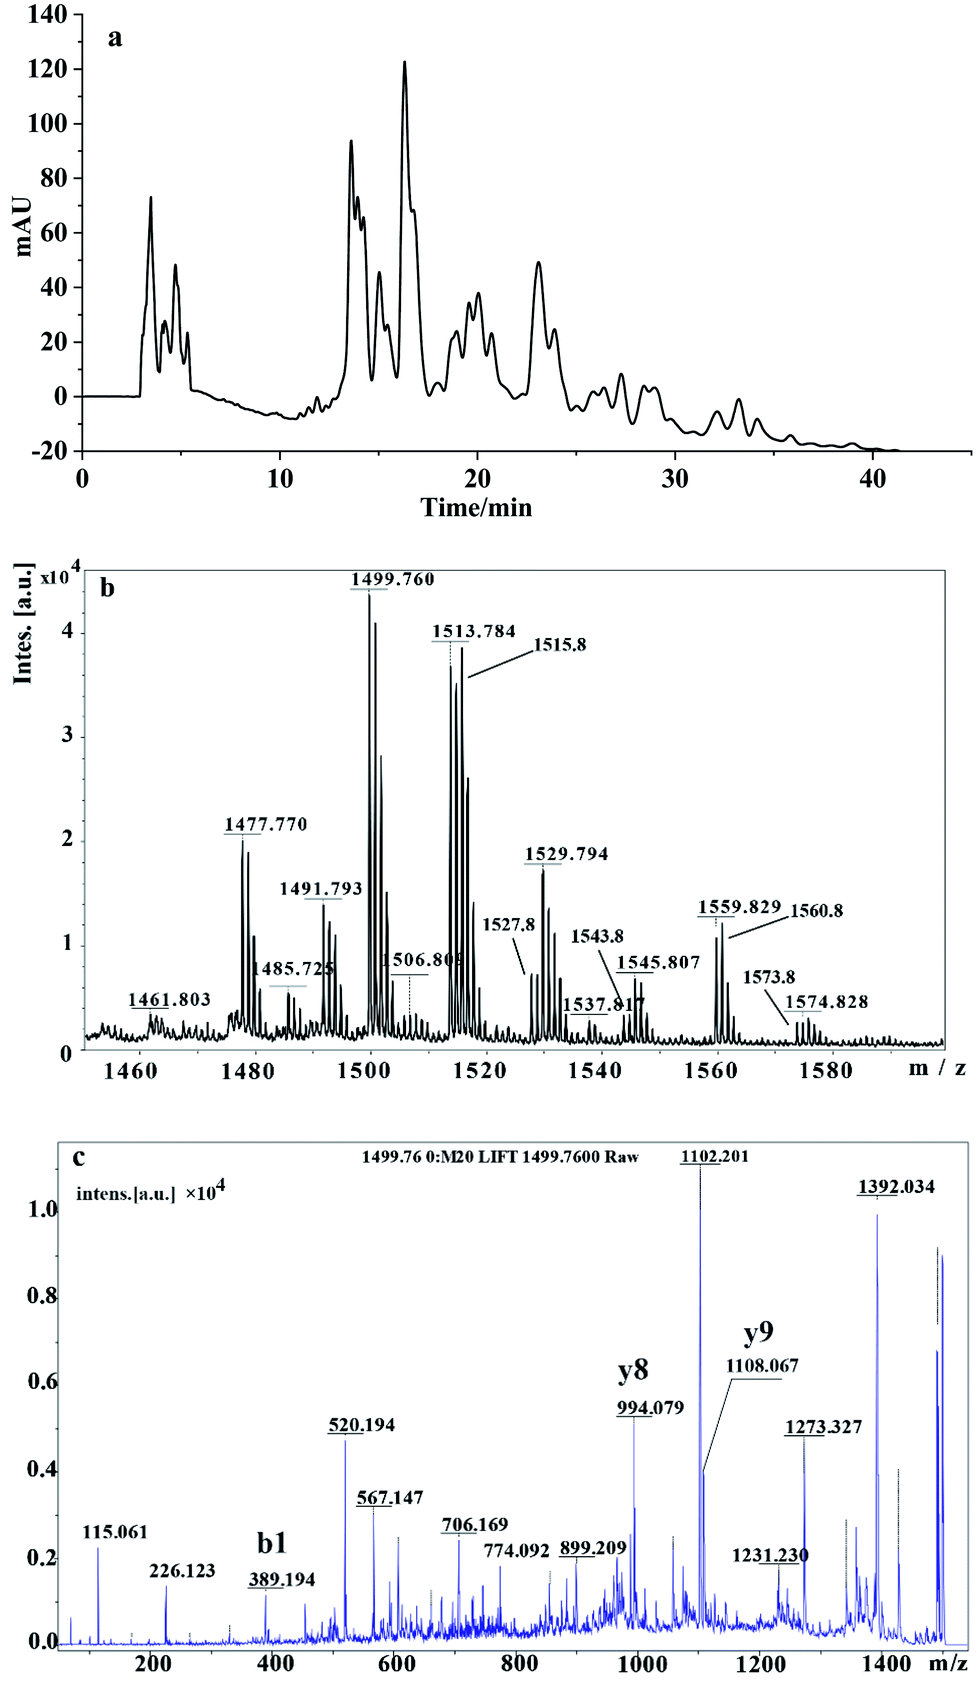 | ||
| Fig. 4 Structural analysis of biosurfactants produced by Brevibacillus borstelensis YZ-2. (a) Showed RP-HPLC chromatograms of purified biosurfactants produced by Brevibacillus borstelensis YZ-2, (b) showed mass spectra of the HPLC fractions eluting at 23.12 min of the biosurfactants produced by YZ-2. (c) Showed MS/MS spectra ions m/z 1499.76. | ||
The MS under positive ions mode revealed that the m/z of the purified lipopeptides were ranged from 1421.8 to 1566.8. The main ions at m/z 1485.72, 1499.76, 1513.78 and 1527.8, there were 14 Da difference between each other. This suggests they were homologues with different number of CH2. Peaks with m/z of 1477.77, 1491.79, 1515.8 and 1529.79 also represent they were homologues with different number of CH2. Molecular ions which yield mass decrease of 2 Da suggest the presence of unsaturated fatty acids, such as peaks with m/z of 1513.78 and 1515.8, 1527.8 and 1529.79. Peaks with m/z of 1477.77, 1499.76, 1515.8, were considered to be protonated ions [M + H]+, sodium adductions [M + Na]+and potassium adductions [M + K]+of a component with a molecular weight of 1476.77, respectively.31 Peaks with m/z of 1491.79, 1513.78 and 1529.79 were considered to be protonated ions, sodium adductions and potassium adductions of a component with a molecular weight of 1490.8, which we believe to be a homolog of the component with a molecular weight of 1476.77. These m/z of the main peaks were the same to the reported fengycins and its homologs.51,52
The fragment ions of purified biosurfactants were analyzed via MALDI-TOF-MS/MS to classify compounds. Two classes of fengycins, fengycin A has DAla at position 6 and fengycin B has DVal at position 6 have been reported so far. Fragment ions produced by the cleavage of Glu1-Orn2 and Orn2-Tyr3 have been used as fingerprint ions to identify fengycins and its homologs (Fig. S1†). Three fingerprint ions y8, y9 and b1 which reported by Pathak (2012) were used here.51 y8 and y9 fingerprint ions are produced by the leaves of “fatty acid chain-Glu” and “fatty acid chain-Glu-Orn” from the N terminus. Fingerprint ions couple y8/y9 were used to identify fengycin homologues. b1 fingerprint ion was used to identify the nature and length of a fatty acid part. Peak with m/z of 1499.76 was considered to be sodium adductions [M + Na]+ of a component with a molecular weight of 1476.77. Fingerprint ion couple (994.07/1108.7) were obtained by the cleavage of molecular ions MH+ at m/z 1499 (Fig. 4c), this pair of ions were obtained from fengycin B as previous report.51,52 This confirmed that the fengycin at m/z 1476 was fengycin B containing a C16 lipid chain. Fengycin were reported as a kind of cyclic lipopeptides which were generated by the member of Bacillus sp., such as Bacillus mojavensis, Bacillus subtilis, Bacillus amyloliquefaciens. It shows strong antifungal activity and can inhibits the growth of variety of plant pathogens.53 However, reports about fengycin produced by microorganisms isolated from petroleum reservoir and its application in petroleum exploitation are scarce. In this research, we isolated a strain Brevibacillus borstelensis YZ-2 which can produce fengycins and show its potential in petroleum exploitation. The fengycin of lipopeptides is a well-known anti-fungal substance. Moreover, it evidences excellent interfacial activity as a lipopeptide biosurfactant. Fengycin A, B and S produced by Bacillus amyloliquefaciens LSC04 were compared with biosurfactant produced by Nocordia sp. L-417 and several commercial surfactants. The results showed that the emulsification activities of the biosurfactants produced by LSC04 were superior to these surfactants except with tween detergents; however, its emulsification stability was far superior to that of the surfactants tested.19,53
3.4 Optimization of biosurfactant production
The interaction of component of the medium on biosurfactants production was shown in Table 3. A two second-order polynomial equation (eqn (1)) was generated by the results shown in Table 3. The relationship between the controllable variables and the responses can be numerically explained by the second-order polynomial equation. This polynomial equation made a correlation between the concentration of corn steep powder, MgSO4 and peptone in the fermentation broth, were designed as A, B and C, respectively, with biosurfactants yield. The concentration of corn steep powder, MgSO4, and peptone were chosen as critical variables for the biosurfactant production to increase the yield of biosurfactant.| Biosurfactant yield = 2.92 + 0.38A − 0.33B + 0.16C + 0.15AB − 0.29AC − 0.12BC − 0.34A2 − 0.44B2 − 0.76C2 | (1) |
| Source | Sum of squares | df | Mean square | F value | P-value | Prob > F |
|---|---|---|---|---|---|---|
| Model | 5.61 | 9 | 0.62 | 61.54 | 0.0001 | Significant |
| A-corn steep liquor | 1.16 | 1 | 1.16 | 114.73 | 0.0001 | |
| B-MgSO4 | 0.86 | 1 | 0.84 | 84.66 | 0.0003 | |
| C-peptone | 0.21 | 1 | 0.21 | 21.17 | 0.0059 | |
| AB | 0.096 | 1 | 0.096 | 9.48 | 0.0275 | |
| AC | 0.33 | 1 | 0.33 | 32.62 | 0.0023 | |
| BC | 0.057 | 1 | 0.057 | 5.68 | 0.0629 | |
| A2 | 0.43 | 1 | 0.43 | 42.42 | 0.0013 | |
| B2 | 0.71 | 1 | 0.71 | 70.13 | 0.0004 | |
| C2 | 2.11 | 1 | 2.11 | 208.36 | <0.0001 | |
| Residual | 0.051 | 5 | 0.010 | |||
| Lack of fit | 0.047 | 3 | 0.016 | 7.38 | 0.1217 | Not significant |
| Pure error | 4.2 × 10⁻³ | 2 | 2.100 × 10⁻³ | |||
| Cor total | 5.66 | 14 | ||||
| Std. Dev. | 0.10 | R-squared | 0.99 | |||
| Mean | 3.10 | Adj R-squared | 0.97 | |||
| C.V.% | 3.26 | Pred R-squared | 0.87 | |||
| Press | 0.76 | Adeq precision | 23.48 |
The statistical significance and fitness of this polynomial equations was analyzed through ANOVA (Table 3). The results of Fisher's F-test for the quadratic model were significant (P < 0.05). This study also had a strong correlation coefficient (R2) of 0.9911, consistent with a strong correlation between observed experimental values and model predicted values. We can perform a mathematical analysis of the quadratic model as showed in eqn (1). The most significant factors influence on the biosurfactant production was A, corresponding to the corn steep powder concentration, with a regression coefficient βA = 0.38, followed by concentration of MgSO4, with a regression coefficient βB = −0.33. Peptone concentration had smaller influence on biosurfactant yield than corn steep powder and MgSO4. This was reflected in the regression coefficient of peptone concentration in eqn (1). The quadratic terms of corn steep powder, MgSO4 and peptone were adjusted to a curve line with the different values of the slope. C2 is in the first position of the polynomial equation with a value βCC = −0.76, followed by βCC = −0.44 and βAA = −0.34. According to the coefficients of the interaction terms, the influence of corn steep powder concentration on biosurfactant yield depends greatly on the concentration of peptone and to a lesser extent on MgSO4 concentration; the terms AB and AC appear in sixth and seventh place of the polynomial equation, respectively, with regression coefficients βAB = −0.29 and βAC = 0.15. Based on the polynomial equation, the numerical optimization of this model was conducted using the goal parameter “in range” and a response goal of “maximize”, yielding predicted optimal parameter values of 42.09 g L−1 corn steep powder, 0.31 g L−1 MgSO4, and 1.82 g L−1 peptone. This combination yielded 3.78 ± 0.22 g L−1 of biosurfactant, which was similar to the predicted yield of 4.06 g L−1.
We additionally generated 3D response surface plots highlighting the mutual interactions between these three parameters and their influence on biosurfactant yields (Fig. 5A–C). Each plot indicates the interaction between two parameters and the associated impact on biosurfactant yield when the third parameter is fixed. Elliptical contour plots indicated mutual interactions between these parameters, whereas circular plots correspond negligible or interactions. The plots in Fig. 5A–C correspond to the effect of interactions between corn steep powder and MgSO4, corn steep powder and peptone, MgSO4 and peptone effects on biosurfactant yields, with fixed peptone, MgSO4, and corn steep powder concentrations of 1.80 g L−1, 0.35 g L−1 and 30 g L−1, respectively. Fig. 5 clearly demonstrated that biosurfactant yields increased as concentrations of corn steep powder, MgSO4 and peptone rose to middling levels, before falling when these values rose above a particular level. As the contour plots in Fig. 5A and B are elliptical, this indicated that there were significant interactions between factors A, B and between factors B, C. Modifying just one of these factors is not a reliable means of predicting biosurfactant properties. The contour plot in Fig. 5C indicates that there is a weak interaction between factors B and C, thus suggesting that varying either of these factors can be used as a means of predicting the properties of the resultant biosurfactant solution. The cost of raw materials is the major cost in most of biotechnological processes,54 especially in MEOR process. Industrial by-product, such as molasses, corn steep liquor and waste cooking oil were used to enhance the yield of biosurfactant and reduce the cost of biosurfactant production.27,28 In this study, the improvement of biosurfactant production by 29.5 ± 0.6% suggested the Box–Behnken design in this work is successful. Corn steep liquor is the most influential factor according to our results. This suggested corn steep liquor as a suitable low-cost substrate for the production of biosurfactant. It is clear that the use of corn steep liquor as sole raw material is expected to reduce the overall production cost of biosurfactant.
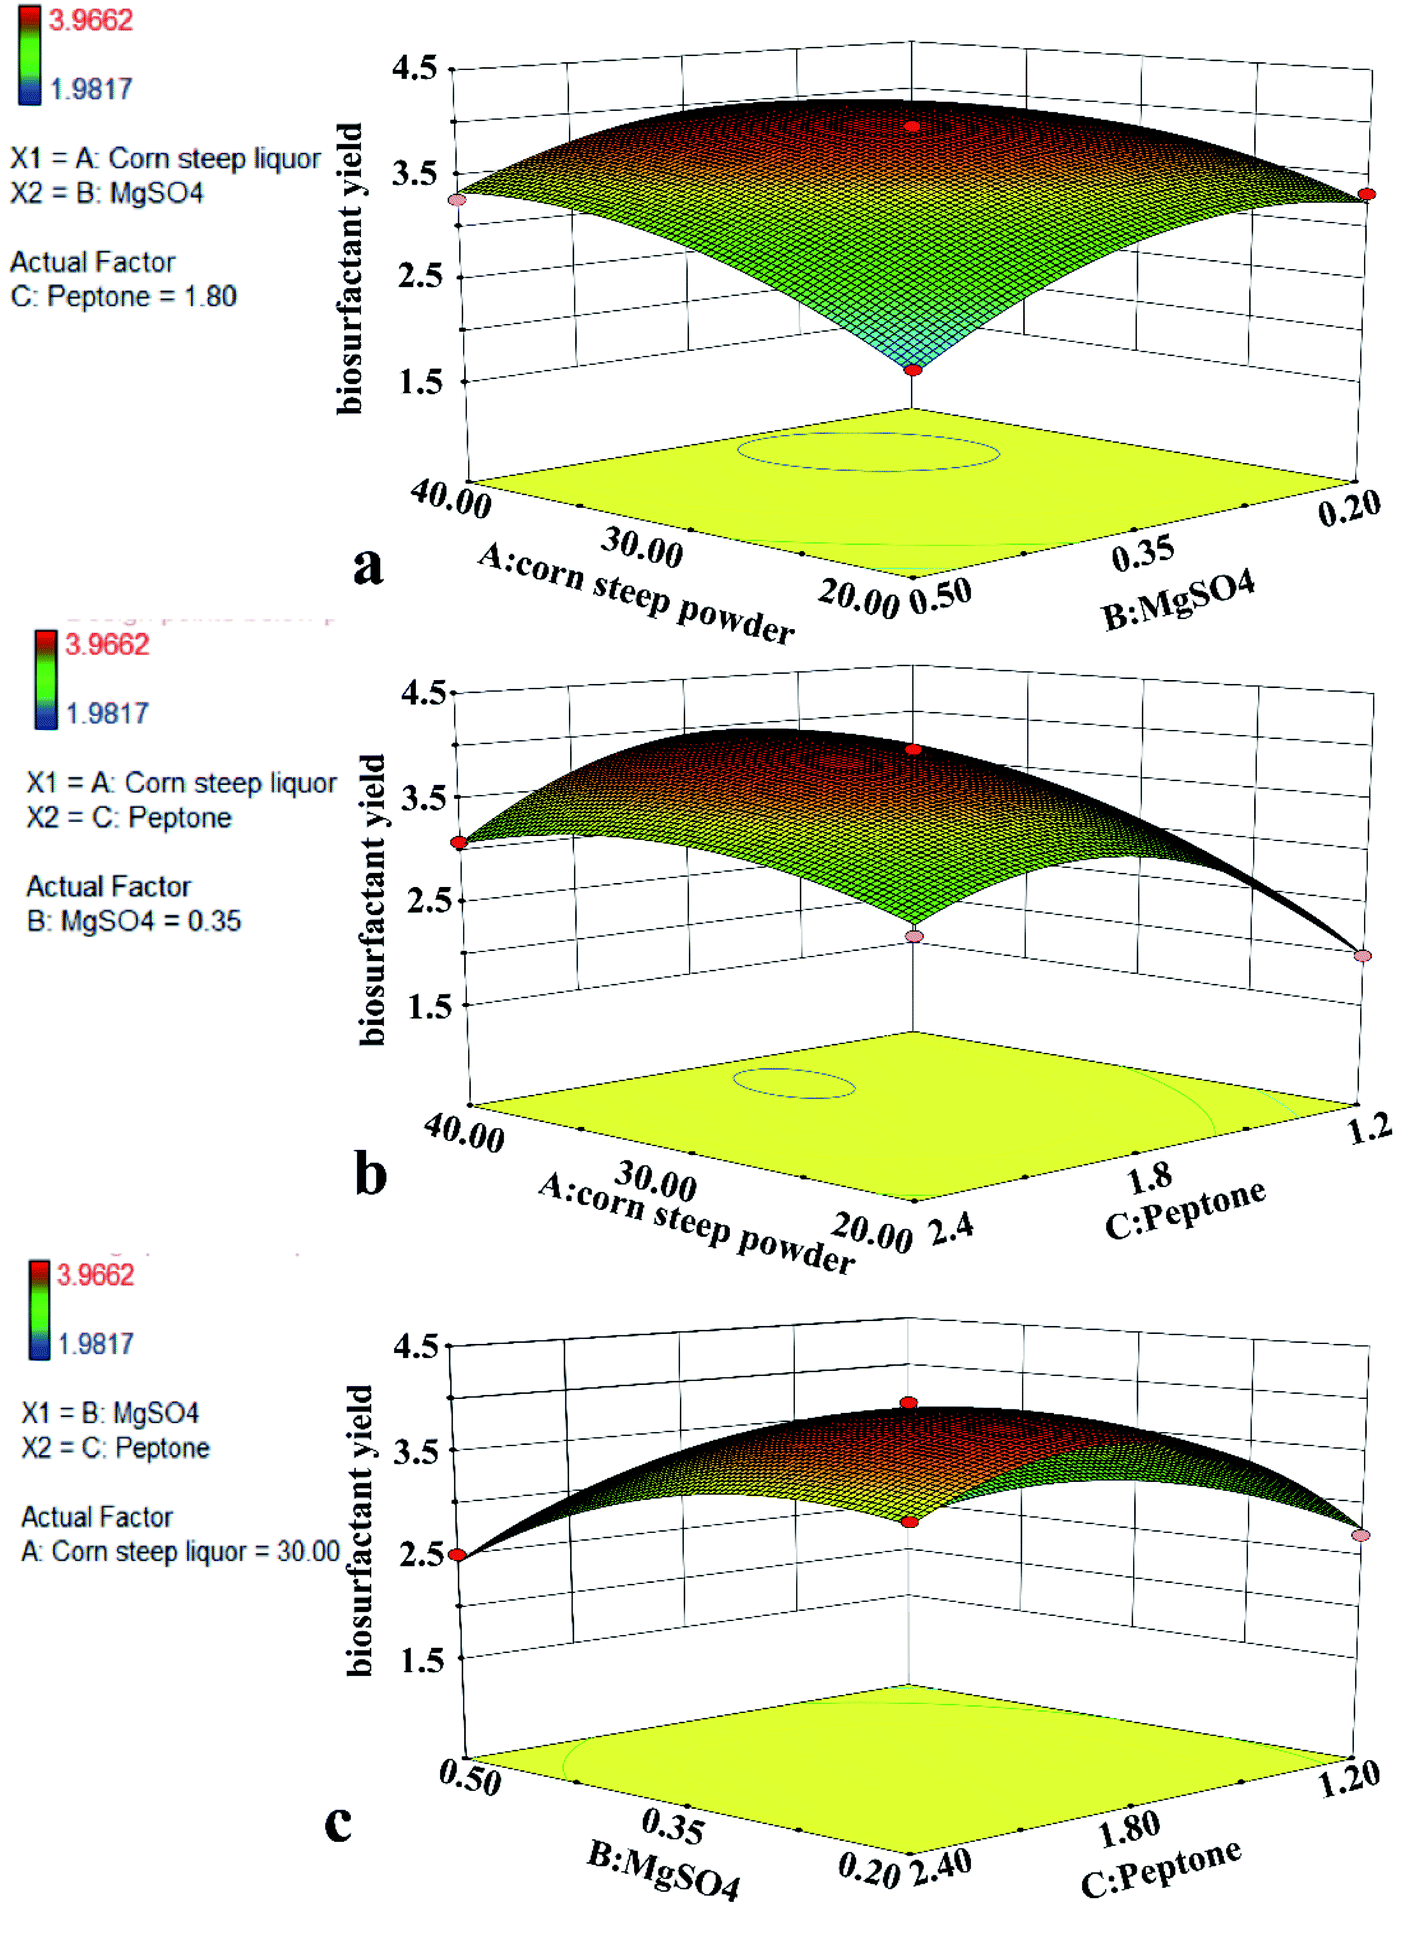 | ||
| Fig. 5 Response surface plots and contour plots for maximum biosurfactant yield generated using data in Table 3. Inputs, 15 experimental runs carried out under conditions established by BBD; production of biosurfactant as function of (a) corn steep powder and MgSO4; (b) corn steep powder and peptone; (c) MgSO4 and peptone. | ||
3.5 Core flooding test
In order to simulate the MEOR process, we conducted a core flooding test that incorporated five test groups in order to examine the ability of YZ-2-derived biosurfactants to enhance oil recovery (Fig. 6). In core C, which was a control core, secondary injection mediated 32.6% original oil in place (OOIP) recovery owing to its volumetric sweep efficiency, with a tertiary injection recovering an additional 2.7% of OOIP. In core A, B, D and E, 33.6%, 33.8%, 32.6% and 34.2% OOIP recovery was achieved upon secondary injection, respectively. Then 1 PV of different concentration (60 mg L−1, 90 mg L−1, 120 mg L−1, 150 mg L−1) of biosurfactant solution were injected into core A, B, D and E, respectively; additional 3.4%, 6.4%, 11.7% and 11.8% of OOIP was recovered upon the tertiary injection. The results showed that the biosurfactant were able to enhance the oil recovery after water flooding. Biosurfactant produced by YZ-2 can reduce oil–water interfacial tension from 18.51 ± 0.1 mN m−1 to 1.32 ± 0.09 mN m−1. IFT reduction was consider to be important mechanism in biosurfactant enhanced oil recovery.55,56 When the biosurfactant solution contact the trapped crude oil in the porous medium, it obviously reduces the oil–water IFT and mobilizes the trapped crude oil by reducing capillary tension. The reduction of oil–water IFT caused by different concentration (60 mg L−1, 90 mg L−1, 120 mg L−1 and 150 mg L−1) of YZ-2 biosurfactant was similar. However, higher oil recovery was obtained by injecting higher concentration of biosurfactant solution. The loss of surfactant during the surfactant flooding was reported.57 Core flooding test showed that higher concentration of biosurfactant than CMC was needed to achieve more oil displacement.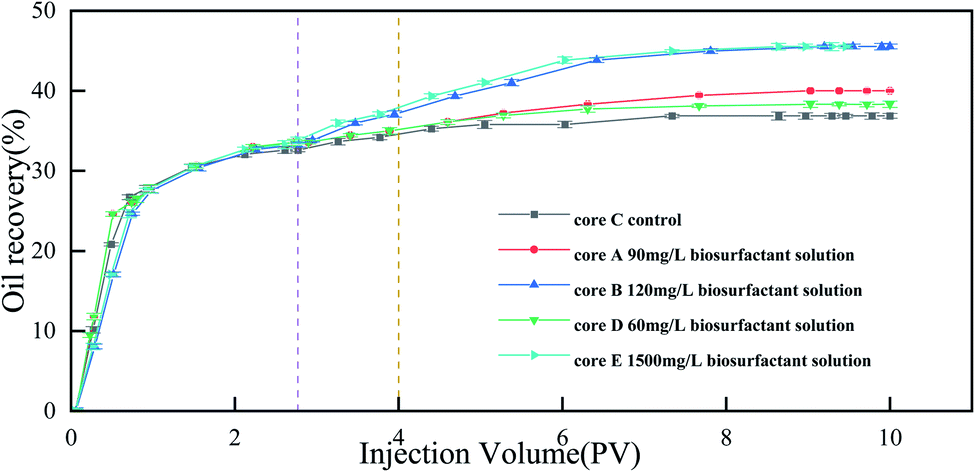 | ||
| Fig. 6 Change of oil recovery versus injected PV in core model. | ||
3.6 Micromodel experiments
The micromodel test showed that the residual oil in the model after water flooding mainly exists in the following forms: (1) columnar residual oil (Fig. 7a); (2) flaky residual oil (Fig. 7c); (3) film residual oil (Fig. 7e). A large amount of film residual oil indicated that the active component in the petroleum was closely adsorbed on the pore wall. This showed that the pore wall had become oil wet in the previous oil aging process. It showed that oil–water interfacial tension was reduced from 18.51 ± 0.1 mN m−1 to 1.32 ± 0.09 mN m−1 by the biosurfactant solution (60 mg L−1). The contact angle of water on the oil aged glass slides surface was 97.7 ± 0.3° while contact angle of biosurfactant solution (60 mg L−1) was 10.4 ± 0.2° (Fig. S2†). The reservoir pores were supposed to be capillaries, the radius of which is equal to the pore radius 50 μm. Capillary force is the main resistance during water flooding. The capillary force can be calculated by eqn (2).
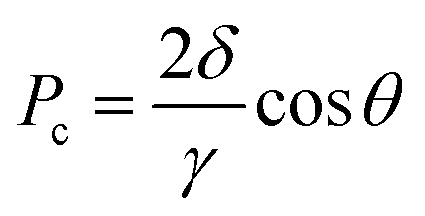 | (2) |
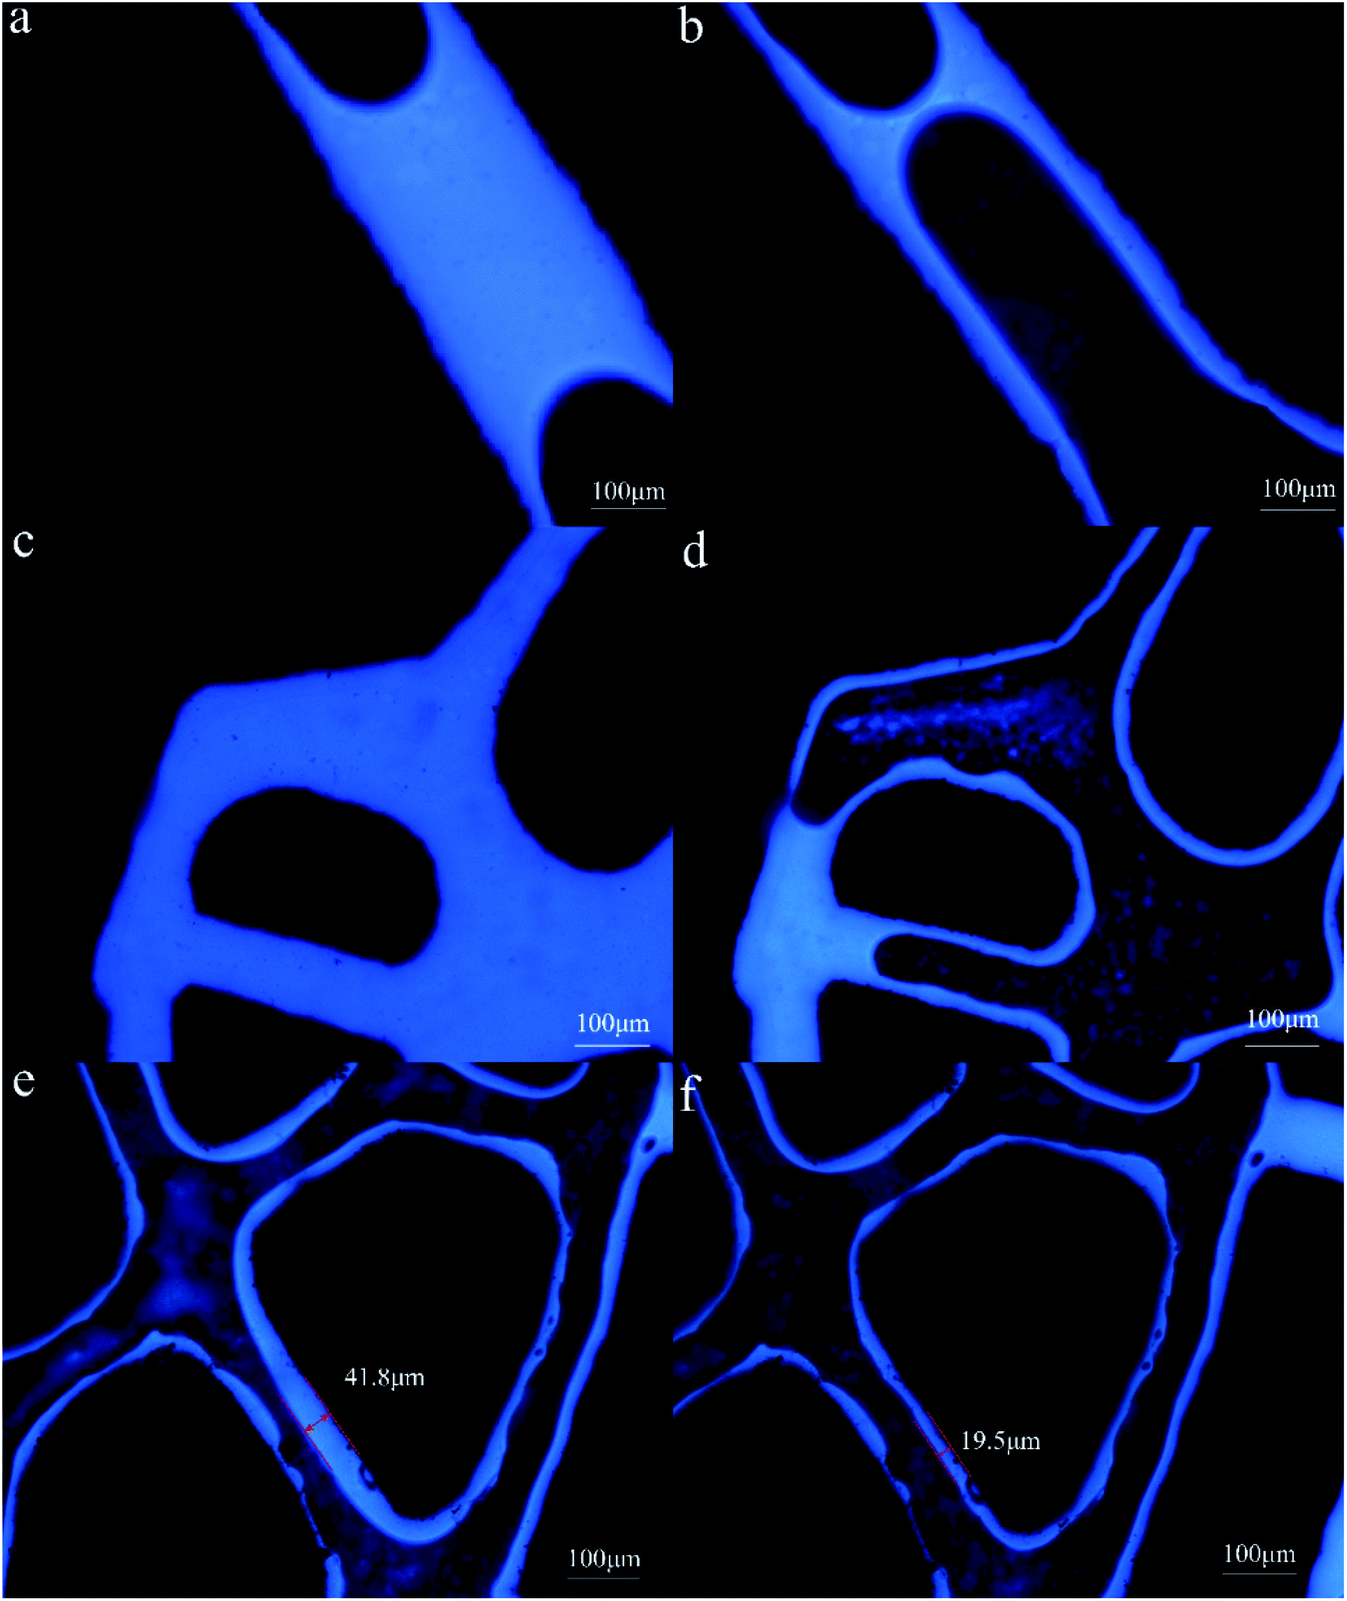 | ||
| Fig. 7 Fluid distribution after water flooding and biosurfactant flooding. Blue: oil, black: solid, colorless transparent (black in pore): water phase. | ||
According to eqn (2), the capillary force of water in the pores was −9.9 × 10⁴ mN m−2. The negative sign of capillary force indicated that the direction of capillary force was opposite to water flooding. Capillary force was the resistance of water flooding. During the biosurfactant flooding process, the capillary force of biosurfactant solution in the pores was 5.2 × 10⁴ mN m−2. The direction of capillary force was consistent with that of biosurfactant flooding. Capillary force was the driving force of oil displacement. The change of capillary force made it easier for surfactant solution to enter the capillary with smaller radius and improve sweep coefficient. Columnar residual oil in the pore was difficult to drive out because the capillary resistance was formed at the oil column (Fig. 7a). The subsequent process of displacing the residual oil of the oil column with surfactant was showed in Fig. 7b. On one hand, YZ-2 biosurfactant changed the capillary force from oil displacement resistance to oil displacement power. On the other hand, crude oil was stripped from large oil column, emulsified into small particles and dispersed in the displacement fluid. In this process, the length of oil column decreased continuously until it was completely opened up and finally driven out with surfactant solution. Some of the oil was adsorbed on the pipe wall in the form of film residual oil, which was difficult to drive out. The oil recovery mechanism of flaky residual oil in the pores was similar to the columnar residual oil. In the process of water flooding, the formation water was difficult to sweep and drive out the flaky residual oil in the pore (Fig. 7c). In the process of surfactant flooding, the sweep volume increased and the crude oil was stripped off through emulsification and flows out of the pore with the surfactant solution (Fig. 7d). Oil film residual oil accounts for a large proportion of residual oil. It was shown in Fig. 7e, the thickest part of the oil film was 41.8 μm after water flooding. In the process of surfactant displacement, the crude oil attached to the rock surface was dispersed and stripped under the condition of shear force. The O/W emulsion was produced with injected water and the thickness of the oil film reduced from 41.8 μm to 19.5 μm (Fig. 7f) which decreased by 53.3%.
The findings and mechanisms of surfactant flooding are summarized to be IFT reduction, wettability alteration and emulsification of petroleum.58,59 The MEOR mechanisms of emulsification, bioclogging, interfacial tension reduction and wettability alteration have been studied by Ryan and Nabi Vahdanikia.60,61 Oil film had almost replaced with water phase in some parts of pore walls after treatment with E. cloacae cells. This indicated the main EOR mechanism of E. cloacae cells and its byproducts were wettability alteration.62 However, film residual oil remains dominant in the residual oil in this micromodel test. In this experiment, IFT and emulsification were the main mechanism of EOR in this study. IFT reduction is considered to be the most important mechanism of surfactant flooding.63 IFT reduction make the residual oil in the pore tend to be broken down into small oil droplets.64 These enhance oil recovery through improving the sweep efficiency and making residual oil become extremely flexible.65 The biosurfactant can separate the crude oil from the oil column and the oil film to form O/W emulsion droplets to achieve the goal of EOR. In many biosurfactant micromodel test, IFT reduction and emulsification was the mainly EOR mechanism.60,61
4 Conclusions
Indigenous biosurfactant producers isolated from reservoir are often the most appropriate candidates for performing MEOR process. In present work, indigenous biosurfactant-producing strains were isolated from the formation water of the CQ Oilfield in China. Biosurfactant-producing strain Brevibacillus borstelensis YZ-2 was chosen for further study because of its excellent interfacial active. Chromatography methods were used to separate and purify the biosurfactants produced by YZ-2. MALDI-TOF-MS/MS results revealed biosurfactants produced by strain YZ-2 were identified as different isoforms and homologs of fengycin. The biosurfactant production was optimized through Box–Behnken design. The most significant factors influence on the biosurfactant production was the addition of corn steep powder concentration, followed by the addition of MgSO4 and peptone. Core flooding tests were also conducted to further investigate the ability of microorganism toward MEOR process. Results showed that YZ-2 biosurfactant enhance oil recovery by reducing the oil–water IFT and crude oil emulsification.Conflicts of interest
There are no conflicts to declare.Acknowledgements
This investigation was financially supported by the National Natural Science Foundation of China (51634008, 51804041), Scientific Research Program Funded by Shaanxi Provincial Education Department (Program No. 20JS119).References
- J. Patel, S. Borgohain, M. Kumar, V. Rangarajan, P. Somasundaran and R. Sen, Renew. Sustain. Energy Rev., 2015, 52, 1539–1558 CrossRef CAS.
- D. M. Ashish, J. Pet. Sci. Eng., 2018, 170, 40–48 CrossRef.
- F. Gassara, N. Suri, P. Stanislav and G. Voordouw, Environ. Sci. Technol., 2015, 49(20), 12594–12601 CrossRef CAS PubMed.
- E. J. Gudina, J. F. B. Pereira, R. Costa, J. A. P. Coutinho, J. A. Teixeira and L. R. Rodrigues, J. Hazard. Mater., 2013, 261, 106–113 CrossRef CAS PubMed.
- G. Li, P. Gao, Y. Wu, H. Tian, X. Dai, Y. Wang, Q. Cui, H. Zhang, X. Pan, H. Dong and T. Ma, Environ. Sci. Technol., 2014, 48(9), 5336–5344 CrossRef CAS PubMed.
- F. Zhang, Y. She, I. M. Banat, L. Chai, S. Yi, G. Yu and D. Hou, Energy Fuels, 2014, 28(2), 1191–1197 CrossRef CAS.
- A. E. Elshafie, S. J. Joshi, Y. M. Al-Wahaibi, A. S. Al-Bemani, S. N. Al-Bahry, D. Al-Maqbali and I. M. Banat, Front. Microbiol., 2015, 6, 1324 Search PubMed.
- B. Haq, J. Liu, K. Liu and D. Al Shehri, J. Pet. Sci. Eng., 2020, 189, 106688 CrossRef CAS.
- A. Rabiei, M. Sharifinik, A. Niazi, A. Hashemi and S. Ayatollahi, Appl. Microbiol. Biotechnol., 2013, 97(13), 5979–5991 CrossRef CAS PubMed.
- G. S. Kiran, S. Priyadharsini, A. Sajayan, G. B. Priyadharsini, N. Poulose and J. Selvin, Front. Microbiol., 2017, 8, 1138 CrossRef PubMed.
- Y. Chen, S. A. Liu, H. Mou, Y. Ma, M. Li and X. Hu, Front. Microbiol., 2017, 8, 871 CrossRef PubMed.
- H. Dong, W. Xia, H. Dong, Y. She, P. Zhu, K. Liang, Z. Zhang, C. Liang, Z. Song, S. Sun and G. Zhang, Front. Microbiol., 2016, 7, 1710 Search PubMed.
- B. Jasim, K. S. Sreelakshmi, J. Mathew and E. K. Radhakrishnan, Microb. Ecol., 2016, 72(1), 106–119 CrossRef CAS PubMed.
- M. S. Kuyukina, I. B. Ivshina, I. O. Korshunova, G. I. Stukova and A. V. Krivoruchko, Amb. Express, 2016, 6, 14 CrossRef PubMed.
- K. Patowary, R. Patowary, M. C. Kalita and S. Deka, Front. Microbiol., 2017, 8, 279 Search PubMed.
- Y. Hsueh, E. B. Somers, D. Lereclus, E. Ghelardi and A. C. L. Wong, Appl. Environ. Microbiol., 2007, 73(22), 7225–7231 CrossRef CAS PubMed.
- M. Morikawa, H. Daido, T. Takao, S. Murata, Y. Shimonishi and T. Imanaka, J. Bacteriol., 1993, 175(20), 6459–6466 CrossRef CAS PubMed.
- S. Jiao, X. Li, H. Yu, H. Yang, X. Li and Z. Shen, Biotechnol. Bioeng., 2017, 114(4), 832–842 CrossRef CAS PubMed.
- L. Sang-Cheol, S. Kim, I. Park, S. Chung, M. S. Chandra and Y. Choi, Biotechnol. Bioproc. Eng., 2010, 15(2), 246–253 CrossRef.
- B. C. S. Farias, D. C. Hissa, C. T. M. Do Nascimento, S. A. Oliveira, D. Zampieri, M. N. Eberlin, D. L. S. Migueleti, L. F. Martins, M. P. Sousa, D. N. Moyses and V. M. M. Melo, Appl. Microbiol. Biotechnol., 2018, 102(3), 1179–1190 CrossRef CAS PubMed.
- G. S. Kiran, S. Priyadharsini, A. Sajayan, G. B. Priyadharsini, N. Poulose and J. Selvin, Front. Microbiol., 2017, 8, 1138 CrossRef PubMed.
- D. G. De Almeida, R. D. C. F. Soares Da Silva, J. M. Luna, R. D. Rufino, V. A. Santos, I. M. Banat and L. A. Sarubbo, Front. Microbiol., 2016, 7, 1718 Search PubMed.
- I. M. Banat, A. Franzetti, I. Gandolfi, G. Bestetti, M. G. Martinotti, L. Fracchia, T. J. Smyth and R. Marchant, Appl. Microbiol. Biotechnol., 2010, 87(2), 427–444 CrossRef CAS PubMed.
- R. Marchant and I. M. Banat, Trends Biotechnol., 2012, 30(11), 558–565 CrossRef CAS PubMed.
- I. M. Banat, S. K. Satpute, S. S. Cameotra, R. Patil and N. V. Nyayanit, Front. Microbiol., 2014, 5, 697 Search PubMed.
- P. Das, S. Mukherjee and R. Sen, Bioresour. Technol., 2009, 100(2), 1015–1019 CrossRef CAS PubMed.
- S. N. Al-Bahry, Y. M. Al-Wahaibi, A. E. Elshafie, A. S. Al-Bemani, S. J. Joshi, H. S. Al-Makhmari and H. S. Al-Sulaimani, Int. Biodeterior. Biodegradation, 2013, 81(SI), 141–146 CrossRef CAS.
- E. J. Gudina, E. C. Fernandes, A. I. Rodrigues, J. A. Teixeira and L. R. Rodrigues, Front. Microbiol., 2015, 6, 59 Search PubMed.
- S. N. R. L. Silva, C. B. B. Farias, R. D. Rufino, J. M. Luna and L. A. Sarubbo, Colloids Surf., B, 2010, 79(1), 174–183 CrossRef CAS PubMed.
- M. Nitschke and G. M. Pastore, Bioresour. Technol., 2006, 97(2), 336–341 CrossRef CAS PubMed.
- D. G. Almeida, R. D. C. F. Soares Da Silva, J. M. Luna, R. D. Rufino, V. A. Santos and L. A. Sarubbo, Front. Microbiol., 2017, 8, 157 Search PubMed.
- R. D. Cássia, F. S. D. Silva, R. D. Rufino, J. M. Luna, C. B. B. Farias, F. Hilario, V. A. D. Santos and L. A. Sarubbo, Tenside Surfact. Det., 2013, 50(2), 137–142 CrossRef.
- C. Vigneshwaran, V. Sivasubramanian, K. Vasantharaj, N. Krishnanand and M. Jerold, J. Environ. Chem. Eng., 2018, 6, 4347–4356 CrossRef CAS.
- C. Vigneshwaran, K. Vasantharaj, N. Krishnanand and V. Sivasubramanian, J. Environ. Chem. Eng., 2021, 9, 104867 CrossRef CAS.
- S. Dhagat and S. Eswari Jujjavarapu, J. Environ. Manage., 2021, 291, 112667 CrossRef CAS PubMed.
- R. Thavasi, S. Jayalakshmi and I. M. Banat, Bioresour. Technol., 2011, 102(3), 3366–3372 CrossRef CAS PubMed.
- I. A. Purwasenaa, D. I. Astutia, M. Syukrona, M. Amaniyaha and Y. Sugaib, J. Pet. Sci. Eng., 2019, 183, 106383 CrossRef.
- J. Chen, P. T. Huang, K. Y. Zhang and F. R. Ding, J. Appl. Microbiol., 2012, 112(4), 660–671 CrossRef CAS PubMed.
- M. Geissler, C. Oellig, K. Moss, W. Schwack, M. Henkel and R. Hausmann, J. Chromatogr., B, 2017, 1044, 214–224 CrossRef PubMed.
- K. Patowary, R. Patowary, M. C. Kalita and D. Suresh, Front. Microbiol., 2017, 8, 279 Search PubMed.
- X. Hua, Z. Wu, H. Zhang, D. Lu, M. Wang, Y. Liu and Z. Liu, Chemosphere, 2010, 80(8), 951–956 CrossRef CAS PubMed.
- H. Farhadi, S. Ayatollahi and M. Fatemi, J. Pet. Sci. Eng., 2021, 196, 107862 CrossRef CAS.
- H. Yang, X. Li, X. Li, H. Yu and Z. Shen, Anal. Bioanal. Chem., 2015, 407(9), 2529–2542 CrossRef CAS PubMed.
- A. R. Najafi, M. R. Rahimpour, A. H. Jahanmiri, R. Roostaazad, D. Arabian and Z. Ghobadi, Chem. Eng. J., 2010, 163(3), 188–194 CrossRef CAS.
- F. Gassara, N. Suri, P. Stanislav and G. Voordouw, Environ. Sci. Technol., 2015, 49(20), 12594–12601 CrossRef CAS PubMed.
- S. J. Joshi, Y. M. Al-Wahaibi, S. N. Al-Bahry, A. E. Elshafie, A. S. Al-Bemani, A. Al-Bahri and M. S. Al-Mandhari, Front. Microbiol., 2016, 7, 1853 Search PubMed.
- B. Dunsmore, C. Bass, C. J. Lappin-Scott and M. Hilary, Environ. Microbiol., 2004, 6(2), 183–187 CrossRef PubMed.
- M. Srikanth Reddy, B. Naresh, T. Leela, M. Prashanthi, N. Ch. Madhusudhan, G. Dhanasri and P. Devi, Bioresour. Technol., 2010, 101, 7980–7983 CrossRef PubMed.
- J. Wang, N. I. A. Haddad, S. Yang and B. Mu, Appl. Biochem. Biotechnol., 2010, 160(3), 812–821 CrossRef CAS PubMed.
- P. Datta, P. Tiwari, M. Lalit and J. Pandey, J. Pet. Sci. Eng., 2020, 195, 107612 CrossRef CAS.
- K. V. Pathak, H. Keharia, K. Gupta, S. S. Thakur and P. Balaram, J. Am. Soc. Mass Spectrom., 2012, 23, 1716–1728 CrossRef CAS PubMed.
- A. A. Kaki, N. Smargiasso, M. Ongena, M. K. Ali, N. Moula, E. De Pauw and N. K. Chaouche, Curr. Microbiol., 2020, 77(9), 443–451 CrossRef PubMed.
- S. H. Kim, E. J. Lim, S. O. Lee, J. D. Lee and T. H. Lee, Biotechnol. Appl. Biochem., 2000, 31, 249–253 CrossRef CAS PubMed.
- R. Verma, S. Sharma, L. M. Kundu and L. M. Pandey, J. Water Proc. Eng., 2020, 38, 101632 CrossRef.
- A. Najafi-Marghmaleki, S. Kord, A. Hashemi and H. Motamedi, Fuel, 2018, 232, 27–35 CrossRef CAS.
- P. Sarafzadeh, A. Z. Hezave, M. Ravanbakhsh, A. Niazi and S. Ayatollahi, Colloids Surf., B, 2013, 105, 223–229 CrossRef CAS PubMed.
- T. Amirianshoja, R. Junin, A. K. Idris and O. Rahmani, J. Pet. Sci. Eng., 2013, 101, 21–27 CrossRef CAS.
- W. Yang, J. Lu, B. Wei, H. Yu and T. Liang, ACS Omega, 2021, 6, 6064–6069 CrossRef CAS PubMed.
- B. Hou, Y. Wang, X. Cao, J. Zhang, X. Song, M. Ding and W. Chen, J. Surfactants Deterg., 2015, 19, 315–324 CrossRef.
- R. T. Armstrong and D. Wildenschild, J. Pet. Sci. Eng., 2012, 94, 155–164 CrossRef.
- N. Vahdanikia, D. Hassan, A. Hemmati-Sarapardeh, N. Amar Menad, M. Schaffie and M. Ranjbar, J. Pet. Sci. Eng., 2020, 192, 107229 CrossRef CAS.
- H. Khajepour, M. Mahmoodi, D. Biria and S. Ayatollahi, J. Pet. Sci. Eng., 2014, 120, 10–17 CrossRef CAS.
- X. Zhao, Y. Feng, G. Liao and W. Liu, J. Colloid Interface Sci., 2020, 578, 629–640 CrossRef CAS PubMed.
- C. G. Ezeh, C.-Y. Chen and K. D. Papadopoulos, Colloids Surf., A, 2018, 558, 123–129 CrossRef CAS.
- M. Tagavifar, K. Xu, S. H. Jang, M. T. Balhoff and G. A. Pope, Langmuir, 2017, 33(45), 13077–13086 CrossRef CAS PubMed.
Footnote |
| † Electronic supplementary information (ESI) available. See DOI: 10.1039/d1ra07663a |
| This journal is © The Royal Society of Chemistry 2022 |