 Open Access Article
Electrochemically driven optical and SERS immunosensor for the detection of a therapeutic cardiac drug†
Madeeha Chaudhry af,
Dong-Kwon Lim
 b,
Jeon Woong Kang
 c,
Zahid Yaqoobc,
Peter Socde,
Muhammad Fahad Bhopala,
Minqiang Wangg,
Raheel Qamari and
Arshad Saleem Bhatti
 *ah
*ah
aCentre for Micro and Nano Devices, Department of Physics, COMSATS University Islamabad, Tarlai Kalan, Islamabad 45550, Pakistan. E-mail: asbhatti@comsats.edu.pk
bKU-KIST Graduate School of Converging Science and Technology, Korea University, Seoul, Korea
cLaser Biomedical Research Center, G. R. Harrison Spectroscopy Laboratory, Massachusetts Institute of Technology, Cambridge, MA 02139, USA
dDepartment of Mechanical Engineering, Massachusetts Institute of Technology, Cambridge, MA 02139, USA
eDepartment of Biological Engineering, Massachusetts Institute of Technology, Cambridge, MA 02139, USA
fDepartment of Biosciences, International Islamic University, H-10, Islamabad Capital Territory, 44000 Islamabad, Pakistan
gElectronic Materials Research Laboratory, Key Laboratory of the Ministry of Education & International Center for Dielectric Research, Shaanxi Engineering Research Center of Advanced Energy Materials and Devices, Faculty of Electronic and Information Engineering, Xi'an Jiaotong University, Xi'an, 710049, China
hVirtual University of Pakistan, M.A Jinnah CampusLahorePakistan
iScience &Technology Sector, ICESCO, Rabat, Morocco
First published on 20th January 2022
Abstract
Cardiovascular diseases pose a serious health risk and have a high mortality rate of 31% worldwide. Digoxin is the most commonly prescribed pharmaceutical preparation to cardiovascular patients particularly in developing countries. The effectiveness of the drug critically depends on its presence in the therapeutic range (0.8–2.0 ng mL−1) in the patient's serum. We fabricated immunoassay chips based on QD photoluminescence (QDs-ELISA) and AuNP Surface Enhanced Raman Scattering (SERS-ELISA) phenomena to detect digoxin in the therapeutic range. Digoxin levels were monitored using digoxin antibodies conjugated to QDs and AuNPs employing the sandwich immunoassay format in both the chips. The limit of detection (LOD) achieved through QDs-ELISA and SERS-ELISA was 0.5 ng mL−1 and 0.4 ng mL−1, respectively. It is demonstrated that the sensitivity of QDs-ELISA was dependent on the charge transfer mechanism from the QDs to the antibody through ionic media, which was further explored using electrochemical impedance spectroscopy. We demonstrate that QDs-ELISA was relatively easy to fabricate compared to SERS-ELISA. The current study envisages replacement of conventional methodologies with small immunoassay chips using QDs and/or SERS-based tags with fast turnaround detection time as compared to conventional ELISA.
1 Introduction
Cardiovascular diseases (CVDs) are one of the leading causes of death worldwide with a mortality rate of 30–31%.1,2 According to World Health Organization (WHO) data, CVDs are the most prevalent non-communicable diseases in Pakistan with a mortality rate of 19%.3 Sedentary lifestyle, lack of awareness, and tobacco consumption are important contributing factors for cardiac problems in the Pakistani population.4 In addition, atrial fibrillation and heart failure are common types of CVD involving systolic dysfunction, whose prevalence rate increases with age.5,6 A patient might develop both atrial fibrillation and heart failure since one of these could predispose the other.6Digoxin is one of the most commonly prescribed cardiac glycosides with a positive inotropic effect to the patients of heart failure and atrial fibrillation.7 It strengthens the weakened heart muscles by helping them in contraction for restoring normal heart rhythm. It works by inhibiting the Na+/K+ pump (active ion transporter in human myocardium) through binding to its allosteric site on the pump. This results in the accumulation of intracellular Na+ ions, excess of which inside the cell binds to the second pump which is the Na+/Ca2+ exchanger. This effect induces intercellular transportation of one extracellular Ca2+ ion and extracellular transportation of three Na+ ions in the presence of adenosine triphosphate (ATP). The increasing of Ca2+ ions inside the cell induces cardiac action potential and leads to weak heart muscles contractions.8,9
Digoxin is administered orally or injection to cardiac patients. It has a narrow therapeutic range of 0.8–2 ng mL−1.10 Since a concentration above or below this window in the serum could be fatal, continuous and careful monitoring is required for effective treatment.11,12 Chromatography and immunoassay are commonly used for digoxin detection. High performance liquid chromatography (HPLC) or liquid chromatography (LC) combined with mass spectroscopy (MS) is the most sophisticated technique for digoxin monitoring in blood,8,13 serum14 and urine.15,16 The drawbacks of chromatographic techniques are large sample consumption, complex sample preparation procedures, and purification requirements; all are time-consuming processes and limit their application in diagnostics.17 In contrast, immunoassay procedure is easily available, requires less skilled personnel, and is easily implementable in emergency toxicology situations.18
The most commonly used immunoassay techniques include the radioimmunoassay (RIA), enzyme immunoassay (EIA), fluorescence polarization immunoassay (FPIA), enzyme multiplied immunoassay technique (EMIT), and chemiluminescent microparticle immunoassay (CMIA). These techniques are based on enzyme-linked immunosorbent assay (ELISA) detection where fluorescent molecules could be enzymes, microparticles, radioactive molecules, etc.19,20 In Pakistan, digoxin level measurement is commonly done through CMIA technique, which uses architect immunoassay analyzer and only available in private laboratories or major hospitals in metropolitan cities of Pakistan.
The advancements in microelectromechanical systems (MEMS) technology combined with the miniaturized ELISA coupled with a detection module on the chip provides an efficient way for conducting study of antigen–antibody assays. The detection could be electrochemical, mechanical or optical. Optical detection method is one of the preferred techniques because of its sensitivity, robustness and simple instrumentation.21 Among various optical detection methods employed are fluorescence, absorbance, chemiluminescence and surface plasmon resonance (SPR) or surface enhanced Raman spectroscopy (SERS).21,22 A number of microfluidic devices offering on-chip drug level detection have been reported, e.g., fluorescence-based detection of theophylline,23 antithrombotic drug24 using FPIA, and vancomycin.25 Similarly, reported a bioluminescent biosensor for the detection of a wide range of pharmaceutical preparations like immunosuppressant, antiepileptic, anticancer and antiarrhythmias.26
There are different types of nanomaterials such as quantum dots, carbon nanotubes (CNTs), nanowires, Au-NPs, and nanoshells used for detection and diagnosis in microfluidic platforms. Studies have reported use of MoS2/graphene heterostructures and MoS2 nanosheets for biomedical applications.27,28 Another study reported small analyte detection on quartz crystal microbalance based immunosensor using gold nanoparticles.29 Among these, the most preferred for diagnostic applications are Au-NPs and QDs due to their small size, large surface area to volume ratio, ease of synthesis, bioconjugation and tunable optical properties.30 Optical properties of QDs include size-dependent emission spectra, 20 times brighter and 100 times more stable than traditional dyes offering high sensitivity and fluorescence stability with a broad excitation spectrum.31 On the other hand Au-NPs changes the optical behavior of organic molecules on conjugation26,32 by multiplexing through SERS tag as its spectra give information of a whole range of molecules present in the sample.30,33
Recent studies have also reported digoxin detection through electrochemical method using Au coated magnetic nanoparticles,31,34–36 optical and electrochemical aptasensors37–40 immunochromatographic strip using colloidal Au-NPs, fluoroimmunoassay,41 bioluminescent,26 amperometric,42 low surface plasmon resonance of AuNPs,43 and impedance spectroscopy.44 However, no extensive or a detailed study is available for digoxin optical and electrochemical detection through QDs so far.
In the current study, we present simple and efficient digoxin detection using photoluminescence (PL) technique and compare with SERS based technique, which can easily be employed in microfluidic chip. Small immunoassay chips of quartz slide were prepared for both PL and SERS detections employing the sandwich immunoassay technique. Quartz slides were used instead of conventional polystyrene or polypropylene based microplate ELISA reader because quartz offer less background noise or absorbance especially in UV range as compared to the aforementioned.45 The chips were first coated with digoxin antibody (Ab) followed by incubation with digoxin and then QD or Au-NP tagged Ab completing the sandwich immunoassay format. The prepared chips were characterized with the photoluminescence spectroscopy and Raman spectroscopy, respectively for QDs and Au-NPs. Finally limit of detection (LOD) was determined for both techniques for comparison of accuracy.
2 Materials and methods
2.1. Chemicals
CdSe/ZnS quantum dots with an emission wavelength of 665 nm were purchased from PlasmaChem GmbH (Berlin, Germany). Chloroform and ligand thioglycolic or mercaptoacetic acid (MAA) (99%) from Sigma Aldrich (St. Louis, Missouri). Polyclonal digoxin antibody and 100 mM phosphate buffer saline (PBS) pH 7.2 ± 0.1 (containing 137 mM NaCl, 2 mM KCL, and 10 mM phosphate buffer) was purchased from Abcam (Cambridge, UK) and bioWORLD (Dublin, Ohio), respectively, for preparing antibody dilutions.Au-NPs were purchased from Ted Pella, Inc. (Redding, CA). Raman reporter 4-nitrothiophenol (NTP) (technical grade, 80%) for coating the Au-NPs, sodium silicate solution (reagent grade), bovine serum albumin, BSA (≥96%), (3-aminopropyl)trimethoxy silane (APTMS) (97%), and N-(3-dimethylaminopropyl)-N-ethylcarbodiimide (EDC) (≥97%), N-hydroxyl succinimide (NHS) (98%) for antibody conjugation and digoxin dilution (1 mL in methanol) were acquired from Sigma-Aldrich. Polyclonal antibody was purchased from Abcam and phosphate buffer saline (PBS) for antibody dilution was obtained from Thermo Fisher Scientific (Gibco™, 1× pH 7.2). For carboxyl group activation on Au-NPs and quartz slide (3-triethoxysilyl) polysuccinic anhydride (TEPSA) (95%) was purchased from Gelest (Morrisville, PA). Quartz cover slips (25.4 mm dia × 0.15–0.25 mm thick) were purchased from Alfa Aesar (Lancashire, UK). Silicone based press to seal isolator wells (2.5 mm diam. × 0.5 mm depth) on quartz slide based microchip devices were also purchased from Sigma Aldrich.
2.2. Biofunctionalization of QDs and AuNPs
Before the detection scheme, QDs and AuNP needs to be biofunctionalized for conjugation with antibody as shown in Fig. 1a and b. In case of QDs being an organic solvent, water solubilization is an accessory step followed by conjugation with antibody as shown in (Fig. 1).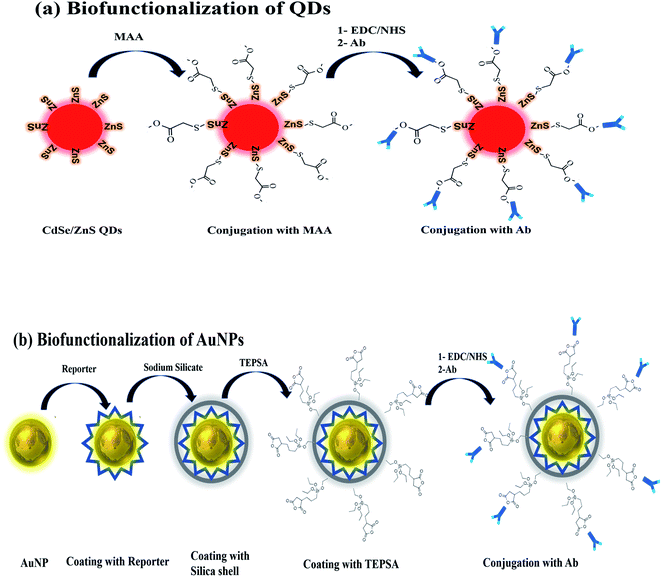 | ||
| Fig. 1 Biofunctionalization scheme of (a) CdSe/ZnS QDs involving coating with MAA and the antibody, (b) AuNPs coating with reporter, silica shell, TEPSA and antibody. | ||
![[thin space (1/6-em)]](https://www.rsc.org/images/entities/char_2009.gif) :
:![[thin space (1/6-em)]](https://www.rsc.org/images/entities/char_2009.gif) 1 by volume was added in the solution of MAA coated QDs, which were then separated and purified. The purified QDs were then dispersed in PBS buffer for further use.
1 by volume was added in the solution of MAA coated QDs, which were then separated and purified. The purified QDs were then dispersed in PBS buffer for further use.The reporter was added dropwise and the solution was kept stirring for 30 minutes. After 30 minutes, silane APTMS solution in ethanol (30 μL, 0.1 M) was added and left stirring for another 30 minutes. The pH 9.0–10 was adjusted using 1 M NaOH during the stirring process. Au-NPs were coated with a protective silica layer, which prevented aggregation, process of photobleaching and improved their water solubility. Silane was introduced to make NPs surface vitreophilic to make it reactable with silica. APTMS coating makes vitreophilic; receptive to silica groups followed by binding to trimethoxy silane group which is exposed to the environment.47,48 After silane coating, sodium silicate solution was added to make a protective silica shell around the Au-NPs surface. Three different volumes of sodium silicate (300 μL, 500 μL, 1 mL; 0.60 wt%) solution were added dropwise while continuously stirring, followed by stirring overnight. 5 mL anhydrous ethanol was added to the solution 24 hours later to obtain a uniform silica layer and the solution was left standing for another day. The purification of SERS tag modified Au-NP was done using anhydrous ethanol and 1× PBS, 3–4× at 6000 rpm for 10 minutes. The SERS modified Au-NP were dispersed in 1 mL 1× PBS for future use.
2.2.3.1 Ab conjugation of quantum dots. MAA coated QDs in buffer were incubated with EDC/NHS (150 μL, 0.1 M) for 2 hours using carbodiimide crosslinking chemistry. After 2 hours, the antibody (150 μL, 1
![[thin space (1/6-em)]](https://www.rsc.org/images/entities/char_2009.gif) :
:![[thin space (1/6-em)]](https://www.rsc.org/images/entities/char_2009.gif) 10 dilution in PBS) was added and left overnight for conjugation. The following day, solution of Ab coated QDs was preserved in buffer till further experiments.
10 dilution in PBS) was added and left overnight for conjugation. The following day, solution of Ab coated QDs was preserved in buffer till further experiments.
2.2.3.2 Ab conjugation of Au-NPs. SERS tagged Au-NPs were incubated overnight with TEPSA (0.15 μM) followed by purification and washing using 1× PBS to remove excess TEPSA. TEPSA has silica group at one end, which binds with Au-NPs and carboxyl group at the other end, which conjugates with antibody (Ab). The carboxyl groups were activated for antibody conjugation by incubating Au-NPs with EDC/NHS (150 μL, 0.15 mM) using carbodiimide crosslinking chemistry for 2 hours. After 2 hours of incubation with EDC/NHS, digoxin antibody (150 μL, 1
![[thin space (1/6-em)]](https://www.rsc.org/images/entities/char_2009.gif) :
:![[thin space (1/6-em)]](https://www.rsc.org/images/entities/char_2009.gif) 10 dilution in PBS) was added and left overnight. Similarly, after 2 hours of antibody conjugation, bovine serum albumin (BSA) (100 μL, 0.1%) was added in Au-NPs solution and left for one hour. Then, centrifugation of Ab-conjugated Au-NPs was done twice using PBS buffer at 6640g (6000 rpm) for 10 minutes, followed by dispersion in 200 μL PBS for SERS experiment.
10 dilution in PBS) was added and left overnight. Similarly, after 2 hours of antibody conjugation, bovine serum albumin (BSA) (100 μL, 0.1%) was added in Au-NPs solution and left for one hour. Then, centrifugation of Ab-conjugated Au-NPs was done twice using PBS buffer at 6640g (6000 rpm) for 10 minutes, followed by dispersion in 200 μL PBS for SERS experiment.
2.3. Preparation of quartz slides for sandwich ELISA
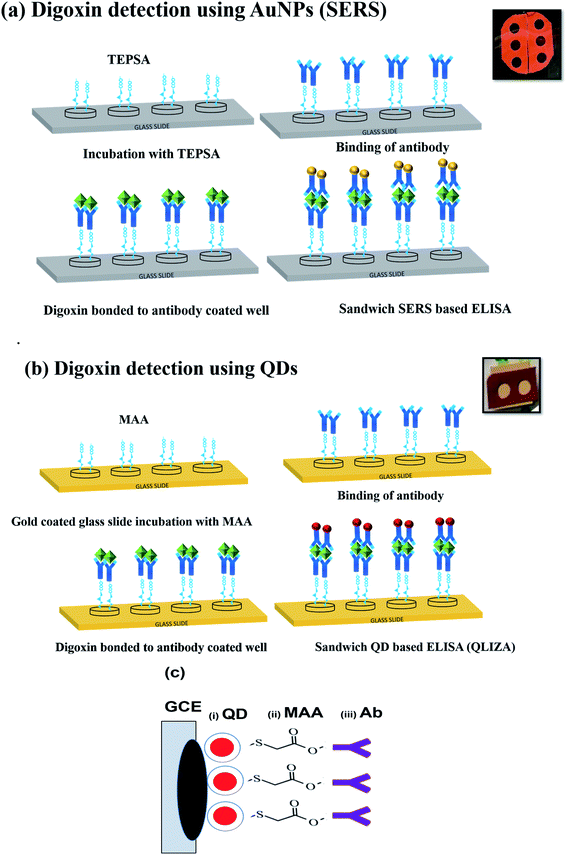
Quartz slides were cleaned by ultrasonication in ethanol solution. For QDs based detection, the cleaned slides were coated with 50 nm gold through sputtering as shown in Fig. 1b. The gold coating would be helpful in bonding MAA with quartz slides through Au–S bond while rendering free carboxyl group of MAA for antibody conjugation.Immunoassay chips or devices for drug level monitoring were prepared by fixing silicone-based isolator with holes (wells) on the cleaned quartz slide. Two sets of wells were prepared, where each well of both sets was then used for different dilutions of digoxin as shown in (Fig. 2a and b). As shown in Fig. 2a, the first set was prepared for SERS detection using Au-NPs, where each well was first coated with carboxyl group for Ab conjugation by putting TEPSA buffer solution (10 μL, 100 mM). In the second set wells were prepared for QDs, carboxyl group coating was done by the adding MAA (10 μL, 0.1 M). Both sets of wells were left overnight to complete the conjugation reaction.
The excess TEPSA and MAA were removed from both sets of wells by washing with ethanol and PBS 1×. In the next step activation of the coated carboxyl groups in each well was done using EDC/NHS (10 μL, 0.1 M). 2 hours later PBS buffer washing step was performed to remove excess EDC/NHS from both sets of wells. The antibody conjugation with carboxyl group was performed by overnight incubation of all wells (for QDs and SERS Au-NPs) with Ab (10 μL, 1![[thin space (1/6-em)]](https://www.rsc.org/images/entities/char_2009.gif) :
:![[thin space (1/6-em)]](https://www.rsc.org/images/entities/char_2009.gif) 10 dilution in PBS). After antibody conjugation, all the wells were washed with PBS 2–3×. Then 2 μL of BSA (0.1%) was added in each well to prevent non-specific binding of Ab to the wells and left for an hour. This was followed by washing with PBS solution and incubation with various dilutions of digoxin in each well and left for an hour. After an hour excess digoxin was removed by washing with PBS, and finally the addition of prepared Ab conjugated SERS tags (Au-NPs) and QDs in wells. The scheme of preparation of immunoassay sandwich ELISA chips with various dilutions of digoxin is shown in (Fig. 2a and b) as explained above.
10 dilution in PBS). After antibody conjugation, all the wells were washed with PBS 2–3×. Then 2 μL of BSA (0.1%) was added in each well to prevent non-specific binding of Ab to the wells and left for an hour. This was followed by washing with PBS solution and incubation with various dilutions of digoxin in each well and left for an hour. After an hour excess digoxin was removed by washing with PBS, and finally the addition of prepared Ab conjugated SERS tags (Au-NPs) and QDs in wells. The scheme of preparation of immunoassay sandwich ELISA chips with various dilutions of digoxin is shown in (Fig. 2a and b) as explained above.
2.4. Digoxin dilutions
Different log dilutions of digoxin were prepared in PBS buffer from the stock digoxin solution (1 mg mL−1 in methanol). Dilutions were prepared using amounts: 1 μg, 0.1 μg, 0.01 μg, 2.0 ng, 1.0 ng 0.8 ng and 0.1 ng digoxin in PBS (1 mL, 1×, pH 7.2).2.5. Electrochemical analysis
Glassy carbon electrode (GCE) (working electrode (WE)) was cleaned in ethanol solution using ultrasonication for 20 minutes at 45 °C. This was followed by recording of cyclic-voltammetry spectra of 20–25 scans of GCE coated with alumina slurry at 50 mV in the presence of sulphuric acid solution to remove any contaminants on the electrode's surface, before washing with ethanol. After every single measurement, the electrode cleaning steps were followed to ensure the clean surface. The electrode was modified with bare CdSe/ZnS dots (QDs), MAA conjugated CdSe/ZnS dots, and finally MAA–CdSe/ZnS dots conjugated with Ab (Fig. 2c). For measurements, 10 μL of QDs, MAA-QDs or MAA-QDs–Ab were deposited on GCE and dried overnight. The scan rate across the WE was varied from 0.01 V s−1 to 0.15 V s−1 with step size of 0.02 V and the spectra were recorded for each modification. The CV measurements were followed by the EIS measurements at 0.1 V.2.6. Characterizations
UV-Vis spectra of bare and coated (with reporter and sodium silicate) Au-NPs were acquired using Shimadzu UV-VIS spectrophotometer (UV-2401 PC). The transmission electron micrographs of bare and silica shell coated Au-NPs were acquired using FEI Tecnai G2 Spirit TWIN TEM operating at 120 kV. The samples (bare and MAA coated CdSe/ZnS QDs) for TEM measurements were prepared on 200 μm mesh Cu grids (CF-200 Cu, Electron Microscopy Sciences).The photoluminescence (PL) spectroscopy of the bare, antibody and drug conjugated QDs was performed by Dongwoo Optoron LabRAM spectrometer. The excitation was done with a He–Cd laser emitting at 325 nm with a power of 50 mW. All spectra were recorded at room temperature and corrected for the detector response. The PL spectra were fitted with a Gaussian function to determine the peak positions and integrated intensities at each step of conjugation and for each dilution.
SERS measurements were performed through a custom-built inverted confocal Raman microscope. The excitation source was a Ti:Sapphire (3900S, Spectra-Physics, Santa Clara, CA) laser with 785 nm wavelength. A 60× water immersion objective lens with 1.2 NA (UPLSAPO60XWIR 60×/1.20, Olympus, Shinjuku-ku, Tokyo) was used for laser light focusing and collection of back scattered light from the sample. The back scattered light was collected by a multi-mode fiber (M14L01, Thorlabs) and then directed to the spectrograph (Holospec f/1.8i, Kaiser Optical Systems, Ann Arbor, MI) and finally to thermoelectrically cooled CCD detector (PIXIS: 100BR_eXcelon, Princeton Instruments, USA).
Cyclic voltammetry (CV) and electrochemical impedance spectroscopy (EIS) measurements were performed in a three-electrode system in the presence of 0.1 M potassium ferricyanide electrolyte solution. Measurements were performed using Electrochemical Analyzer (Autolab, Metrohm 85695, Netherlands) and analyzed with Nova 1.1 software. In a typical CV graph, during the positive bias, i.e., cathodic cycle, analyte deposited on the electrode loses electrons to the ionic solution and Fe3+ in the electrolyte solution reduces to Fe+2 and during the reverse voltage scan, i.e., the anodic cycle, Fe+2 loses electrons to the analyte deposited on the electrode and gains back its oxidized state of Fe+3. In case of bare QDs, the electron transfer would be difficult, however in case of QDs modified with MAA and Ab efficient electron transfer mechanism would be observed due to the presence of electron donating (COO−) species. Anodic peak represents the oxidation potential (Epa) and current (Ipa) and cathodic peak, reduction potential (Epc) and current (Ipc), respectively. Similarly, EIS measurements were performed for the same aforementioned setup at 0.1 V applied across the working electrode. The Nyquist plot between the imaginary and real impedance was obtained in the frequency range of 100 kHz to 100 mHz. The Randle circuit was drawn after fitting the Nyquist plots using Nova software.
3 Results and discussion
The current study involves comparison of two immunoassay chips (QDs and AuNPs) for detection of cardiac drug digoxin. The scheme of study involving bare and biofunctionalized nanoparticles, immunoassay chips preparation and final measurement has been shown in the form of flow chart in Fig. S1.†3.1. Morphology and absorption in QDs and Au-NPs
Fig. 3a and b shows the TEM images of uniformly dispersed bare and MAA-coated QDs in chloroform and water, respectively. The average size of bare and coated QDs was 6 (±2) nm and 8 (±2) nm, respectively. The TEM images of the bare and coated Au-NPs are given in (Fig. 3c and d), which clearly show absence of Au-NPs aggregation. There was an increase in the average size of Au-NP after coating with reporter and silica shell from 60 nm to 65 (±1) nm showing a 5 (±1) nm thick coating.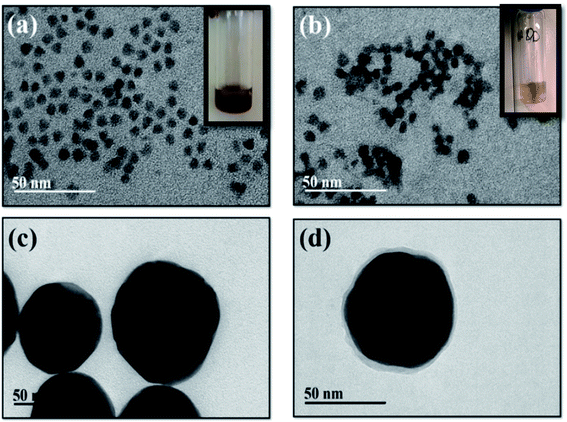 | ||
| Fig. 3 TEM images of (a) bare and (b) MAA coated QDs; (c) bare and (d) reporter and sodium silicate coated Au-NPs. | ||
Fig. S2† shows the UV-Vis spectra of bare (red color) and 4-NTP reporter coated Au-NPs (black color) with three different reporter concentrations (a: 100 μL, b: 250 μL and c: 500 μL; 10 μM). It was observed that within 30 minutes, the color of solution B and C turned purple as shown in the inset images of Fig. S2b and c,† which was attributed to the aggregation of Au-NPs. It was noted on the other hand that the color of solution A did not change during the same interval of time. It was thus considered that sample a with 100 μL of reporter was the optimal for coating of Au-NPs and subsequent experiments.
In the second step, three different volumes of sodium silicate d (300 μL), e (500 μL) and f (1000 μL) were coated on reporter (100 μl) coated Au-NPs. Fig. S2d–f† shows the UV-Vis spectra of three quantities of sodium silicate coated Au-NPs (solution d: Au-NPs coated with 300 μL; solution e: Au-NPs coated with 500 μL; solution f: Au-NPs coated with 1000 μL). A blue shift of 8 nm in the absorption peak of silica coated Au-NPs from 538 nm to 530 nm was observed. It was again observed that the sample solutions e and f turned purple after 30 minutes (as shown in insets of (e) and (f)) due to aggregation of silica coated Au-NPs. The absorption spectrum shown in (Fig. S2d†) demonstrated that the sample d (silica-reporter coated Au-NPs with 300 μL silica) was the best concentration of sodium silicate where no particle aggregation was observed.
3.2. Optical spectroscopy
Optical spectroscopy of both QDs and SERS based ELISA fabricated on quartz slides was performed on Ab conjugated digoxin attached to glass slides. Fig. S3a and b† shows the PL and SERS spectra acquired at each step of fabrication of QD (PL) and SERS (Raman) based ELISA chips on quartz slides.The three spectra in both cases were from (1) Ab (primary Ab) immobilized on slides, (2) digoxin attached to primary Ab, and (3) fully fabricated (QDs and SERS based) ELISA. Fig. 5a and b shows spectra with no significant signal for both QDs (PL) and SERS NPs (Raman) after the addition of digoxin Ab in the wells (a and b (1) on quartz slides). The second part in both figures shows that again no significant signal was observed after addition of digoxin drug on the digoxin Ab attached wells. However, a significant PL and Raman response (a and b (3)) was observed on addition of Ab-conjugated QDs and SERS NPs in each well employing complete sandwich format.
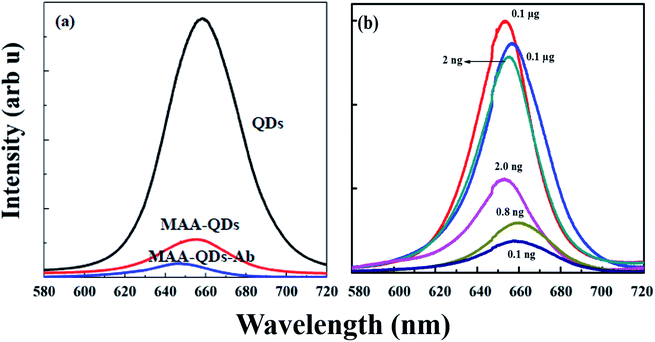
The blue shift was attributed to the passivation of surface defects present in bare CdSe/ZnS QDs. The loss in the PL intensity was attributed to the transfer of photoexcited carriers, i.e., electrons and holes to the HOMO and LUMO levels of conjugated MAA. The lowest unoccupied molecular orbitals (LUMO) of MAA, which acts as an electron trapping center, lie below the conduction band edge (CBE) and the highest occupied molecular orbitals (HOMO) of MAA, which acts as a hole acceptor lie above the valence band edge (VBE) of CdSe/ZnS QDs. The excited electrons from the conduction band of CdSe/ZnS were transferred to the LUMO levels of MAA and resulted in the quenching of PL intensity of QDs.49
Fig. 4b shows PL spectra of conjugation of MAA–Ab–digoxin with Ab coated QDs (Ab–QDs) detecting different dilutions of digoxin in sandwich assay format. We could clearly see a decrease in the PL intensity as the concentration of digoxin dug was decreased. In case of 2 ng dilution there is 30–40% decline in intensity as compared to 0.1 and 0.01 μg dilution. While, 80–90% decrease in PL intensity was observed for 1.0, 0.8 and 0.1 ng dilution as compared to 0.1 and 0.01 μg dilutions.
3.3. Charge transfer mechanism in QD–MAA–Ab
Fig. S4a and b† shows CV plots of bare (a) glassy carbon electrode (GCE) and (b) GCE modified with antibody-MAA coated QDs at various scan rates from 0.01 V s−1 to 0.15 V s−1. The purpose of the varying scan rate or potential was to get an insight of the reaction kinetics at the electrode and understand the electron transfer mechanism. The redox reactions at the electrode surface were all irreversible as there was a shift in the redox potential and increase in current with the increased scan rate as seen in (Fig. S4a and b†).50,51 At a lower scan rate, the increased thickness of the deposited material on the electrode surface limited the influx of ions and slowed the reaction. But as the scan rate was increased; there was increased movement of ions in the electrolyte solution towards the electrode surface, which resulted in the increased redox current and shifted the potential.51 A clear shift in anodic and cathodic potentials with increasing potential of WE was observed (Fig. 5a and b). The increase in the redox currents (Ipa and Ipc) showed a linear relationship (R2 ≈ 0.99) with the scan rate (Fig. 5a and b), which reflected the reaction was a diffusion-controlled process. This also signified that an electron transfer process was occurring between the species deposited on the electrode and in the electrolyte solution.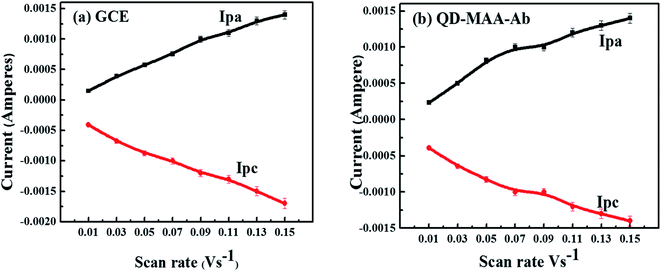 | ||
| Fig. 5 Plots of anodic and cathodic currents as a function of scan rate for (a) bare GC electrode (b) GCE modified with QDs–MAA–Ab. | ||
The rate of electron transfer and number of electrons transferred during oxidation/reduction reactions were determined: fast or slow/sluggish. In the current scenario there was a linear relationship between the reduction potential (Ep) and the scan rate, which was attribution of irreversible behavior50–52 and was described using the eqn (1):
 | (1) |
![[thin space (1/6-em)]](https://www.rsc.org/images/entities/char_2009.gif) 500 C mol−1), DR is the diffusion coefficient (cm2 s−1) and Ks is the rate constant for charge transfer. Similarly, the number of electrons involved during each cathodic and anodic cycle was determined with the help of the Laviron equation:53,54
500 C mol−1), DR is the diffusion coefficient (cm2 s−1) and Ks is the rate constant for charge transfer. Similarly, the number of electrons involved during each cathodic and anodic cycle was determined with the help of the Laviron equation:53,54
 | (2) |
The electrochemical impedance spectroscopy (EIS) was performed to determine the solution resistance and charge transfer resistance of the device and (Fig. 6) shows the Nyquist plots of the bare QDs, QDs–MAA and QDs–MAA–Ab modified GC electrodes. The plots consist of a semi-circle and a straight line. The semi-circle represents the charge transfer resistance (Rct), which varied with the configuration of electrode. The slope of the linear part represented the solution resistance (Rs).
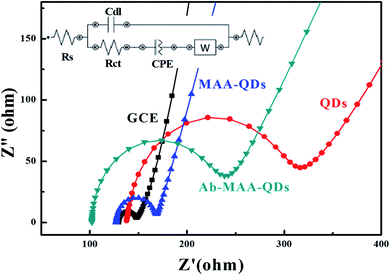 | ||
| Fig. 6 EIS spectra of the bare electrode (black squares), modified with QDs (red circles), QD–MAA (blue triangles) and QD–MAA–Ab (green inverted triangles). | ||
The Nyquist's plots were used to draw equivalent circuit of the device as shown in the inset of Fig. 6. The equivalent circuit shows the formation of a double layer capacitance (Cdl) layer, which was indication of solution adsorption on the electrode surface, Warburg impedance representing the diffusion resistance or mass transfer. There was an increase in the diameter of the semicircle for electrodes modified with QD with higher values of Rct. Also, double layer capacitance between the electrode and electrolyte solution was smaller for QDs and similarly smaller value for mass transfer. This signified an adequate transfer of electron/charge between dots on electrode and electrolyte ionic species, which varied with electrode modification and affected by the modification processes.
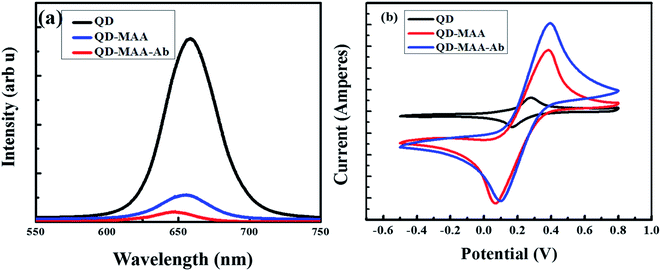
As shown in Fig. 7, there is decrease in PL of dots after conjugation with MAA and then Ab, due to the interaction of excited electron with the HOMO LUMO levels of MAA as explained in SEection 3.2.1. Comparing the CV spectra of the same materials, there is increase in the flow of current on conjugation with MAA and then with Ab. This is due to the availability of electrons on the surface of MAA and Ab, followed by the interaction of these electrons with the electrolytic solution as explained in the explanation of CV in Section 2.6 (Characterization).
3.4. SERS of biofunctionalized Au-NPs
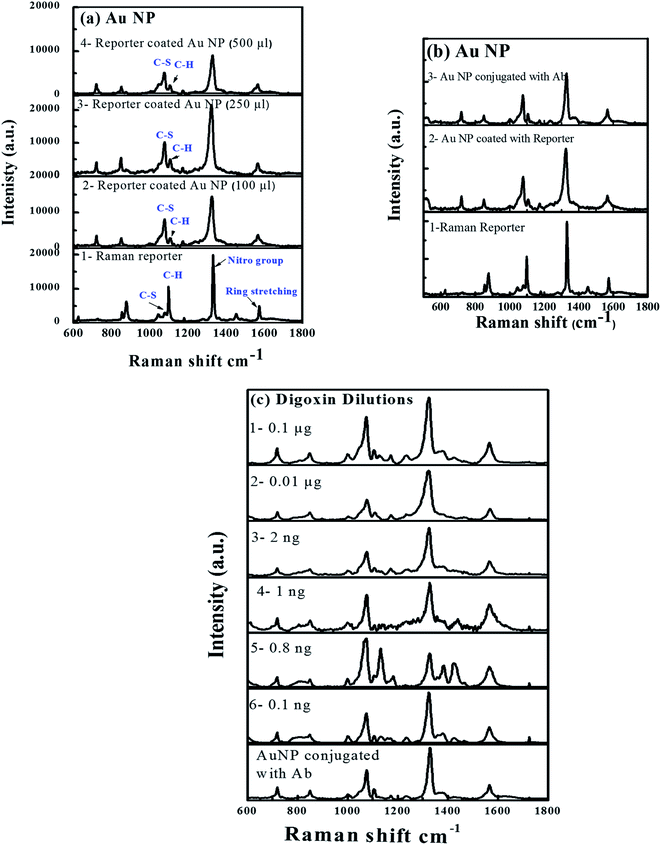
Fig. 8 shows (a) SERS spectra of reporter (1) and reporter coated with different concentrations of Au-NPs (2–4), (b) SERS from reporter (1), reporter tagged Au-NPs (2) and Ab reporter tagged Au-NPs (3); and (c) SERS spectra of different dilutions of digoxin in sandwich assay format (digoxin–Ab + digoxin drug + SERS–Ab (1–6)). The Raman spectra acquired from three different concentrations of reporter tagged Au-NPs are plotted in Fig. 8a(2–4). The Raman spectrum (1) from the reporter showed characteristic peaks at 1569 ± 3 cm−1 due to ring stretching modes, 1334 ± 2 cm−1 due to nitro group symmetric modes, C–H bending modes at 1105 ± 5 cm−1 and C–S stretching modes at 1077 ± 3 cm−1 (ref. 49 and 50) as shown in Fig. 8a.However, the Raman spectra (2–4 in Fig. 8a) collected from the different concentrations of reporter tagged Au-NPs showed a slight shift in Raman peak positions with an increase in the intensity and width of all peaks, which was independent of the reporter concentration. The above-mentioned Raman modes appeared at 1566 ± 1, 1323 ± 1, 1106 ± 1 and 1075 ± 1 cm−1 (2–4 in Fig. 8a). The increase in width was due to increase in size/diameter of Au-NP after coating with the reporter molecule.51 Comparison of Raman spectra of pure reporter with the reporter coated Au-NPs in different reporter concentrations (Fig. 8a(2–4)) showed variations in the intensities of C–H bending modes at 1100–1110 cm−1 and C–S stretching modes at 1075–1080 cm−1. In case of Raman reporter, intensity of C–H peak was more prominent as compared to C–S peak showing a decreased intensity. After coating of Au-NPs with the reporter (Fig. 8a(1–3)), signal from C–S vibrations of reporter was 3–4× enhanced and the intensity of the C–H bending modes (1100–10 cm−1) was decreased. Similar findings were observed for other reporter concentrations coated over Au NP (Fig. 8a(2–4)).
Comparison of Raman signals from all the three samples after reporter coating showed that the signal from sample B (250 μL) was enhanced as compared to sample A (100 μL) and C (500 μL). But considering the shelf life of samples, nanoparticle aggregation was observed in case of samples B and C. The images in the inset of (Fig. S2a–c†) clearly showed particle aggregation in solutions B and C, where their color turned purple while the color of solution A did not change. Thus, it was inferred that there was no or very little particle aggregation in the solution A. The enhanced signal intensity from sample B as compared to A and C could be from the aggregated Au-NPs.
Fig. 8b shows Raman spectra of reporter (1), reporter coated Au-NPs (2) and finally Ab conjugation of reporter coated Au-NPs (3), which showed more or less similar trend as observed in Fig. 8a. There was a shift in Raman reporter peak positions along with variation in Raman peak intensity and width. Fig. 8c shows the SERS plots of Au-NPs conjugated with different concentrations of digoxin Ab (1–6) and were used to determine the limit of detection of the device. All Raman modes were distinctively observed. The sensitivity was clearly observed as Raman signal was still quite appreciable even for 0.1 ng of digoxin.
3.5. Detection of digoxin
QDs and SERS-based immunoassay chips were used to detect different log dilutions of digoxin (0.1 ng to 1 μg), which covered the clinical range (0.8–2.0 ng mL−1) and the PL and Raman integrated intensities are given in (Fig. 9). For SERS data, average integrated intensities of all significant Raman modes were obtained. A linear behavior with correlation coefficient of R2 = 0.92 for QDs and R2 = 0.94 for SERS Au-NPs was obtained. Fig. 9 was also used to determine the limit of detection (LOD) using the formula:The LOD achieved was 0.5 ng mL−1 for QDs based chip and 0.4 ng mL−1 for SERS based chip as shown in Fig. 9 (black squares and black line) and (red circles and red line), respectively.
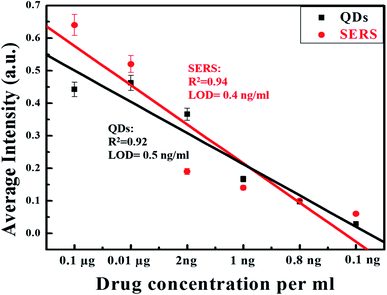 | ||
| Fig. 9 Linear decreasing trend in PL and SERS signal with decreasing concentration of drug with LOD 0.5 ng mL−1 for QDs and 0.4 ng mL−1 for SERS. | ||
Previous studies have reported varied LODs achieved using optical, electrochemical and aptasensor based digoxin detection biosensors. Using AuNPs based surface plasmon resonance. Nikfarjam et al., 2017, reported LOD of 2 ng mL−1, while Ahmadi et al. reported LOD of 0.05 ng mL−1 using electrochemical biosensor. While LOD achieved using various optical and electrochemical aptasensors were 0.01 mg L−1,37 0.05 pM,38 1.85 ng mL−1 (ref. 39) and 1 pM.40
Comparing both the detection strategies, QDs based detection would be preferable as compared to SERS based. There are a lot of limitations associated with SERS based technique as the Raman intensity depends on the distance between the SERS substrate and detection molecule. Lengthy procedures for SERS tag synthesis and biofunctionalization. There is also an issue of background fluorescence while detecting any biomolecule using SERS spectroscopy. Most importantly, the equipment related to SERS based detection is costly involving Raman spectrometer, laser, optics, specific SERS detector.55 While the detection methodology associated with QDs is comparatively cost effective. The detection equipment involves laser, spectrometer that can be installed easily. QDs based detection requires easy biofunctionalization steps and small amount of excitation energy irrespective of the size of the quantum dots.56,57
4 Conclusions
On chip detection using nanoparticles has revolutionized the diagnostic sector. We demonstrated two immunoassay chips detecting different log dilutions of cardiac drug (digoxin) using emission (QDs) and SERS (AuNPs) based techniques. The detection was done employing sandwich ELISA technique. A linearly increasing trend for both immunoassay chips was observed with increasing concentration of drug from 0.1 ng mL−1 to 1 μg mL−1. Comparatively, QDs-based detection is more favorable in microfluidic platform as compared to SERS based as it is easy to develop and implement. Electrochemical analysis of QDs conjugated to digoxin antibody e showed an enhanced charge transfer rate through MAA and Ab affecting the QD luminescence. The current chip offers multiplexing by measuring different concentrations simultaneously and also envisions SERS and QDs based detection setup in health care sector for life threatening diseases.Conflicts of interest
The authors declare that they have no known competing financial interests or personal relationships that could have appeared to influence the work reported in this paper.Acknowledgements
The work was funded by HEC under NRPU grant # 261 and 1770. MC is thankful to HEC for PhD funding and IRSIP visit to MIT. This work made use of the Materials Research Science and Engineering Center (MRSEC) shared experimental facilities at MIT, supported by the National Science Foundation under award number DMR-1419807. We also acknowledge the facilities provided by Laser Biomedical Research Center (LBRC) – a Biotechnology National Resource Center supported by NIH grant 9P41EB015871-28.References
- T. A. Gaziano, A. Bitton, S. Annand and A.-G. A. M. Shafika, Growing Epidemic of Coronary Heart Disease in Low- and Middle- Income Countries, Curr. Probl. Cardiol., 2011, 35(2), 72–115, DOI:10.1016/j.cpcardiol.2009.10.002.Growing
.
- World Health Organization, Cardiovascular diseases, https://www.who.int/health-topics/cardiovascular-diseases Search PubMed.
- World Health Organization. Non-communicable diseases country profiles, Pakistan, 2014. www.who.int/nmh/countries/pak_en.pdf Search PubMed.
- R. Barolia and A. H. Sayani, Risk Factors of Cardiovascular Disease and Its Recommendations in Pakistani Context, J. Pak. Med. Assoc., 2017, 67, 1723–1729 Search PubMed
.
- A. Verma, J. M. Kalman and D. J. Callans, Treatment of Patients With Atrial Fibrillation and Heart Failure With Reduced Ejection Fraction, Circulation, 2017, 135, 1547–1564, DOI:10.1161/circulationaha.116.026054
.
- D. D. McManus, A. Y. Shaikh, F. Abhishek and R. S. Vasan, Atrial Fibrillation and Heart Failure Parallels: Lessons for Atrial Fibrillation Prevention, Crit. Pathw. Cardiol., 2011, 10(1), 46–51, DOI:10.1097/HPC.0b013e31820e1a4b
.
- J. W. M. Cheng and I. Rybak, Use of Digoxin for Heart Failure and Atrial Fibrillation in Elderly Patients, Am. J. Geriatr. Pharmacother., 2010, 8(5), 419–427, DOI:10.1016/j.amjopharm.2010.10.001
.
- E. L. Øiestad, U. Johansen, M. S. Opdal, S. Bergan and A. S. Christophersen, Determination of Digoxin and Digitoxin in Whole Blood, J. Anal. Toxicol., 2009, 33(0403), 372–378 CrossRef PubMed
.
- A. P. Ambrosy, J. Butler, A. Ahmed, M. Vaduganathan and D. J. Van Veldhuisen, The Use of Digoxin in Patients With Worsening Chronic Heart Failure, J. Am. Coll. Cardiol., 2014, 63(18), 1823–1832, DOI:10.1016/j.jacc.2014.01.051
.
- Z. D. Goldberger and A. L. Goldberger, Therapeutic Ranges of Serum Digoxin Concentrations in Patients With Heart Failure, Am. J. Cardiol., 2013, 109(12), 1818–1821, DOI:10.1016/j.amjcard.2012.02.028
.
- J. Kang and M. Lee, Overview of Therapeutic Drug Monitoring, Korean J. Intern. Med., 2009, 24, 1–10, DOI:10.3904/kjim.2009.24.1.1
.
- R. A. Ghiculescu, S. Clinical, P. Registrar and C. Pharmacology, Therapeutic Drug Monitoring: Which Drugs, Why, When and How to Do It, Aust. Prescr., 2008, 31, 42–44 CrossRef
.
- P. Melo, R. Machado and H. M. Teixeira, Analysis of Digoxin and Metildigoxin in Whole Blood Using Solid-Phase Extraction and Liquid Chromatography Tandem Mass Spectrometry, Int. J. Anal. Chem., 2012, 2012, 1–7, DOI:10.1155/2012/975824
.
- S. Li, G. Liu, J. Jia, Y. Miao, S. Gu and P. Miao, Therapeutic Monitoring of Serum Digoxin for Patients with Heart Failure Using a Rapid LC-MS/MS Method, Clin. Biochem., 2010, 43(3), 307–313, DOI:10.1016/j.clinbiochem.2009.09.025
.
- F. Guan, A. Ishii, H. Seno, K. Watanabe-suzuki, T. Kumazawa and O. Suzuki, Identification and Quantification of Cardiac Glycosides in Blood and Urine Samples by HPLC/MS/MS, Anal. Chem., 1999, 71(18), 4034–4043 CrossRef CAS PubMed
.
- A. Dasgupta, Resolving Erroneous Reports in Toxicology and Therapeutic Drug Monitoring, John Wiley & Sons, Hoboken, 2012 Search PubMed
.
- J. Goswami, Chromatography Different Separation or Experimental Techniques for Clinical Chromatography: Small Review, J. Chromatogr. Sep. Tech., 2015, 6(7), 297, DOI:10.4172/2157-7064.1000297
.
- B. Levine, Principles of Forensic Toxicology, AACC Press, Washington, 2013 Search PubMed
.
- T. J. Campbell and K. M. Williams, Therapeutic Drug Monitoring: Antiarrhythmic Drugs, Br. J. Clin. Pharmacol., 1998, 46, 307–319 CrossRef CAS
.
- A. Dasgupta, Therapeutic Drug Monitoring: Newer Drugs and Biomarkers, Elsevier/Academic Press, Amsterdam, 2012 Search PubMed
.
- N. Miguel, M. Pires, T. Dong, U. Hanke and N. Hoivik, Recent Developments in Optical Detection Technologies in Lab-on-a-Chip Devices for Biosensing Applications, Sensors, 2014, 14, 15458–15479, DOI:10.3390/s140815458
.
- J. He, D. Wang and S. Fan, Opto-Microfluidic Immunosensors: From Colorimetric to Plasmonic, Micromachines, 2016, 7(29), 1–18, DOI:10.3390/mi7020029
.
- T. Tachi, T. Hase, Y. Okamoto, N. Kaji and T. Arima, A Clinical Trial for Therapeutic Drug Monitoring Using Microchip-Based Fluorescence Polarization Immunoassay, Anal. Bioanal. Chem., 2011, 401, 2301–2305, DOI:10.1007/s00216-011-5304-9
.
- L. F. Harris, P. Rainey, T. L. Lindahl and A. J. Killard, Analytical Methods Care Monitoring of Antithrombotics, Anal. Methods, 2016, 8, 6500–6505, 10.1039/c6ay01566b
.
- S. A. Ranamukhaarachchi, C. Padeste, M. Dübner, U. O. Häfeli, B. Stoeber and V. J. Cadarso, Integrated Hollow Microneedle-Optofluidic Biosensor for Therapeutic Drug Monitoring in Sub-Nanoliter Volumes, Sci. Rep., 2016, 6(April), 1–10, DOI:10.1038/srep29075
.
- R. Griss, A. Schena, L. Reymond, L. Patiny, D. Werner, C. E. Tinberg, D. Baker and K. Johnsson, Bioluminescent Sensor Proteins for Point-of-Care Therapeutic Drug Monitoring, Nat. Chem. Biol., 2014, 10(June), 598–603, DOI:10.1038/nchembio.1554
.
- J. Kaur, A. Vergara, M. Rossi, A. M. Gravagnuolo, M. Valadan, F. Corrado, M. Conte, F. Gesuele, P. Giardina and C. Altucci, RSC Adv., 2017, 7, 50166–50175 RSC
.
- J. Kaur, A. M. Gravagnuolo, P. Maddalena, C. Altucci, P. Giardina and F. Gesuele, RSC Adv., 2017, 7, 22400–22408 RSC
.
- B. Della Ventura, M. Iannaccone, R. Funari, M. Pica Ciamarra, C. Altucci, R. Capparelli, S. Roperto and R. Velotta, PLoS One, 2017, 12, e0171754 CrossRef PubMed
.
- V. Giridharan, Y. Yun, P. Hajdu, L. Conforti, B. Collins, Y. Jang and J. Sankar, Microfluidic Platforms for Evaluation of Nanobiomaterials : A Review, J. Nanomater., 2012, 2012, 1–14, DOI:10.1155/2012/789841
.
- A. Ahmadi, H. Shirazi, N. Pourbagher, A. Akbarzadeh and K. Omidfar, An Electrochemical Immunosensor for Digoxin Using Core–Shell Gold Coated Magnetic Nanoparticles as Labels, Mol. Biol. Rep., 2014, 41, 1659–1668, DOI:10.1007/s11033-013-3014-4
.
- J. Kawadkar, M. K. Chauhan and M. Maharana, Nanobiotechnology: Application of Nanotechnology in Diagnosis, Drug Discovery and Drug Development, Asian J. Pharm. Clin. Res., 2011, 4(1), 23–38 CAS
.
- K. K. Jain, Applications of Nanobiotechnology in Clinical Diagnostics, Clin. Chem., 2009, 2009(2007), 2002–2009, DOI:10.1373/clinchem.2007.090795
.
- M. H. Mashhadizadeh, N. Naseri and M. A. Mehrgardi, Digoxin Electrochemical Aptasensor Using Ag Nanoparticles Decorated Graphene Oxide, Anal. Methods, 2016, 8, 7247–7253, 10.1039/c6ay02474b
.
- G. F. Bellia, H. Corrall, M. G. Baron and R. Croxton, An Investigation of Digoxin by Cyclic Voltammetry Using Gold and Silver Solid Electrodes and Chemometric Analysis, Int. J. Electrochem. Sci., 2017, 12, 3050–3062, DOI:10.20964/2017.04.60
.
- A. Ahmadi, H. Shirazi, N. Pourbagher, A. Akbarzadeh and K. Omidfar, An electrochemical immunosensor for digoxin using core-shell gold coated magnetic nanoparticles as labels, Mol. Biol. Rep., 2014 Mar, 41(3), 1659–1668 Search PubMed
.
- H. Bagheri, R. Talemi and A. Afkhami, Gold nanoparticles deposited
on fluorine-doped tin oxide surface as an effective platform for fabricating a highly sensitive and specific digoxin aptasensor, RSC Adv., 2015, 5(72), 58491–58498 RSC
.
- M. H. Mashhadizadeh, A. Azhdeh and N. Naseri, 3-Mercapto propionic acid self-assembled on gold nano-particles applied for modification of screen-printed electrode as a new digoxin electrochemical aptasensor using graphene oxide-based signal-on strategy, J. Electroanal. Chem., 2017, 787, 132–138 CrossRef CAS
.
- A. S. Emrani, S. M. Taghdisi, N. M. Danesh, S. H. Jalalian, M. Ramezani and K. Abnous, Anal. Methods, 2015, 7, 3814–3818 RSC
.
- M. H. Mashhadizadeh, N. Naseri and M. A. Mehrgardi, A digoxin electrochemical aptasensor using Ag nanoparticle decorated graphene oxide, Anal. Methods, 2016, 8(39), 7247–7253 RSC
.
- P. F. J. S. D. C. Pérez-conde and G. Paniagua, Permanently Oriented Antibody Immobilization for Digoxin Determination with a Flow-through Fluoroimmunosensor, Anal. Bioanal. Chem., 2003, 375, 1020–1023, DOI:10.1007/s00216-002-1746-4
.
- S. Grant, F. Davis, J. A. Pritchard, K. A. Law, S. P. J. Higson and T. D. Gibson, Labeless and Reversible Immunosensor Assay Based upon an Electrochemical Current-Transient Protocol, Anal. Chim. Acta, 2003, 495, 21–32, DOI:10.1016/j.aca.2003.08.026
.
- A. Nikfarjam, A. H. Rezayan, G. Mohammadkhani and J. Mohammadnejad, Label-Free Detection of Digoxin Using Localized Surface Plasmon Resonance-Based Nanobiosensor, Plasmonics, 2016, 12, 157–164 CrossRef
.
- A. C. Barton, S. D. Collyer, F. Davis, G. Garifallou, G. Tsekenis, E. Tully, R. O. Kennedy, T. Gibson, P. A. Millner and S. P. J. Higson, Biosensors and Bioelectronics Labeless AC Impedimetric Antibody-Based Sensors with Pg Ml-1 Sensitivities for Point-of-Care Biomedical Applications, Biosens. Bioelectron., 2009, 24, 1090–1095, DOI:10.1016/j.bios.2008.06.001
.
- P. Held, Application Note, Biotech Instruments, Winooski, VT, 2006 Search PubMed
.
- N. D. Israelsen, C. Hanson and E. Vargis, Nanoparticle Properties and Synthesis Effects on Surface-Enhanced Raman Scattering Enhancement Factor: An Introduction, Sci. World J., 2015, 2015, 1–12 CrossRef PubMed
.
- Y. Wang, B. Yan and L. Chen, SERS Tags: Novel Optical Nanoprobes for Bioanalysis, Chem. Rev., 2012, 113, 1391–1428 CrossRef PubMed
.
- P. Yang, M. Ando and N. Murase, Various Au Nanoparticle Organizations Fabricated through SiO2 Monomer Induced Self-Assembly, Langmuir, 2011, 27(19), 895–901, DOI:10.1021/la103143j
.
- M. Chaudhry, D.-K. Lim, R. Qamar and A. Saleem, The Adverse Role of Excess Negative Ions in Reducing the Photoluminescence from Water Soluble MAA–CdSe/ZnS Quantum Dots in Various Phosphate Buffers, Phys. Chem. Chem. Phys., 2018, 20, 29446–29451, 10.1039/c8cp06213g
.
- K. Zhang, J. Ji, X. Fang, L. Yan and B. Liu, Carbon Nanotube/Gold Nanoparticle Composite-Coated Membrane as a Facile Plasmon-Enhanced Interface for Sensitive SERS Sensing, Analyst, 2014, 140(1), 134–139, 10.1039/c4an01473a
.
- N. Aristov and A. Habekost, Cyclic Voltammetry – A Versatile Electrochemical Method Investigating Electron Transfer Processes, World J. Chem. Educ., 2015, 3(5), 115–119, DOI:10.12691/wjce-3-5-2
.
- H. Wang, Y. Jia, X. Wang, Y. Yao, D. Yue and Y. Jing, Electrochemical Deposition of Magnesium from Analogous Ionic Liquid Based on Dimethylformamide, Electrochim. Acta, 2013, 108, 384–389, DOI:10.1016/j.electacta.2013.07.004
.
- U. Sivasankaran, A. E. Vikraman, D. Thomas and K. G. Kumar, Nanomolar Level Determination of Octyl Gallate in Fats and Oils, Food Anal. Methods, 2016, 9, 2115–2123, DOI:10.1007/s12161-015-0356-7
.
- E. Laviron, General Expression of the Linear Potential Sweep Voltammogram in the Case of Diffusionless Electrochemical Systems, J. Electroanal. Chem. Interfacial Electrochem., 1979, 101, 19–28 CrossRef CAS
.
- K. C. Bantz, A. F. Meyer, N. J. Wittenberg, H. Im, O. Kurtulus, S. H. Lee, N. C. Lindquist, S.-H. Oh and C. L. Haynes, Recent Progress in SERS Biosensing, Phys. Chem. Chem. Phys., 2011, 13(24), 11551–11567, 10.1039/c0cp01841d
.
- T. R. Pisanic, Y. Zhang and T. H. Wang, Quantum Dots in Diagnostics and Detection: Principles and Paradigms, Analyst, 2014, 139, 2968–2981, 10.1039/c4an00294f
.
- R. Funari, B. Della Ventura, L. Schiavo, R. Esposito, C. Altucci and R. Velotta, Anal. Chem., 2013, 85, 6392–6397 CrossRef CAS PubMed
.
Footnote |
| † Electronic supplementary information (ESI) available. See DOI: 10.1039/d1ra07680a |
| This journal is © The Royal Society of Chemistry 2022 |

