 Open Access Article
Multipurpose made colorimetric materials for amines, pH change and metal ion detection†
Lihong Baoac,
Leighton O. Jones b,
Ana M. Garrote Cañasa,
Yunhan Yana,
Christopher M. Paska,
Michaele J. Hardie
 b,
Martin A. Mosquerad,
George C. Schatz
 b and
Natalia N. Sergeeva
 *ae
*ae
aSchool of Chemistry, University of Leeds, LS2 9JT, UK. E-mail: n.sergeeva@leeds.ac.uk
bDepartment of Chemistry, Northwestern University, Evanston, 60208 Illinois, USA
cSchool of Material Design and Engineering, Beijing Institute of Fashion Technology, 100029 Beijing, China
dDepartment of Chemistry and Biochemistry, Montana State University, Bozeman, 59717 Montana, USA
eThe Leeds Institute of Textiles and Colour, University of Leeds, Leeds, LS2 9JT, UK
First published on 20th January 2022
Abstract
Sensors are routinely developed for specific applications, but multipurpose sensors are challenging, due to stability and poor functional design. We report organic materials that operate in solution and gas phase. They show a strong response behaviour to at least three types of environmental changes: pH, amine and metal ion binding/detection. We have confirmed and validated our findings using various analytical and computational methods. We found that the changes in polarity of the solvent and pH not only red shift the tail of the absorption spectra, but also extend the peak optical absorption of these structures by up to 100 nm, with consequential effects on the optical gap and colour changes of the materials. Acid–base response has been studied by spectrophotometric titrations with trifluoroacetic acid (TFA) and triethyl amine (TEA). The experiments show excellent reversibility with greater sensitivity to base than acid for all compounds. Analysis into metal sensing using Zn(II) and Cu(II) ions as analytes show that the materials can successfully bind the cations forming stable complexes. Moreover, a strong suppression of signal with copper gives an operative modality to detect the copper ion as low as 2.5 × 10⁻⁶ M. The formation of the metal complexes was also confirmed by growing crystals using a slow diffusion method; subsequent single crystal X-ray analysis reveals the ratio of ligand to metal to be 2 to 1. To test sensitivity towards various amine vapours, paper-based sensors have been fabricated. The sensors show a detection capability at 1 ppm of amine concentration. We have employed CIE L*a*b* colour space as the evaluation method, this provides numeric comparison of the samples from different series and allows comparison of small colour differences, which are generally undetectable by the human-eye. It shows that the CIE L*a*b* method can assess both sensitivity to a particular class of analytes and a specificity response to individual amines in this subclass offering an inexpensive and versatile methodology.
Introduction
Chemosensors are of paramount importance as they are a key monitoring tool in biology, medicine, environmental, and health & safety applications.1,2 Optical sensors are of particular relevance as they are generally cost-effective and easy to use. They have been developed for many different analytes3 and work in solution and gas phases.4–8 However, many sensing materials work as chemical probes rather than as sensors as the chemical change they undergo is irreversible. Moreover, there is an increasing demand to develop sensing assays based on molecules which can detect more than just one type of analyte.9,10 Of particular interest to human health, environment and food is sensing of heavy metals, amines and pH. Important analytes, for example, copper is the third most abundant element in the human body, and it plays a critical role in our neurological health.11–13 The concentration of copper in the brain is around 0.1 mM.14 However, if accumulated above a certain level, it can become a hazard leading to serious health diseases e.g. Alzheimer's disease and Wilson's disease.15–19 Commonly used methods for the detection of heavy metals include atomic absorption spectroscopy, inductively coupled plasma mass spectrometry, high-performance liquid chromatography (HPLC), and electrochemical methods.2,20–24 Although these techniques are reliable, other factors such as high-cost, time consuming, special sample preparation and trained personnel prompt the development of colorimetric assays.2 Thus, a range of molecular probes based on fluorescence/colorimetric detection have been designed for Cu(II) detection for biological and environmental systems.25–32 However, some drawbacks remain regarding synthesis of these complex structures.Ammonia and organic amines are an important sensing target as they are involved in many industrial chemical processes. Their detrimental contribution towards many environmental33 and health34 issues are well known. Also, as amines have been produced by bacteria as a part of their life-cycle, they can contribute to human health condition35,36 and affect the food quality.37 Typical methods for a gas detection include HPLC and gas chromatography techniques;38–40 however, they are labour and time consuming.41 Therefore, several types of sensing materials based on fluorescent probes, nanofibers, films of ZnS/PTCDA and TiO2/porphyrin with various detection limits and reversibility have been developed.42–51
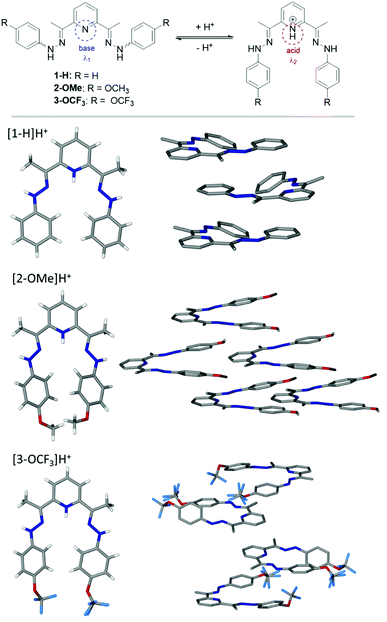
Polydentate hydrazones are conformationally flexible ligands, and their structural features display versatile behaviour in metal coordination. For this study, we have chosen compounds 1–3 as they have several structural advantages (Fig. 1). These compounds are perfectly suited for chemo-sensing applications such as pH probes, due to their donor–bridge–acceptor structural format. The presence of lone pairs at the nitrogen atom can influence different conformations adopted by the molecule. Therefore, the spectral shift, intensity or shape change can be attributed to specific solute–solute and solute–solvent interaction, which can also benefit sensing. There are other factors that make compounds 1–3 interesting examples such as: easy synthesis, good solubility, easy purification, stability, tendency towards crystallinity and a use of cheap precursors. In addition, simple structural modifications allow a tuning of the photophysical properties.
Results and discussion
Protonation, pH response and amine sensing
Compounds 1–3 have been prepared in a high yield (73–93%) as brightly coloured materials starting from the corresponding hydrazine and 2,6-diacetylpyridine in EtOH as reported by us previously.52 The structures shown in Scheme 1 comprise of two electron donating phenyl rings and derivatives thereof (H, OCH3, OCF3), joined to the electron withdrawing pyridyl (Py) unit via methyl substituted hydrazo bridges. Due to their nature, the compounds should behave differently in basic or acidic environments. In a solution, the derivatized arms have a widely separated conformation, possibly exacerbated by the electrostatic forces e.g. van der Waals, steric hindrance of the internal aromatic protons, electronic repulsion of N-lone pairs etc. In acidic environment (pH < 7), the central nitrogen atom of the Py unit can datively bind to free protons, and in such cases, brings the arms together into a closer vicinity to each other in a tweezer like fashion (Fig. 1 (top)). The change in structure is expected to alter the absorption properties.To confirm the protonation site(s), the crystals of 1–3 have been obtained by solvent diffusion method using CHCl3–EtOH–ether solvent system in the presence of HCl or HClO4. Based on crystallographic data, the protonation of nitrogen at the Py-ring occurs for all compounds (Fig. 1 (bottom)). Further analysis of the full crystal packing reveals a possibility of aggregochromism in 2-OMe and 3-OCF3, which can explain bright colours of these compounds in the solid form. It seems that a tweezer-like shape favours a head-to-tail arrangement of the molecules observed for compound 2-OMe, where the ordered array is evident. Such behaviour can be a reason for a bright colour noticed in 2-OMe due to the formation of J-aggregates and a potential enhancement of the optical properties. Such convenient arrangement in 2-OMe gives rise to other interesting feature, namely, polar crystal packing. Similarly, crystal packing of 3-OCF3 shows the molecules are aligned in pairs through the interaction of OCF3-group and NH–NH fragment in a distorted ‘head-to-tail’ fashion.
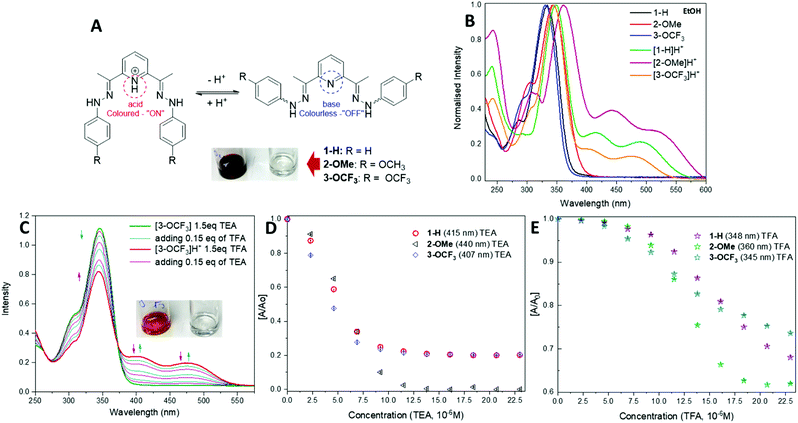
To test their potential as acid–base sensors, spectrophotometric analysis has been carried out (Fig. 2A). UV-vis absorption spectra of 1–3 in EtOH show two bands in the UV region of 304–358 nm with the absorption maxima in the range of 334–355 nm (Fig. 2B). The shape of the absorption spectra for the compounds does not change significantly with solvent polarity. A shift of about 12 nm of the position of the main band is observed for 2-OMe in AcCN and 3-OCF3 in DCM (Table 1).
| λmax EtOH | λmax DCM | λmax AcCN | λmax EtOH (H+) | |
|---|---|---|---|---|
| 1-H | 294, 334 | 302, 344 | 300, 346 | 348, 415, 492 |
| 2-OMe | 304, 344 | 318, 355 | 315, 347 | 309, 361, 440, 517 |
| 3-OCF3 | 293, 331 | 311, 337 | 306, 344 | 307, 345, 407, 481 |
A slight difference with the DCM solvent to that of the EtOH and AcCN, is likely due to its lower dielectric value and slight acidic nature. The spectrum of protonated [1-H]H+ shows a shift to longer wavelength, with a broad shoulder of up to 600 nm and contains two additional low intensity peaks, centred at 415 nm and 492 nm.
The absorption spectra for the other protonated compounds [2-OMe]H+ and [3-OCF3]H+ show similar characteristics to those of the [1-H]H+, except there are differences in intensities of the 250 nm peak (Table 1 and Fig. 2B). The pH response was studied upon addition of trifluoroacetic acid (TFA) (0.15 eq., 0.002 mL of 3.45 × 10⁻³ M) to solutions of compounds 1–3 in ethanol (2.3 × 10⁻⁵ M). The presence of an isosbestic points in the absorption spectra of compounds 1–3, suggests the coexistence of two different species, which is associated with the protonation of the pyridine-nitrogen.
All compounds display a remarkable colour change from colourless to yellow (1-H), burgundy (2-OMe) and orange (3-OCF3) at acidic pH detectable by naked-eye. Fig. 2C shows an example of acid–base behaviour for the 3-OCF3 sample. The reversibility of the protonation process for these compounds has been tested by the reverse titration with triethylamine (TEA) solution (0.15 eq., 0.002 mL of 3.45 × 10⁻³ M) shown in Fig. 2D. This process can be carried out back and forth numerous times (Fig. 2D and E). Based on the data in Fig. 2D and E, the compounds have higher sensitivity towards base than acid, and their response can be detected with 0.15–0.3 eq. analyte added. Moreover, all compounds work on the equimolar scale.
We have also fabricated a paper-based colorimetric naked-eye sensor to test the materials ability to detect various amine vapours. Currently, general design of the amine sensors is based on Schiff base motif, where a change in fluorescence response can be detected.43,46,53,54 In contrast, our method is based on the interactions between amine vapours and the conjugated acids [1-H]H+ of the small molecules 1–3 allowing rapid detection using colorimetric approach. Moreover, the reversibility of these interactions can also be achieved offering inexpensive, sensitive, and rapid analytical technology.
We have tested TEA, ethanolamine (EtA), aniline and ammonia at 1 ppm and 5 ppm concentrations. The materials response selectively to amines but not alcohols. For example, a naked-eye detectable colour change can be observed in the presence of EtA but not in the presence of EtOH or MeOH vapours. Colour characterisation has been carried out using CIE L*a*b* colour space, which is the standard method of numeric colour expression developed by the Commission Internationale de l'Eclairage55 in 1976 and commonly used today.56 The colour of a sample is specified by three coordinates (L*, a* and b*) and can be approximated in 3D-space. L* is lightness that nominally ranges from 0 (black = total absorption) to 100 (diffuse white), a* axis represents green (−ve) to red (+ve) values, and b* axis runs from blue (−ve) to yellow (+ve) values. The indicator stripes were prepared by previously reported methodology.43 Colour measurements were carried out using portable a Datacolor CHECK3 instrument with a standard CIE illuminant D65 (daylight) at 10° observer angle. Prior measurements, the instrument was calibrated against white and black standard plates. The measurements were taken in triplicates and mean is reported.
Since Martinez et al.57 introduced microfluidic paper-based devices in 2007, many studies have been carried out utilising colorimetric methods.58 However, output data strongly depends on readout devices e.g. digital camera, smartphone and their light source. Soda et al. provided a way to treat experimental data consistently, which can allow cross-comparison of various samples, their method is based on utilising RGB model.59 In contrast to RGB and CMYK models, CIE L*a*b* mimics human perception of colour and is designed to record small colour changes, uniformly. Therefore, it can provide an efficient, accurate and reproducible way to compare individual samples.
The L*a*b* data for the three paper sensors before and after being exposed to amine vapours is summarised in Table 2 (for 1 ppm of amine) and in ESI Table S1† (for 5 ppm of amine).
| Control stripes | 1-H a* 8.0 b* 9.96 L* 90.55 | 2-OMe a* 14.64 b* 14.54 L* 76.35 | 3-OCF3 a* 7.58 b* 12.71 L* 89.29 |
|---|---|---|---|
| TEA | a* −0.65 b* 5.37 L* 93.41 | a* 1.53 b* 6.83 L* 90.96 | a* −0.16 b* 1.03 L* 94.45 |
| EtA | a* −0.72 b* 5.10 L* 93.41 | a* −1.45 b* 5.39 L* 92.70 | a* −0.61 b* 1.36 L* 94.08 |
| Aniline | a* −0.86 b* 6.73 L* 93.33 | a* 9.53 b* 11.77 L* 80.20 | a* 2.77 b* 5.50 L* 92.30 |
| NH3 | a* −0.31 b* 8.01 L* 92.73 | a* −0.27 b* 8.35 L* 92.50 | a* −0.81 b* 3.02 L* 94.23 |
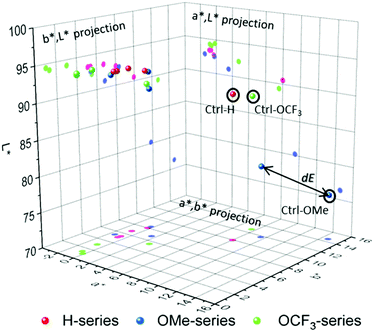
The results show a drastic change in a* and b* values and noticeable change in L* for all samples. Detailed contributions of individual values on overall colour can be visualised through constructing 3-D colour space and the corresponding projections. Colour can be presented as ‘a point’ in 3-D space, and Fig. 3 shows 3-D colour coordinates for all 1 ppm-samples.
The total difference (dE) between any two colours can be treated as the distance between the two ‘points’ as illustrated in Fig. 3, and dE is calculated by the following equation:
| dE = (dL2 + da2 + db2)1/2 |
The total colour differences of the stripes coated with compounds 1–3 before and after the exposure to amine vapours are shown in Table 3. Distinct colour changes are evident for all the samples indicating strong response to amine vapours.
| Series | EtA | TEA | Aniline | NH3 |
|---|---|---|---|---|
| H | 10.38 | 10.20 | 9.83 | 8.81 |
| OMe | 24.70 | 21.09 | 6.97 | 22.84 |
| OCF3 | 14.79 | 14.93 | 9.17 | 13.74 |
The OMe-sensor shows excellent response to amine vapours with a higher sensitivity for TEA, EtA and ammonia followed by OCF3. Both OMe- and OCF3-sensors show lower response to aniline. In contrast, H-sensor shows a strong response (dE = 10) at concentrations with no preferences to the amines. dE is a good parameter to evaluate the response to an analyte, and therefore, the sensitivity; however, it may not be used to evaluate the specificity/selectivity, especially, if the dE value range between several analytes is narrow. A more detailed look at the corresponding projections (a*,b*), (a*,L*) and (b*,L*) can provide information on the specificity towards individual amine vapours. For H-series (red-magenta) and OCF3-series (green), the response to TEA and EtA is very similar revealing low separation between the coordinates, and therefore, specificity, largely due to similarly affected a*-parameter. The total difference dEEtA,TEA between EtA and TEA for H-series and for OCF3-series are 0.28 and 0.67, respectively, which means colour differences between the two samples cannot be detected by naked-eye (dE < 1). In contrast, the response of OMe-sensor to amines is well defined with dEEtA,TEA = 3.74. Interestingly, OMe-sensor shows well separated L*a*b* values for all amines, which makes it a potential candidate in the identification of amine vapours.
Metal ion binding and selectivity
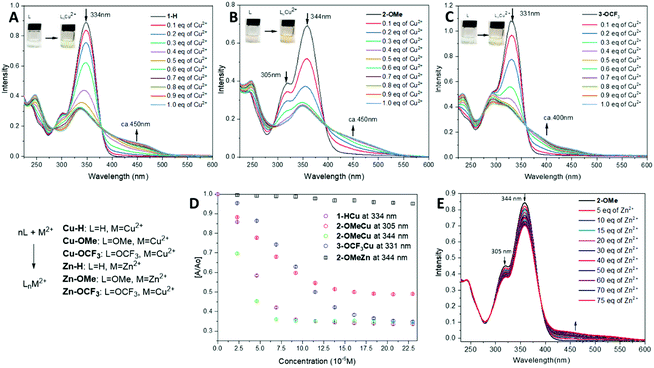
Zinc and copper are the second and the third most abundant metal ions in the human body, after iron(II), playing a crucial role in biological processes. Moreover, zinc(II) is just slightly larger than copper(II) making it a legitimate challenge to test the selectivity and sensitivity of compounds 1–3 as a metal ion sensor.Initial naked-eye tests have revealed a selective colour change for the neutral form of 1–3 with Cu(II) ions; whereas no colour change is observed for Zn(II) ions detection in pH > 7. A series of the spectrophotometric titrations has been carried in the presence of Cu(II) and Zn(II) ions to assess the detection sensitivity of compounds 1–3 (Fig. 4A–C). A decrease of the main peak (ca. 330–340 nm) and the appearance of a new shoulder between 400–500 nm are visible upon the gradual addition of Cu(ClO4)2·6H2O in EtOH/water solution (Fig. 4A–C).
In all cases, an isosbestic point has been observed during the titrations of 1–3 with Cu(II) ions, which confirms the formation of a Cu-complex through the coordination with the hydrazo-N and Py-N atoms. This leads to a drastic colour change, which is also detectable by the naked eye. 2-OMe (344 nm) is highly sensitive towards Cu(II), detecting the concentration of 2.5 × 10⁻⁶ M (0.15 eq.), where the World Health Organization (WHO) states the allowable trash-hold level of copper(II) ions in drinking water to be 1.3 mg per L or 2.05 × 10⁻⁵ M.60 (Fig. 4D) This is closely followed by 1-H and then 3-OCF3. A very slight change in [A/A0] value is observed after 0.5 eq. of Cu(II) is added suggesting formation of a 1![[thin space (1/6-em)]](https://www.rsc.org/images/entities/char_2009.gif) :
:![[thin space (1/6-em)]](https://www.rsc.org/images/entities/char_2009.gif) 2 complex (Fig. 4D).
2 complex (Fig. 4D).
In contrast to Cu-ion sensing, the titration of 1–3 with Zn(II) ions on the equimolar scale does not lead to a substantial change in UV-vis spectra. However, a change is detectable upon the titration of 2-OMe with a solution of Zn(ClO4)2 in EtOH. As shown in Fig. 4E, a decrease in the absorption intensity is observed at 305 nm and 344 nm respectively, similar to the response to Cu-ions, and a new shoulder develops at 470 nm. A presence of a clear isosbestic point suggests the formation of a metal complex. In contrast to this, 1-H and 3-OCF3 do not show drastic changes in the presence of Zn(II) ions (Fig. 4D, in black for 2-OMe at 344 nm), and this has also been confirmed by a naked-eye test.
Crystal structure of compounds 1–3 an their Cu(II) and Zn(II) complexes
To prepare copper and zinc complexes several ligand-to-metal ratios e.g. 1![[thin space (1/6-em)]](https://www.rsc.org/images/entities/char_2009.gif) :
:![[thin space (1/6-em)]](https://www.rsc.org/images/entities/char_2009.gif) 1, 2
1, 2![[thin space (1/6-em)]](https://www.rsc.org/images/entities/char_2009.gif) :
:![[thin space (1/6-em)]](https://www.rsc.org/images/entities/char_2009.gif) 1 and 3
1 and 3![[thin space (1/6-em)]](https://www.rsc.org/images/entities/char_2009.gif) :
:![[thin space (1/6-em)]](https://www.rsc.org/images/entities/char_2009.gif) 2 have been probed. However, the formation of the complexes only with the ligand-to-metal ratio of 2
2 have been probed. However, the formation of the complexes only with the ligand-to-metal ratio of 2![[thin space (1/6-em)]](https://www.rsc.org/images/entities/char_2009.gif) :
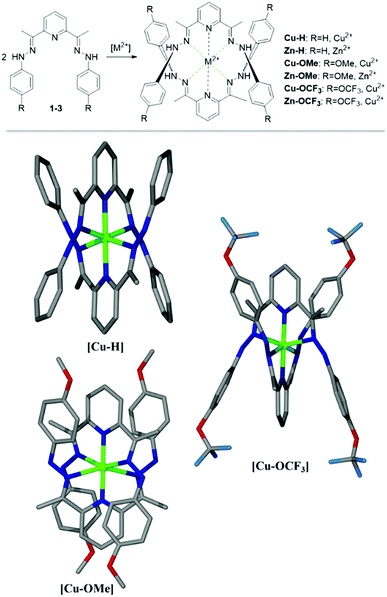
:![[thin space (1/6-em)]](https://www.rsc.org/images/entities/char_2009.gif) 1 have been observed (Fig. 5). These data fit well with the results of ligand–metal interactions detected in the experiments carried out in the solution. The corresponding metal complexes of Cu(II) and Zn(II) have been prepared via a solvent diffusion method and their structures including a ligand–metal ratio have been resolved by X-ray analysis (Fig. 5).
1 have been observed (Fig. 5). These data fit well with the results of ligand–metal interactions detected in the experiments carried out in the solution. The corresponding metal complexes of Cu(II) and Zn(II) have been prepared via a solvent diffusion method and their structures including a ligand–metal ratio have been resolved by X-ray analysis (Fig. 5).
Cu-H crystallised as brown blocks in a monoclinic cell and was solved in the P21 space group, with three cations, six ClO4 counter-ions and one molecule of water in the asymmetric unit. Cu-OCF3 crystallised as brown fragments in a monoclinic cell and was solved in the C2/c space group, with half a cation and two half perchlorate anions in the asymmetric unit. Disorder was observed around both perchlorate anions. Oxygen atoms were modelled at 50% occupancies and Cl–O distances restrained to 1.410(5) Å. Cu-OMe crystallised as brown plates in an orthorhombic cell and was solved in the Fddd space group, with a quarter of a cation and half a perchlorate counter-ion in the asymmetric unit. Some mild disorder was observed at the perchlorate counter-ion, with one oxygen atom being modelled at 50% occupancy and all thermal parameters being restrained.
We have had less success to grow the crystals in the presence of Zn(II) salts; both Zn(ClO4)2 and ZnCl have been tested. This fact correlates well with the results observed in the solution, where a low affinity to Zn(II) ions is observed with 1-H being the least sensitive. Furthermore, the analysis of our structures indicates that average in-plane Zn–N distance (2.32 Å) is only about 1% longer than the corresponding Cu–N distance (2.30 Å). It is known that average in-plane Zn–N distances in organic molecules (porphyrins/phthalocyanines) are 3% longer than ones observed for Cu–N bonds, which is necessary to accommodate slightly bigger Zn atom (compared to a Cu) into organic core.61 This is attributed to the differences in 3d electronic configuration and slightly higher reactivity of Cu comparing to Zn.
Taking this knowledge into account, as well as crystal data obtained for our complexes, it can be concluded that the ZnN6 core is distorted and has just enough space to accommodate a central 3d atom. In turn, the CuN6 core in our complexes has nearly perfect octahedral arrangement indicating no strain on Cu–N bonds. All these facts point out that the formation of Cu complexes with these ligands is more likely (and energetically favourable) than the formation of respective Zn(II) complexes, and also explains the ligand selectivity towards Cu(II) in the solution.
Theory
The frontier molecular orbitals for the ligands are presented in the ESI† (Fig. S13–15). Briefly, the wavefunction that shows the lone pairs responsible for the dative bonding to the metals are not in the HOMOs, but rather in the HOMO-2 for 1-H and 3-OCF3 and HOMO-3 for 2-OMe.The lone pairs have an energy stabilization with respect to the HOMO level in each of the ligands of ΔE = 1.59 eV (1-H), 1.79 eV (2-OMe) and 1.49 eV (3-OCF3). Upon protonation, the wavefunction localizes around the end groups. The spin density difference plots of the three copper complexes are shown in Fig. S16† and reveal the unpaired electron for each sitting in a dz2 like orbital. To further understand the bonding of the complexes, bond order analysis was computed with density functional theory (DFT). Three common formalisms were used, the Mayer, Gopinathan–Jug (G–J) and the first Nalewajski–Mrozek (N–M1).
Fig. 6A shows the bond orders for the dative metal–nitrogen bonds as a function of bond length for the Cu–H and Zn–H complexes. For both complexes, the shortest bonds are those which are axial (Py-M), while the longer bonds are equatorial (hydrazo-metal). These axial bonds exhibit a higher bond order than the equatorial bonds, but these are no higher than ∼0.5 in the G–J formalism, confirming their dative nature. The orders for the equatorial bonds are so low (<0.3) that they are more electrostatic than dative.
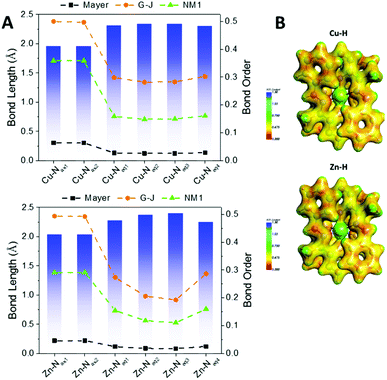 | ||
| Fig. 6 (A) Bond lengths (Å) and bond orders for the metal–N interactions of the complexes Cu–H (top) and Zn–H (bottom); all complexes are presented in the ESI.† For each panel, the bar graph is for the left axis and the dashed lines are for the right axis, according to the three formalisms of Mayer, Gopinathan–Jug (G–J) and first Nalewajski–Mrozek (N–M1). (B) Electrostatic potential energy maps of the Cu–H and Zn–H complexes; all complexes are presented in the ESI (Fig. S19†). | ||
Fig. 6B illustrates the electrostatic potential maps of the two complexes. There is electron density connecting the atoms across the axial bonds but not between the equatorial bonds, confirming the bond order analysis. The bond orders and potential maps for all complexes are presented in Fig. S17 and S18,† respectively.
The UV-vis spectra were computed with TDDFT (see Methods section for details), as shown in Fig. 7 for selected structures: the 1-H ligand (top), the [1-H]H+ protonated species (middle) and the Cu–H complex (bottom); all others are presented in the ESI, Fig. S22–S29.†
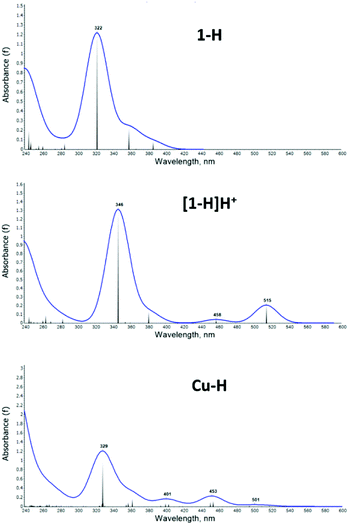 | ||
| Fig. 7 Calculated UV-vis absorption spectrum for the compounds 1-H (top), [1-H]H+ (middle) and Cu–H (bottom). | ||
In correlation with experiment, the computed 1-H spectrum shows a main peak of absorption at 322 nm and no significant absorption at longer wavelength. [1-H]H+ shows the main peak and two smaller peaks at 458 nm and 515 nm, which are in reasonable agreement with the experimentally observed shoulders in this region. Note that in the TDDFT spectra the 450 peak shows lower intensity than the ones >500 nm, which is opposite to experiment: due to the over pronouncement of the dipole in the first excited state from DFT functionals. The Cu–H spectrum shows lower intensity overall and better qualitative agreement with experiment.
Experimental
Materials and methods
The chemicals have been purchased from Sigma and used without further purification. Amines and solvents for photophysical studies have been of analytical grade. In all cases, a concentration of 2.3 × 10⁻⁵ M of the compounds 1–3 in a solvent (DCM, AcCN, EtOH) has been prepared to record UV-vis spectra. Spectrophotometric measurements were performed on a dual beam Varian Cary 100 UV-vis spectrophotometer (Agilent Technologies), equipped with a xenon pulse lamp. L*a*b* data was acquired by Datacolor CHECK 3 portable spectrophotometer using D65 (sunlight) light source.Conclusions
To conclude, the compounds 1–3 show a strong potential to act as multi-responsive sensing scaffolds to a variety of analytes such as pH, amines and metal ions. The compounds can detect analytes at the micro-litre concentration. A detailed correlation between the structural features of 1–3 and their optical properties, which is provided by computational and experimental methods, highlights that the signal recognition motif, in response to pH, is localised on the pyridine unit. This shows a strong alignment with the experimental data as the protonation of Py-N is also confirmed by X-ray analysis. The reversibility of the protonation process is successfully demonstrated by TFA/TEA model. This led to a fabrication of paper-based sensor to test a presence of amines in the gas phase with a detection limit of 1 ppm. Despite an apparent similarity in ion size and the chemical properties of Cu(II) and Zn(II) ions, compounds 1–3 are highly selective towards Cu(II), showing a strong response at 2.5 × 10⁻⁶ M of the analyte. In addition, the colour changes can be clearly seen by the naked eye providing a convenient and reliable sensing strategy for pH, amines and Cu(II) ions detection in a wide range of applications.Conflicts of interest
There are no conflicts to declare.Acknowledgements
LB and NS were in part supported by the State Scholarship Fund of China Scholarship Council. NS and AMGC acknowledge support from the Clothworker's Foundation. LOJ and GCS acknowledge support from the CSSM centre co-hosted at Northwestern University, sponsored by the National Science Foundation, under grant CHE-1925708; MAM acknowledges support from the Department of Energy, grant DE-AC02-06CH11357. This research was also supported in part through the computational resources and staff contributions provided for the Quest high performance computing facility at Northwestern University which is jointly supported by the Office of the Provost, the Office for Research, and Northwestern University Information Technology.Notes and references
- F. G. Bănică, Chemical Sensors and Biosensors: Fundamentals and Applications, John Wiley and Sons, Chichester, UK, 2012 Search PubMed.
- I. I. Ebralidze, N. O. Laschuk, J. Poisson and O. V. Zenkina, in Nanomaterials Design for Sensing Applications, ed. O. V. Zenkina, Elsevier, 2019, ch. 1, pp. 1–39 Search PubMed.
- J. Wu, B. Kwon, W. Liu, E. V. Anslyn, P. Wang and J. S. Kim, Chem. Rev., 2015, 115, 7893–7943 CrossRef CAS PubMed.
- S. M. Borisov and O. S. Wolfbeis, Chem. Rev., 2008, 108, 423–461 CrossRef CAS PubMed.
- K. L. Diehl and E. V. Anslyn, Chem. Soc. Rev., 2013, 42, 8596–8611 RSC.
- L. You, D. Zha and E. V. Anslyn, Chem. Rev., 2015, 115, 7840–7892 CrossRef CAS PubMed.
- T. Nakamoto and H. Ishida, Chem. Rev., 2008, 108, 680–704 CrossRef CAS PubMed.
- V. S. A. Piriya, P. Joseph, S. C. G. K. Daniel, S. Lakshmanan, T. Kinoshita and S. Muthusamy, Mater. Sci. Eng., C, 2017, 78, 1231–1245 CrossRef PubMed.
- K. Arimitsu and R. Endo, Chem. Mater., 2013, 25, 4461–4463 CrossRef CAS.
- Y. Kamiya and H. Asanuma, Acc. Chem. Res., 2014, 47, 1663–1672 CrossRef CAS PubMed.
- E. Gaggelli, H. Kozlowski, D. Valensin and G. Valensin, Chem. Rev., 2006, 106, 1995–2044 CrossRef CAS PubMed.
- K. H. Falchuk, Mol. Cell. Biochem., 1998, 188, 41–48 CrossRef CAS PubMed.
- C. J. Frederickson and A. I. Bush, BioMetals, 2001, 14, 353–366 CrossRef CAS PubMed.
- J. Stöckel, J. Safar, A. C. Wallace, F. E. Cohen and S. B. Prusiner, Biochemistry, 1998, 37, 7185–7193 CrossRef PubMed.
- E. L. Que, D. W. Domaille and C. J. Chang, Chem. Rev., 2008, 108, 1517–1549 CrossRef CAS PubMed.
- D. Strausak, J. F. B. Mercer, H. H. Dieter, W. Stremmel and G. Multhaup, Brain Res. Bull., 2001, 55, 175–185 CrossRef CAS.
- P. G. Georgopoulos, A. Roy, M. J. Yonone-Lioy, R. E. Opiekun and P. J. Lioy, J. Toxicol. Environ. Health, Part B, 2001, 4, 341–394 CAS.
- D. C. Kennedy, R. K. Lyn and J. P. Pezacki, J. Am. Chem. Soc., 2009, 131, 2444–2445 CrossRef CAS PubMed.
- S. G. Kaler, Nat. Rev. Neurol., 2011, 7, 15–29 CrossRef CAS PubMed.
- J. S. Becker, A. Matusch, C. Depboylu, J. Dobrowolska and M. V. Zoriy, Anal. Chem., 2007, 79, 6074–6080 CrossRef CAS PubMed.
- I. Gaubeur, M. A. Aguirre, N. Kovachev, M. Hidalgo and A. Canals, Microchem. J., 2015, 121, 219–226 CrossRef CAS.
- J. Giersz, M. Bartosiak and K. Jankowski, Talanta, 2017, 167, 279–285 CrossRef CAS PubMed.
- X. Shao, H. Gu, Z. Wang, X. Chai, Y. Tian and G. Shi, Anal. Chem., 2013, 85, 418–425 CrossRef CAS PubMed.
- G. Özzeybek, S. Erarpat, D. S. Chormey, M. Fırat, Ç. Büyükpınar, F. Turak and S. Bakırdere, Microchem. J., 2017, 132, 406–410 CrossRef.
- Y. Ding, Y. Tang, W. Zhu and Y. Xie, Chem. Soc. Rev., 2015, 44, 1101–1112 RSC.
- V. Dujols, F. Ford and A. W. Czarnik, J. Am. Chem. Soc., 1997, 119, 7386–7387 CrossRef CAS.
- H. N. Kim, M. H. Lee, H. J. Kim, J. S. Kim and J. Yoon, Chem. Soc. Rev., 2008, 37, 1465–1472 RSC.
- L. Yuan, W. Lin, B. Chen and Y. Xie, Org. Lett., 2012, 14, 432–435 CrossRef CAS.
- J. Nandre, S. Patil, P. Patil, S. Sahoo, C. Redshaw, P. Mahulikar and U. Patil, J. Fluoresc., 2014, 24, 1563–1570 CrossRef CAS PubMed.
- K. B. Kim, H. Kim, E. J. Song, S. Kim, I. Noh and C. Kim, Dalton Trans., 2013, 42, 16569–16577 RSC.
- Z. Guo, T. Hu, X. Wang, T. Sun, T. Li and Q. Niu, J. Photochem. Photobiol., A, 2019, 371, 50–58 CrossRef CAS.
- S. Lee, G. Barin, C. M. Ackerman, A. Muchenditsi, J. Xu, J. A. Reimer, S. Lutsenko, J. R. Long and C. J. Chang, J. Am. Chem. Soc., 2016, 138, 760–7609 Search PubMed.
- J. W. Erisman, R. Otjes, A. Hensen, P. Jongejan, P. v. d. Bulk, A. Khlystov, H. Möls and S. Slanina, Atmos. Environ., 2001, 1913–1922 CrossRef CAS.
- G. Preti, J. N. Labows, J. G. Kostelc, S. Aldinger and R. Daniele, J. Chromatogr. B: Biomed. Sci. Appl., 1988, 432, 1–11 CrossRef CAS.
- W. Ament, J. R. Huizenga, E. Kort, T. W. van der Mark, R. G. Grevink and G. J. Verkerke, Int. J. Sports Med., 1999, 20, 71–77 CrossRef CAS PubMed.
- D. J. Kearney, T. Hubbard and D. Putnam, Dig. Dis. Sci., 2002, 47, 2523–2530 CrossRef CAS PubMed.
- M. H. S. Santos, Int. J. Food Microbiol., 1996, 29, 213–231 CrossRef CAS.
- M. Plaza, S. Santoyo, L. Jaime, R. G. García-Blairsy, M. Herrero, F. J. Señoráns and E. Ibáñez, J. Pharm. Biomed. Anal., 2010, 51, 450–455 CrossRef CAS PubMed.
- F. A. Tomás-Barberán, M. I. Gil, P. Cremin, A. L. Waterhouse, B. Hess-Pierce and A. A. Kader, J. Agric. Food Chem., 2001, 49, 4748–4760 CrossRef PubMed.
- D. L. Ashley, M. A. Bonin, F. L. Cardinali, J. M. McCraw, J. S. Holler, L. L. Needham and D. G. Patterson, Anal. Chem., 1992, 64, 1021–1029 CrossRef CAS PubMed.
- X. Zhou, S. Lee, Z. Xu and J. Yoon, Chem. Rev., 2015, 115, 7944–8000 CrossRef CAS PubMed.
- X. Liu, X. Zhang, R. Lu, P. Xue, D. Xu and H. Zhou, J. Mater. Chem., 2011, 22, 1167–1172 Search PubMed.
- Z. Jiao, Y. Zhang, W. Xu, X. Zhang, H. Jiang, P. Wu, Y. Fu, Q. He, H. Cao and J. Cheng, ACS Sens., 2017, 2, 687–694 CrossRef CAS PubMed.
- K. Wang, H. Yang, X. Qian, Z. Xue, Y. Li, H. Liu and Y. Li, Dalton Trans., 2014, 43, 11542–11547 RSC.
- B.-P. Jiang, D.-S. Guo and Y. Liu, J. Org. Chem., 2011, 76, 6101–6107 CrossRef CAS PubMed.
- X. Zhang, X. Liu, R. Lu, H. Zhang and P. Gong, J. Mater. Chem., 2011, 22, 1167–1172 RSC.
- J. Kumpf, J. Freudenberg, S. T. Schwaebel and U. H. F. Bunz, Macromolecules, 2014, 47, 2569–2573 CrossRef CAS.
- L. Feng, C. J. Musto and K. S. Suslick, J. Am. Chem. Soc., 2010, 132, 4046–4047 CrossRef CAS PubMed.
- Y. Gu and J. Huang, Colloids Surf., A, 2013, 433, 166–172 CrossRef CAS.
- T. Soga, Y. Jimbo, K. Suzuki and D. Citterio, Anal. Chem., 2013, 85, 8973–8978 CrossRef CAS PubMed.
- Y. Liao, C. Zhang, Y. Zhang, V. Strong, J. Tang, X.-G. Li, K. Kalantar-zadeh, E. M. V. Hoek, K. L. Wang and R. B. Kaner, Nano Lett., 2011, 11, 954–959 CrossRef CAS PubMed.
- A. M. G. Cañas, N. Martsinovich and N. N. Sergeeva, ChemistrySelect, 2017, 2, 2433–2438 CrossRef.
- Y. Fu, Y. Gao, L. Chen, Q. He, D. Zhu, H. Cao and J. Cheng, RSC Adv., 2014, 4, 46631–46634 RSC.
- Y. Fu, J. Yao, W. Xu, T. Fan, Q. He, D. Zhu, H. Cao and J. Cheng, Polym. Chem., 2015, 6, 2179–2182 RSC.
- CIE, I. C. o. I. C. i. de and l. E. I. Beleuchtungskommission.
- A. R. Robertson, Color Res. Appl., 1977, 2, 7–11 CrossRef.
- A. W. Martinez, S. T. Phillips, M. J. Butte and G. M. Whitesides, Angew. Chem., Int. Ed., 2007, 46, 1318–1320 CrossRef CAS PubMed.
- A. Nilghaz, L. Guan, W. Tan and W. Shen, ACS Sens., 2016, 1(12), 1382–1393 CrossRef CAS.
- Y. Soda and E. Bakker, ACS Sens., 2019, 4(12), 3093–3101 CrossRef CAS PubMed.
- B.-C. Yin, B.-C. Ye, W. Tan, H. Wang and C.-C. Xie, J. Am. Chem. Soc., 2009, 131, 14624–14625 CrossRef CAS PubMed.
- A. G. Orpen, L. Brammer, F. H. Allen, D. G. Watson and R. Taylor, Typical interatomic distances: organometallic compounds and coordination complexes of the d- and f-block metals, International Tables for Crystallography Volume C: Mathematical, physical and chemical tables, International Tables for Crystallography, SpringerLink, Springer, Dordrecht, 2006 Search PubMed.
- G. M. Sheldrick, Acta Crystallogr., Sect. C: Struct. Chem., 2015, A71, 3–8 Search PubMed.
Footnote |
| † Electronic supplementary information (ESI) available. CCDC 2086265–2086272. For ESI and crystallographic data in CIF or other electronic format see DOI: 10.1039/d1ra07811a |
| This journal is © The Royal Society of Chemistry 2022 |

