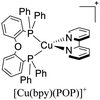
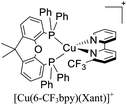
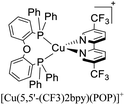
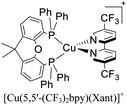
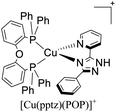
 Open Access Article
Thermally activated delayed fluorescence in luminescent cationic copper(I) complexes
Christian Sandoval-Pauker ab,
Mireya Santander-Nelli
 cd and
Paulina Dreyse
 *b
*b
aDepartment of Chemistry and Biochemistry, University of Texas at El Paso, El Paso, TX 79968, USA
bDepartamento de Química, Universidad Técnica Federico Santa María, Av. España 1680, Casilla 2390123, Valparaíso, Chile. E-mail: paulina.dreyse@usm.cl
cAdvanced Integrated Technologies (AINTECH), Chorrillo Uno, Parcela 21, Lampa, Santiago, Chile
dCentro Integrativo de Biología y Química Aplicada (CIBQA), Universidad Bernardo O'Higgins, General Gana 1702, Santiago 8370854, Chile
First published on 6th April 2022
Abstract
In this work, the photophysical characteristics of [Cu(N^N)2]+ and [Cu(N^N)(P^P)]+ complexes were described. The concept of thermally activated delayed fluorescence (TADF) and its development throughout the years was also explained. The importance of ΔE(S1–T1) and spin-orbital coupling (SOC) values on the TADF behavior of [Cu(N^N)2]+ and [Cu(N^N)(P^P)]+ complexes is discussed. Examples of ΔE(S1–T1) values reported in the literature were collected and some trends were proposed (e.g. the effect of the substituents at the 2,9 positions of the phenanthroline ligand). Besides, the techniques (or calculation methods) used for determining ΔE(S1–T1) values were described. The effect of SOC in TADF was also discussed, and examples of the determination of SOC values by DFT and TD-DFT calculations are provided. The last chapter covers the applications of [Cu(N^N)2]+ and [Cu(N^N)(P^P)]+ TADF complexes and the challenges that are still needed to be addressed to ensure the industrial applications of these compounds.
1. Introduction
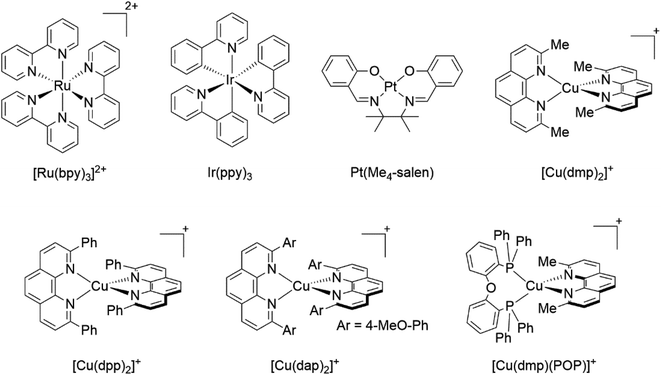
The photophysical and photochemical processes of transition metal complexes have been thoroughly studied for almost a century.1,2 This research has been triggered by the potential of some organometallic and coordination compounds with remarkable photophysical and photochemical properties, which can be explored in several areas such as energy storage,3,4 dye-sensitized solar cells,5–7 light-emitting diodes,8,9 chemical sensing,10,11 photodynamic therapy,12,13 organic synthesis,2,14,15 among others.In this sense, the luminescent coordination complexes based on precious metals such as Ru(II), Ir(III) and Pt(II) (see examples in Fig. 1) have been the center of numerous studies, due to their outstanding properties such as long-lived excited states, absorption in the visible region, strong luminescence, reversible electrochemical behavior, facile preparation, among others.16,17 Besides, their photophysical and photochemical properties can be judiciously tuned by ligand or substituent modification.1 Nevertheless, the scarcity and cost of these precious metals greatly limit their commercial use (the abundances of Ru, Ir and Pt in the earth crust are 0.1, 0.05 and 0.4 ppb, respectively).18,19 In this context, cheaper and more abundant first-row transition metal complexes (i.e. Cu, Co, Zn and Cr) have come into the limelight as viable alternatives to Pt, Ir and Ru complexes.20,21 In particular, Cu(I) complexes show suitable photophysical and photochemical properties for various applications such as light-emitting devices,16,19,22 dye-sensitized solar cells,23,24 water splitting,25,26 photoredox catalysis,27–29 polymerization,30,31 among others.
Although there is a plethora of luminescent Cu(I) complexes (i.e., di/tri/tetracoordinated complexes and multinuclear complexes),32 this work will focus primarily on cationic tetracoordinate homoleptic Cu(I) complexes represented as [Cu(N^N)2]+ (e.g. [Cu(dmp)2]+; dmp = 2,9-dimethyl-1,10-phenanthroline) and the heteroleptic Cu(I) complexes represented as [Cu(N^N)(P^P)]+ (e.g. [Cu(dmp)(POP)]+; POP = bis[2-(diphenylphosphino)phenyl]ether) where N^N is a diimine ligand and P^P a diphosphine ligand.
During the 1970s, McMillin and co-workers showed the first studies about the photophysics of homoleptic Cu(I) complexes derived from bis(phenanthroline), using for example: [Cu(dmp)2]+, [Cu(dpp)2]+ (dpp = 2,9-diphenyl-1,10-phenanthroline), [Cu(dap)2]+ (dap = 2,9-bis(4-methoxyphenyl)-1,10-phenanthroline), among others (see Fig. 1).33–35 There, they studied the relationship between the geometry and substitution patterns; in particular, the effect of the different substituents at the 2,9 positions of the phenanthroline on the photophysical properties of these complexes. These complexes are still the subject of research in current reports in order to rationalize their absorption and emission properties and to overcome certain drawbacks associated with the structural relaxation and exciplex quenching in the excited state (see below).36
In the ground state, Cu(I) complexes have a d10 electronic configuration with a favored pseudo tetrahedral geometry. This closed-shell arrangement prevents the population of the d–d metal-centered states, which particularly makes these complexes promising alternatives to traditional luminescent complexes.21 Commonly, [Cu(N^N)2]+ and [Cu(N^N)(P^P)]+ complexes display ligand centered (LC) transitions in the UV region together with metal-to-ligand charge transfer (MLCT) absorptions in the visible regin.21,36 Due to the MLCT involves the electron transition from metal-centered orbitals to a π* ligand-centered orbital, this process could be described as the oxidation of the metal (Cu+ → Cu2+) and reduction of the ligand (N^N → N^N−).16 In this electronic distribution, the asymmetric population of electrons in the excited state coupled with the preference of Cu(II) ions to espouse a square planar geometry leads to a pseudo Jahn–Teller geometric distortion (see Section 2). This distortion of the geometry (namely flattening distortion) opens the gate for non-radiative processes which subsequently decreases the overall luminescent quantum yield.37 It is likely that due to these limitations Pt, Ru and Ir complexes are still the most popular in various photophysical applications.37
Some strategies have been developed to prevent the excited state flattening distortion such as the functionalization of N^N moieties including bulky alkyl or aromatic groups (i.e. [Cu(dmp)2]+, [Cu(dpp)2]+, etc).19 Another strategy is the introduction of diphosphine ligands yielding a new class of Cu(I) complexes of the type [Cu(N^N)(P^P)]+ (i.e. [Cu(dmp)(POP)]+; Fig. 1) with improved photophysical properties.38 The chelating phosphines (e.g. POP) are able to stabilize the pseudo tetrahedral and destabilize the pseudo square planar environment around the copper center, thus preventing the flattening distortion.36
In the last years, several studies have pinpointed luminescent Cu(I) complexes as promising emitting materials for light-emitting devices.19,22,32,39,40 Back in the 1970s and 1980s, McMillin and coworkers noted that the emission maxima of [Cu(N^N)2]+ complexes was redshifted and the emission intensities lowered when the temperature was decreased.41 This unusual temperature dependence was attributed to luminescence from two thermally equilibrated excited states with a separation of 1800 cm−1. The lower one was ascribed to a 3MLCT (radiative constant (kr) = 103 s−1) while the upper one to a 1MLCT. The population of the latter requires thermal energy, and it has a high kr (107 s−1). Interestingly, this effect was also observed for [Cu(N^N)(PPh3)2]+ complexes.41 Nowadays, this phenomenon is known as thermally activated delayed fluorescence (TADF). This concept is known since 1912 when Perrin proposed it as the thermal activation of a “dark” state to a singlet excited state. In the 1940s, this “dark” state was reasoned to be a triplet excited state.42
TADF emitters constitute interesting alternatives to traditional phosphorescent emitters (or triplet emitters) generally based on precious and expensive metals (Pd, Ru, Ir, etc).40 Phosphorescent emitters exhibit strong spin–orbit coupling (SOC) which leads to a fast intersystem crossing (ISC) from the lowest singlet excited state to the triplet state, thus being able to harvest both singlet and triplet excitons in an electroluminescent device.22,43 TADF emitters (also denoted as singlet harvesting materials), in contrast, display reverse ISC from the triplet state to the singlet state activated by thermal energy (temperature) showing a delayed fluorescence (generally room temperature is enough) with significantly shorter radiative emission decay than their respective phosphorescence from the triplet excited state (since S1 → S0 transition is spin-allowed). In this way, both singlet and triplet excitons can be harvested.22,39,44
TADF has been observed for various types of compounds such as eosin dyes, fullerenes, porphyrins, organometallic complexes, polymers, among others.32 In particular, several reports of Cu(I) TADF emitters are available in the literature showcasing their versatility in various applications.19,29,45–47 This work aims to specifically review the TADF properties of cationic tetracoordinate mononuclear Cu(I) complexes. Their photophysical properties will be explained in detail. Moreover, the parameters that determine their TADF properties will be depicted. Finally, the principal applications of these complexes and the challenges that are still needed to overcome for their research and industrial application are mentioned.
2. Photophysics of luminescent Cu(I) complexes
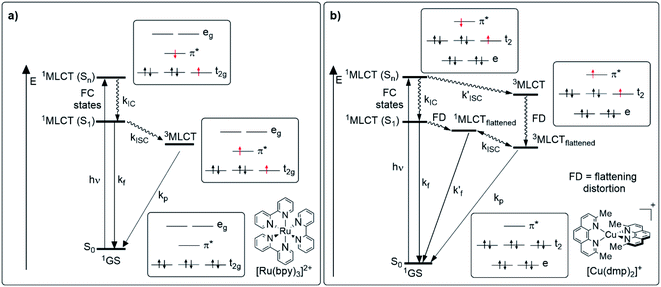
To understand the photophysical aspects of Cu(I) complexes, it is worth mentioning first the photophysical characteristics of classical phosphorescent emitters briefly such as [Ru(bpy)3]2+ (bpy = 2,2′-bipyridine) or [Ir(ppy)2(bpy)]+ (ppy = 2-phenylpyridine) and their differences with Cu(I) complexes. Fig. 2 shows a comparison of the relevant photophysical processes that occur after photon absorption for luminescent octahedral Ru(II) (4d6) or Ir(III) (5d6) complexes (Fig. 2a) and for [Cu(N^N)2]+ complexes (Fig. 2b). In the case of traditional complexes (i.e. [Ru(bpy)3]2+), the excitation of one electron of the metal-centered t2g set of orbitals to a high-lying ligand-centered π* orbital (MLCT), induced by light, populates a singlet 1MLCT (Sn) state which rapidly undergoes internal conversion (IC) and intersystem crossing (ISC), thus populating a low-lying triplet 3MLCT state, with a lifetime in the nanosecond to microsecond range.48,49 This 3MLCT can deactivate in several ways (as detailed in Section 3) including the radiative decay (phosphorescence). Indeed, these phosphorescent compounds are also called triplet emitters.50For Cu(I) complexes a similar picture after the light absorption and the promotion of an electron from the metal-centered t2 set of orbitals to the ligand-centered π* orbital (population of a high-lying 1MLCT state) could be expected, however, a completely different scenario arises due to a pseudo-Jahn–Teller distortion (namely flattening distortion, FD).37 The 1MLCT state can be formally described as an oxidized Cu(II) metal center and a reduced ligand. The fact that a d9 electronic configuration prefers a square planar structure induces the geometric distortion to a more flattened structure and activates other non-radiative decay pathways (e.g. formation of exciplexes with solvent molecules) which dramatically reduces the luminescence quantum yields.16 As a result of this geometric change, two competing decay pathways occur. In the first path, the 1MLCT (Sn) state undergoes IC (of the order of 10−12 s)19 to the lowest energy 1MLCT state (S1). Flattening distortion of the S1 state leads to a transient 1MLCTflattened which subsequently could undergo ISC to the lowest 3MLCTflattened state (approximately between 3 and 30 ps depending on the ligand environment).19 The distortion of the geometry in the 1MLCTflattened state coupled with the fact that the 1MLCTflattened species is stabilized in energy with respect to the lowest 1MLCT state increase the probability of non-radiative decay pathways. In addition, the geometry distortion induces a lower SOC, thus the 1MLCTflattened → 3MLCTflattened transition becomes slower.21,36 In the other pathway, the absence of geometric distortion in the 1MLCT (Sn) state allows larger SOC improving the ISC to a 3MLCT state. The 3MLCT state would then undergo flattening distortion to the 3MLCTflattened species.36,51 Besides, as mentioned before, the flattened structure of the MLCT states leaves the copper center accessible for the coordination of nucleophiles such as the solvent molecules or the counterions to form exciplexes which are non-luminescent.21
The introduction of bulky substituents in the diimine ligands, for instance, in the 2 and 9 positions of the phenanthroline (phen) have shown remarkable results in preventing the structural relaxation in the excited state.21 Fig. 3 shows some benchmark [Cu(N^N)2]+ complexes together with their photophysical properties. [Cu(phen)2]+ exhibits a similar maximum absorption band to its congeners. Nevertheless, this complex is not luminescent in solution, even at low temperatures (77 K). The absence of luminescence in this complex has been attributed to an efficient non-radiative decay promoted by the flattening distortion in the excited state.33 The replacement of the protons of 2,9 position of the phen ligand with methyl groups ([Cu(dmp)2]+) leads to a dramatic improvement in the photophysical properties of the complex in comparison with the former. Indeed, a short-lived luminescence is observed (90 ns) with a photoluminescence quantum yield (PLQY) of 0.021%.41 A further improvement is observed when bulky phenyl groups are introduced instead of the protons, such as the case of [Cu(dpp)2]+ with a luminescence lifetime of 250 ns and a PLQY of 0.107%.52
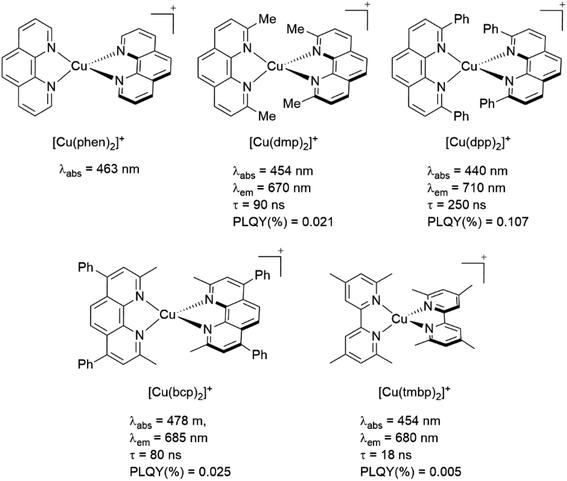 | ||
| Fig. 3 Effect of the functionalization of the phenanthroline moiety with bulky groups on the photophysical properties of [Cu(N^N)2]+ complexes. Data was measured in dichloromethane (DCM) at 298 K. Photophysical data was extracted from ref. 33, 41 and 52. | ||
The functionalization of the other positions of the phen (4,7 positions) seems to not significantly improve the photophysical properties of [Cu(N^N)2]+ complexes. This is the case of the complex [Cu(bcp)2]+ whose photophysical properties are comparable to the properties of [Cu(dmp)2]+.41,52
Another important factor is the rigidity of the backbone of the diimine ligand. As shown in Fig. 3, the complex [Cu(tmbp)2]+ (tmbp = 4,4′,6,6′-tetramethyl-2,2′-bipyridine) presents lower quantum efficiency (0.005%) and luminescent lifetime (18 ns) than the phenanthroline based Cu(I) complexes (i.e. [Cu(dmp)2]+, τ = 90 ns, PLQY(%) = 0.021). In this case, the excited-state distortion seems to be more pronounced due to the flexibility of the bipyridine moiety.41
During the 70 s, McMillin and coworkers reported that Cu(I) complexes that featured diimine ligands (e.g. di-substituted phenanthrolines and bipyridines) and triphenylphosphine ligands (PPh3) such as [Cu(dmp)(PPh3)2]+ exhibited MLCT (d → π*) transitions around 360 nm. However, these complexes suffered from a ligand dissociation behavior that limited their applications (vide infra).53,54 It was not until 2002, that McMillin and Walton reported one of the firsts examples of highly luminescent and stable heteroleptic [Cu(N^N)(P^P)]+ complexes with diimine ligands and chelating diphosphine ligands. For instance, the [Cu(dmp)(POP)]+ complex showed a higher PLQY (15%) than the homoleptic [Cu(dmp)2]+ complex (PLQY = 0.021%) in DCM. Also, the luminescent lifetime was enhanced (14.3 μs in DCM at 298 K).38 This work led to the development of various other diphosphine chelating ligands such as Xantphos (or Xant, 4,5-bis(diphenylphosphino)-9,9-dimethylxanthene), BINAP (2,2′-bis(diphenylphosphino)-1,1′-binaphthyl), Phanephos (4,12-bis(diphenylphosphino)-[2.2]paracyclophane), among others.55–57
The improved emissive properties were attributed to the fact that chelating diphosphine ligands exert a steric effect that can stabilize the tetrahedral geometry and destabilize the square planar geometry thanks to their wide natural bite angles and the three-dimensional orientation of the aryl substituents bonded to the phosphorous atoms.36 Moreover, their MLCT states are higher in energy in comparison to diimine homoleptic Cu(I) complexes, thus decreasing the probability of non-radiative decay.58
In the ground state, [Cu(N^N)(P^P)]+ complexes exhibit a pseudo-tetrahedral geometry. They display intense absorption bands in the UV region ascribed to π → π* transitions of the N^N and P^P ligands. Besides, charge transfer (CT) absorption bands appear in the (near) visible region.36 According to time-dependent density functional theory (TD-DFT) calculations, these complexes commonly have a HOMO and HOMO-1 which have a strong d orbital character, centered at the Cu center, and the lone pair of the phosphorous atoms of the P^P ligand. Conversely, the LUMO and LUMO+1 are π* ligand-centered orbitals at the N^N ligand.59–61 As a result, the CT bands are mainly ascribed to MLCT transitions Cu → N^N.36
The presence of the bulky diphosphine ligand helps to minimize the structural distortion in the excited state, thus preventing non-radiative decay and the exciplex quenching. For instance, the complex [Cu(phen)(POP)]+ (see Fig. 4) shows a luminescent lifetime of 0.19 μs and a PLQY(%) of 0.18% while the analogous homoleptic complex [Cu(phen)2]+ is non-emissive. As shown in Fig. 4, for [Cu(N^N)(P^P)]+ complexes, the introduction of bulky substituents in the N^N moiety has also a strong impact over their photophysical properties.38 For example, the complex [Cu(phen)(POP)]+ has a lower PLQY(%) (0.18) and luminescent lifetime (0.19 μs) than the complexes [Cu(dmp)(POP)]+ (PLQY(%) = 15; τ = 14.3 μs) and [Cu(dbp)(POP)]+ (PLQY(%) = 16; τ = 16.1 μs).
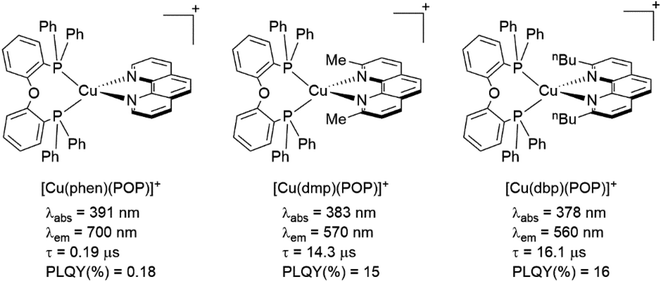 | ||
| Fig. 4 Photophysical data of selected heteroleptic [Cu(N^N)(P^P)]+ complexes. Data was measured in DCM at 298 K. Photophysical data extracted from ref. 38. | ||
As mentioned before, a dynamic ligand exchange equilibrium has been identified for heteroleptic [Cu(N^N)(P^P)]+ complexes (see eqn (1)). In other words, in solution, the heteroleptic species [Cu(N^N)(P^P)]+ is in equilibrium with the homoleptic [Cu(N^N)2]+ and [Cu(P^P)2]+ species.62 This ligand exchange equilibrium is not beneficial for practical applications especially when prolonged periods under visible light are required.63 For instance, Karnahl and coworkers tested complex [Cu(dmp)(Xant)]+ as a photosensitizer in the photocatalytic reduction of protons.64 The complex exhibited a relatively high production of H2 until 15 hours of operation. After this time, a strong decrease in its activity was observed. It was suggested that the drop of the catalytic activity was associated with either the decomposition of the iron-based water reduction catalyst and/or the dissociation of the heteroleptic species following the equilibrium shown in eqn (1).
| 2[Cu(N^N)(P^P)]+ ⇄ [Cu(N^N)2]+ + [Cu(P^P)2]+ | (1) |
This dynamic exchange equilibrium is commonly observed when small-sized labile phosphines are employed (i.e. dppm = 1,1-bis(diphenylphosphino)methane). In the case of diphosphine ligands with wide bite angles such as POP, Xant, etc, the steric factors help to destabilize the homoleptic [Cu(P^P)2]+ species since the Cu(I) metal center is not big enough to coordinate the two bulky (P^P) ligand in a tetrahedral arrangement. Accordingly, minor dissociation is observed.62
Another interesting aspect of the photophysics of both [Cu(N^N)2]+ and [Cu(N^N)(P^P)]+ Cu(I) complexes is their capability of showing thermally activated delayed fluorescence (TADF).19 Back in the 1970s and 1980s, McMillin and coworkers attributed the emission properties dependence with the temperature to luminescence from two thermally equilibrated excited states ascribed to a 3MLCT and 1MLCT excited states.41 Nowadays, the photoluminescence from the 1MLCT has been confirmed to require thermal energy, thus being more appropriately described as thermally activated delayed fluorescence.36
This thermally activated delayed fluorescence property of luminescent Cu(I) complexes has positioned them as promising emitting materials for light-emitting devices.19,22,32,39,40 The following chapters will be dedicated to deeply describing the TADF behavior of Cu(I) complexes focusing mainly (but not limited to) on [Cu(N^N)2]+ and [Cu(N^N)(P^P)]+ complexes. Examples will be provided to describe the TADF phenomenon and to illustrate how certain parameters influence TADF performance such as the energy difference between the lowest singlet and triplet excited states, spin orbit-coupling, temperature, solvent, among others.
3. Thermally activated delayed fluorescence (TADF)
3.1. Exciton harvest mechanisms for emitting materials
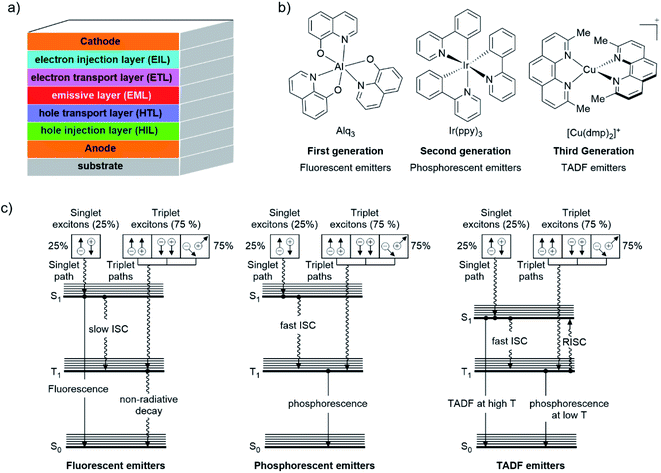
For several years, a lot of effort has been devoted to increasing the PLQY of luminescent compounds.65 As already introduced, TADF emitters are considered nowadays promising materials for areas such as organic light-emitting diodes (OLEDs), imaging, sensing, photoinduced polymerization reactions, among others.66,67 In particular in the field of OLEDs, TADF molecules (without the necessity of precious metals such as Ir or Pt), allow the efficient harvesting of both triplet and singlet excitons generated during charge recombination in electroluminescent devices.32,42To understand the TADF phenomenon, some basic principles of the electro-luminescent processes of OLED devices should be addressed. Fig. 5a shows the typical arrangement of an OLED device. A transparent substrate of glass or plastic supports the anode which is generally indium tin oxide (ITO; (In2O3)0,9(SnO2)0,1). Next to this layer, a hole injection material (HIL) and/or a hole transporting layer (HTL) is deposited followed by the emissive layer (EML) where the electroluminescence takes place (i.e. an organic host material doped with a luminescent compound). An electron transport layer (ETL) and/or an electron injection layer (EIL) come next. Finally, a low work function metal cathode (e.g., Ca, Al, Ba, among others) is evaporated at the top.68–71
When an external voltage is applied to the device, opposite charge (electron(e−) and hole(h+)) carriers are injected from the cathode and anode, respectively.69,70 These charges migrate into the device by their coulombic force to finally recombine in the EML to form an exciton (a singlet or triplet excited state species).68,70 This exciton relaxes from the excited state to the ground state by a luminescent pathway.70 Given the electrical nature of this process, statistically, 25% singlet (S = 0) and 75% triplet (S = 1) excitons are formed.72
The capability of an emitter to harvest singlet and triplet excitons defines the efficiency of the OLED device.69 As a result, different “generations” of emitters have been developed through the years (Fig. 5b). The first generation of emitters consisted of fluorescent emitters such as 8-hydroxyquinoline aluminum (Alq3, see Fig. 5b). These dyes display notable prompt fluorescence rates but negligible phosphorescent rates due to a slow ISC (Fig. 5c).43 Therefore, the maximum theoretical internal quantum efficiencies (IQE) of OLEDs comprising this type of emitters is limited to 25%.42 The IQE is defined as the relationship between the number of photons emitted from the EML per second and the number of electrons injected into the device per second.73
The incorporation of phosphorescent materials which exhibit strong SOC (i.e. organometallic or coordinated complexes of Ir(III), Pt(II), etc) constitutes the second generation of emitters (Fig. 5b).43 The strong SOC leads to a fast (≈100 fs) and efficient ISC from the lowest singlet excited state (S1) to the lowest triplet excited state (T1). Hence, phosphorescence is observed leading to an increase of the maximum theoretical IQE of the luminescent device since both singlet and triplet excitons are harvested (see Fig. 5c).22 Nevertheless, this second generation of “triplet harvesting or phosphorescent emitters” presents some drawbacks primarily associated with costs and availability of precious metals. Moreover, the long radiative lifetimes of their excited states (1–100 μs)74 could reduce the stability of the devices (i.e. by quenching processes due to the formation of non-emissive exciplexes).70
TADF compounds constitute the third generation of emitters (see example in Fig. 5b).43 As shown in Fig. 5c, in this class of emitters, a relatively fast reverse intersystem crossing (RISC) occurs from the lowest triplet excited state (T1) to the lowest singlet excited state (S1) with the aid of thermal energy (kBT) leading to a delayed fluorescence (DF) in addition to prompt fluorescence (PF).65 For RISC to happen, a relatively small singlet-triplet energy gap ΔE(S1–T1) (preferable, not larger than 1000 cm−1 ≈ 120 meV) is required, therefore, room temperature is enough to thermally populate the S1 excited state.22 In this case, both singlet and triplet excitons are also harvested. Since all excitons are harvested via the singlet state, these compounds are also called “singlet harvesting emitters” in the literature.72
3.2. A brief history of TADF emitters
Thermally activated delayed fluorescence is a phenomenon that was discovered around 90 years ago. In 1929, Jean Perrin proposed that in some cases an “activated metastable state” formed after light absorption can not return to the ground state by spontaneous emission of light (fluorescence). In these cases, these species can only return to the ground state through the interaction with other molecules and/or by activating a higher energy state (“fluorescence of long duration”).75At that time, the nature of this “metastable state” was unknown and subject of debate.66 It was recognized that some dyes showed two “phosphorescent bands” (α and β). The first band (α-phosphorescence) was very similar to the fluorescent band, and the decay rate of this process increased rapidly with the temperature. The second band (β-phosphorescence) had lower energy, and when the temperature was low enough only a beta band was observed.76 Opposed to the idea that both of these bands were “phosphorescent bands”, Perrin defined the first band as a “fluorescence of long duration” while the second one was named “true phosphorescence”.77 Moreover, Jablonski78 introduced the idea that the same excited “metastable state” was responsible for both of these processes. Also, he proposed that the β-phosphorescence process was spontaneous and the α-phosphorescence process required thermal energy.
In 1941, Lewis, Lipkin and Magel corroborated some of these ideas by studying the photophysical properties of fluorescein dissolved in boric acid at different temperatures.76 They proposed the energy diagram depicted in Fig. 6 where N represents the “normal state” (ground state), and F and P represent “fluorescent” and “phosphorescent” states, respectively.
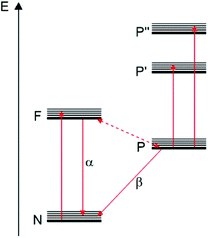 | ||
| Fig. 6 Energy diagram of fluorescein in boric acid proposed by Lewis, Lipkin and Magel in 1941.76 “Reprinted with permission from J. Am. Chem. Soc. 1941, 63, 11, 3005–3018. Copyright 1941 American Chemical Society”. | ||
According to them, the absorption of light could promote the transition of molecules from the N state to the F state. The molecules in the F state can return to the N state showing a fluorescent band. On the other hand, some of the molecules in F could also reach a P state (“phosphorescent state” or “metastable state”). At low temperatures, these molecules can return from P to the N state only by the β-phosphorescence process (“true phosphorescence”). However, when the temperature increases, a great portion of these molecules in P could return to the state F by thermal activation. Then, the return from the F state to the N state will show the emission of the α-phosphorescence band which is identical to the fluorescence band.76 They were also able to determine a 9 kcal mol−1 (3100 cm−1 = 390 meV) energy difference between the levels F and P which can be considered as the first determination of the ΔE(S1–T1) value for an organic compound. The ΔE(S1–T1) value is considered an important parameter that should be minimized in order to improve the TADF process.40
The “metastable state” was later reasoned to be the lowest triplet state thanks to the efforts of Terenin in 1943 and Lewis and Kasha in 1944.79–81 This led to the development of a series of studies attempting to understand the TADF phenomenon. For instance, in 1960, Rosemberg and Shombert were able to quantify the ratios of intensities of α-to β-phosphorescence bands at different temperatures. Moreover, they determine a ΔE(S1–T1) value of 8 kcal mol−1 (2800 cm−1 = 350 meV) for acriflavine adsorbed on silica gel.82
A year later, Parker and Hatchard studied the photophysics of eosin in glycerol and ethanol.83 For both solvents, a long-lived luminescence was observed and two emission bands were identified one in the visible region (its intensity was dependent on the temperature) and the other in the far red (its intensity was not dependent on the temperature). The two bands were determined to be originated from the lowest energy triplet excited state. The far-red band (called the phosphorescent band) was attributed to a direct transition from the triplet excited state to the ground state. The higher-energy band was termed delayed fluorescence and was assigned to the population of the upper singlet excited state by thermal energy followed by the radiative transition from the singlet excited state to the ground state (fluorescence). They also defined that the activation energy of the later process should correspond to the energy difference between the lowest energy singlet excited state and the lowest energy triplet excited state (ΔE(S1–T1)). For eosin, ΔE(S1–T1) was measured to be around 10 kcal mol−1 (3500 cm−1 = 434 meV).83 The same authors also presented the first designation of TADF as E-type delayed fluorescence (E from eosin).84
The terminology used nowadays (thermally activated delayed fluorescence “TADF”) was first proposed by Wilkinson and Horrocks in 1968.85 Since then various molecules were found to emit via TADF including benzophenones,86,87 metal porphyrins,88 aromatic thiones,89 thioketones,90 anthraquinones,91 fullerenes,32 copper complexes (vide infra),41 among others.
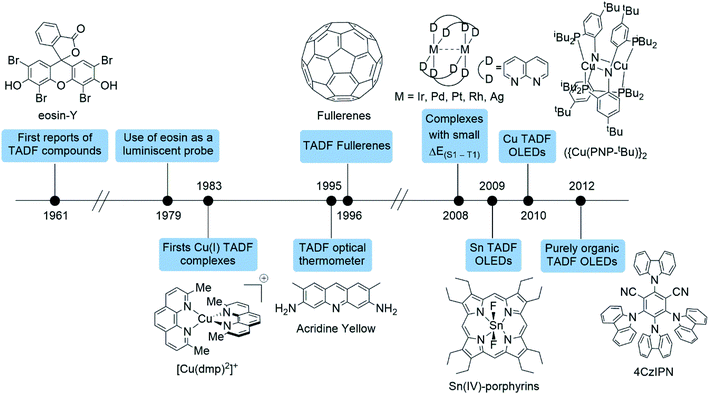
Fig. 7 shows a timeline of some of the breakthroughs in the development of TADF emitters and their potential applications starting from the first reports of TADF compounds such as eosin and Cu(I) complexes (vide supra). In 1979, Garland and Morre used eosin as a luminescent probe for the measurement of the rotational mobility of membrane proteins.92 Moreover, Acridine yellow was used as an optical thermometer by Harris et al. in 1995.93 One year later Berberan-Santos and García reported the first studies about the TADF of fullerene derivatives.94 Remarkably, subsequent studies on the properties of TADF fullerene derivatives led to the development of high-sensitive oxygen and temperature dual sensors.95–100
In 2008, Yersin and Monkowius patented various polynuclear metal complexes of Ir, Pd, Pt, Rh and Ag featuring small ΔE(S1–T1) (which is ideal for a TADF emitter, see below) for OLEDs (50–2000 cm−1).101 One year later, a Sn(IV)-porphyrin complex was employed as a TADF emitter for the same application.102 Moreover, shortly afterwards, a highly emissive dinuclear Cu(I) complex {Cu(PNP-tBu)}2 (see Fig. 7) was employed as an emitter in OLED devices.103 This bis(phosphine)diarylimido Cu(I) complex showed a relatively short ΔE(S1–T1) of 786 cm−1 (97 meV) and a PLQY of 57%. The OLED device based on this TADF complex showed an external quantum efficiency (EQE, ratio of emitted photons over the injected charges)73 of 16.1% which is greater than the expected EQE of devices based on fluorescent emitters (around 5%).104
Remarkably, in 2012, Adachi and co-workers reported a new series of organic TADF complexes based on carbazolyl dicyanobenzenes (CDCB) where the carbazole moiety is the donor and the dicyanobenzene acts as the acceptor.105 These emitters are based on donor-bridge-acceptor structures in which the carbazole moieties are in a relatively high twisted conformation with respect to the cyanobenzene. This arrangement reduces the overlap between the HOMO (centered at the carbazole moieties) and LUMO (centered on the dicyanobenzene).104 The magnitude of ΔE(S1–T1) value depends strongly on the exchange interaction of the unpaired electrons (both S1 and T1 states have open-shell configurations). A reduction in the overlap between the density distributions of the orbitals involved in the transition (such is the case of CT excitations) reduces the quantum mechanical exchange interaction and, as a consequence, the ΔE(S1–T1) value.43 For instance, the compound 2,4,5,6-tetra(carbazol-9-yl)-1,3-dicyanobenzene (4CzIPN; Fig. 7) presents a high PLQY (%) of approximately 94%. The TADF lifetime of 4CzIPN is 5.1 μs, and the ΔE(S1–T1) was predicted to be around 83 meV (670 cm−1). The EQE of the OLED devices based on these emitters was between 8–19.3%.
These discoveries led to the fast and thriving development of TADF emitters. Up to 2017 more than 400 publications about TADF emitters were reported.104 This hot topic has been also the focus of various recent reviews.32,44,65,66,68–70,72,74,106–109
3.3. Cu(I) TADF complexes
As mentioned before, the photophysical and photochemical properties of Cu(I) complexes have been exploited in several applications due to their interesting photophysical and photochemical characteristics.2–15,21 Moreover, they generally have small ΔE(S1–T1) values (0.05–0.18 eV).32 As a result, various Cu(I) complexes display TADF at room temperatures.22 The relatively high abundance of copper in the earth crust also make these complexes interesting alternatives to precious metal complexes (Ru, Ir, Pt, etc) from a cost perspective.18,19Since McMillin reported the TADF properties of homoleptic copper complexes, based in bis-phenanthroline (e.g. [Cu(dmp)2]+), several other Cu(I) complexes have been reported to exhibit TADF.39,110 The (re)discovery of the TADF properties of these complexes in the last years has helped to revive their application in light-emitting devices, in which Cu(I) complexes were for a long time considered inadequate.19,46 Recent reports have also pinpointed that TADF Cu(I) complexes exhibit better performances than none-TADF Cu(I) complexes in the free photoinduced radical polymerization of methacrylates.67
Cu(I) TADF emitters can be grouped into two main classes: mononuclear and multinuclear complexes (see Fig. 8).22,46,47 Mononuclear Cu(I) TADF complexes include predominantly cationic and neutral tetracoordinate compounds (vide supra). Moreover, some three-coordinate compounds have been also reported in the literature (see examples provided in Fig. 8).47 As stated before, this work is predominantly focused on describing the TADF properties of cationic tetracoordinate Cu(I) complexes of the type [Cu(N^N)2]+ and [Cu(N^N)(P^P)]+. A handful of reviews and recent reports that cover the photophysical and photochemical properties of the other types of Cu(I) TADF complexes are available in the literature.19,22,47,110–124
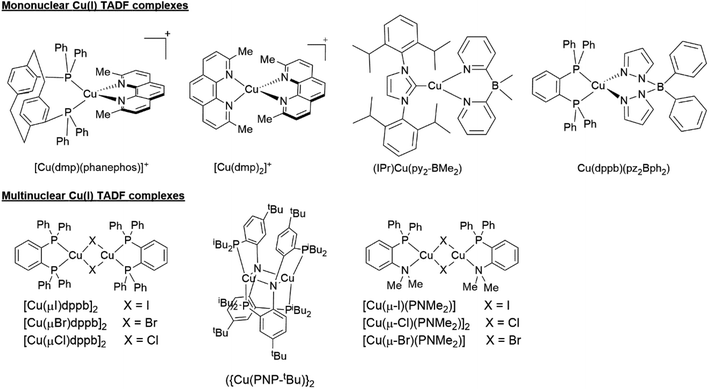 | ||
| Fig. 8 Selected examples of the different classes of Cu(I) TADF complexes. Examples are reported in ref. 41, 57, 103 and 125–128. | ||
Several examples of [Cu(N^N)2]+ and [Cu(N^N)(P^P)]+ complexes that exhibit TADF have been reported in the literature.57,129–140 The photophysical properties of some of these complexes are reported in Table 1. The next section will be devoted to describing the parameters that are used to characterize the TADF phenomenon of Cu(I) TADF compounds.
| CH2Cl2 | Solid | CH2Cl2 | Solid | CH2Cl2 | Solid | CH2Cl2 | Solid | |
|---|---|---|---|---|---|---|---|---|
| λem-300K | 670 nm | — | 715 nm | — | 700 nm | — | 700 nm | — |
| λem-77K | — | — | — | — | — | — | — | — |
| PLQY300K | 0.021% | — | 0.024% | — | 0.081% | — | 0.088% | — |
| PLQY77K | — | — | — | — | — | — | — | — |
| τ-300K | 90 ns | — | 62.70 ns | — | 105.70 ns | — | 109.60 ns | — |
| τ-77K | — | — | — | — | — | — | — | — |
| τ(T1) | — | — | — | — | — | — | — | — |
| τ(TADF) | — | — | — | — | — | — | — | — |
| ΔE(S1–T1) | 1800 cm−1 | 2137–2734 cm−1 | 1331–2686 cm−1 | 1218–2145 cm−1 | ||||
| Ref. | 41 | 141 | 141 | 141 | ||||
| CH2Cl2 | Solid | CH2Cl2 | Solid | CH2Cl2 | Solid | CH2Cl2 | Solid | |
|---|---|---|---|---|---|---|---|---|
| λem-300K | 710 nm | — | 679 nm | — | — | 698 | — | |
| λem-77K | — | — | — | — | — | — | — | — |
| PLQY300K | 0.107% | — | 0.40% | — | 6% | — | 0.10% | — |
| PLQY77K | — | — | — | — | — | — | — | — |
| τ-300K | 250 ns | — | 365 ns | — | 3.2 μs | — | 216 ns | — |
| τ-77K | — | — | — | — | — | — | — | — |
| τ(T1) | — | — | — | — | — | — | — | — |
| τ(TADF) | — | — | — | — | — | — | — | — |
| ΔE(S1–T1) | 2670–2847 cm−1 | 2678–2710 cm−1 | 790 cm−1 | 2694–2855 cm−1 | ||||
| Ref. | 52 and 142 | 142 | 143 | 142 | ||||
| CH2Cl2 | Solid | CH2Cl2 | Solid | CH2Cl2 | Solid | CH2Cl2 | Solid | |
|---|---|---|---|---|---|---|---|---|
| λem-300K | 678 nm | — | 550 nm | — | 549 nm | — | 567 nm | — |
| λem-77K | — | — | — | — | — | — | — | — |
| PLQY300K | 0.08% | — | 71% | 14% | 40% | 11% | 60% | 35% |
| PLQY77K | — | — | — | — | — | — | — | — |
| τ-300K | 92 ns | — | — | — | — | — | — | — |
| τ-77K | — | — | — | — | — | — | — | — |
| τ(T1) | — | — | — | — | — | — | — | — |
| τ(TADF) | — | — | — | — | — | — | — | — |
| ΔE(S1–T1) | 2016–2734 cm−1 | 1855 cm−1 | 1774–2178 cm−1 | 1693–2097 cm−1 | ||||
| Ref. | 142 | 129 | 129 | 129 | ||||
| CH2Cl2 | Solid | CH2Cl2 | Solid | CH2Cl2 | Solid | CH2Cl2 | Solid | |
|---|---|---|---|---|---|---|---|---|
| λem-300K | 543 nm | — | 541 nm | — | 431 nm | — | 547 nm | — |
| λem-77K | — | — | — | — | — | — | — | — |
| PLQY300K | 1% | 18% | 98% | 17% | <1% | <1% | < 1% | 1% |
| PLQY77K | — | — | — | — | — | — | — | — |
| τ-300K | — | — | — | — | — | — | — | — |
| τ-77K | — | — | — | — | — | — | — | — |
| τ(T1) | — | — | — | — | — | — | — | — |
| τ(TADF) | — | — | — | — | — | — | — | — |
| ΔE(S1–T1) | 1290–1936 cm−1 | 2016 cm−1 | 5888–8872 cm−1 | 1774–2258 cm−1 | ||||
| Ref. | 129 | 129 | 129 | 129 | ||||
| CH2Cl2 | Solid | CH2Cl2 | Solid | CH2Cl2 | Solid | aCH2Cl2/bMe-THF | Solid | |
|---|---|---|---|---|---|---|---|---|
| λem-300K | 558 nm | 530 nm | — | 600 nm | 690 nm | 566 nm | a629 nm | 558 nm |
| λem-77K | 548 nm | 562 nm | 615 nm | — | 587 nm | — | b555 nm | — |
| PLQY300K | 40% | 80% | — | 5.1% | 0.10% | 36.6% | a6.0% | 27.5% |
| PLQY77K | 60% | 70% | — | — | — | — | — | — |
| τ-300K | 10 μs | 14 μs | — | 4.30 μs | 200 μs | 12.75 μs | a2401 ns | 8.7 μs |
| τ-77K | 130 μs | 240 μs | 160.5 μs | — | 132.1 μs | — | b27 μs | — |
| τ(T1) | — | 240 μs | — | 94 μs | — | 134 μs | — | — |
| τ(TADF) | — | 14 μs | — | 158 μs | — | 164 μs | — | — |
| ΔE(S1–T1) | — | 1000 cm−1 | — | 661 cm−1 | — | 758 cm−1 | — | — |
| Ref. | 57 | 130 | 130 | 131 | ||||
| aCH2Cl2/bMe-THF | Solid | CH2Cl2 | Solid | aCH2Cl2/bMe-THF | Solid | aCH2Cl2/bMe-THF | Solid | |
|---|---|---|---|---|---|---|---|---|
| λem-300K | a626 nm | 550 nm | — | 577 nm | a649 nm | 580 nm | a650 nm | 587 nm |
| λem-77K | b557 nm | — | — | 602 nm | b610 nm | — | b613 nm | — |
| PLQY300K | a9.6% | 9.8% | — | 1.30% | a0.5% | 3.0% | a0.5% | 1.7% |
| PLQY77K | — | — | — | — | — | — | — | — |
| τ-300K | a4987 ns | 10.2 μs | — | 4.2 μs | a46 ns | 1.5 μs | a104 ns | 1.3 μs |
| τ-77K | b14 μs | — | — | — | b16 μs | — | b11 μs | — |
| τ(T1) | — | — | — | — | — | — | — | — |
| τ(TADF) | — | — | — | — | — | — | — | — |
| ΔE(S1–T1) | — | — | — | 968 cm−1 | 1452 cm−1 | 1452 cm−1 | ||
| Ref. | 131 | 132 | 131 and 133 | 131 and 133 | ||||
| aCH2Cl2/bMe-THF | Solid | aCH2Cl2/bMe-THF | Solid | aCH2Cl2/bMe-THF | Solid | aCH2Cl2/bMe-THF | Solid | |
|---|---|---|---|---|---|---|---|---|
| λem-300K | a646 nm | 575 nm | a647 nm | 581 nm | — | 648 nm | — | 647 nm |
| λem-77K | b610 nm | — | b595 nm | — | b656 nm | — | b646 nm | — |
| PLQY300K | a0.7% | 6.2% | a0.6% | 11.1% | — | 0.5% | — | 0.5% |
| PLQY77K | — | — | — | — | — | — | — | — |
| τ-300K | a119 ns | 2.9 μs | a99 ns | 2.9 μs | — | 0.18 μs | — | 0.25 μs |
| τ-77K | b45 μs | — | b31 μs | — | — | — | — | — |
| τ(T1) | — | — | — | — | — | — | — | — |
| τ(TADF) | — | — | — | — | — | — | — | — |
| ΔE(S1–T1) | — | — | — | — | — | — | — | — |
| Ref. | 133 | 133 | 133 | 133 | ||||
| aCH2Cl2/bMe-THF | Solid | aCH2Cl2/bMe-THF | Solid | aCH2Cl2/bMe-THF | Solid | aCH2Cl2/bMe-THF | Solid | |
|---|---|---|---|---|---|---|---|---|
| λem-300K | a697 nm | 664 nm | a705 nm | 632 nm | a637 nm | 517 nm | a635 nm | 539 nm |
| λem-77K | b650 nm | — | b652 nm | — | b604 nm | — | b551 nm | — |
| PLQY300K | — | 0.5% | — | 0.9% | a0.5 | 50.3% | a10 | 37.3% |
| PLQY77K | — | — | — | — | — | — | — | — |
| τ-300K | — | 0.10 μs | — | 0.58 μs | a39 ns | 12 μs | a3406 ns | 11.4 μs |
| τ-77K | b3 μs | — | b5 μs | — | b42 μs | — | b88 μs | — |
| τ(T1) | — | — | — | — | — | — | — | — |
| τ(TADF) | — | — | — | — | — | — | — | — |
| ΔE(S1–T1) | 1533 cm−1 | — | 1613 cm−1 | — | 887 cm−1 | — | — | — |
| Ref. | 133 | 133 | 133 | 133 | ||||
| aCH2Cl2/bMe-THF | Solid | aCH2Cl2/bMe-THF | Solid | aCH2Cl2/bMe-THF | Solid | aCH2Cl2/bMe-THF | Solid | |
|---|---|---|---|---|---|---|---|---|
| λem-300K | a642 nm | 571 nm | a648 nm | 602 nm | a632 nm | 556 nm | a643 nm | 585 nm |
| λem-77K | b594 nm | — | b588 nm | — | b578 nm | — | b591 nm | — |
| PLQY300K | a0.9% | 6.3% | a0.5% | 1.1% | a0.5% | 9.6% | a0.7% | 2.7% |
| PLQY77K | — | — | — | — | — | — | — | — |
| τ-300K | a338 ns | 5.1 μs | a45 ns | 0.4 μs | a93 ns | 3.3 μs | a108 ns | 2.3 μs |
| τ-77K | b44 μs | — | b14 μs | — | b25 μs | — | b63 μs | — |
| τ(T1) | — | — | — | — | — | — | — | — |
| τ(TADF) | — | — | — | — | — | — | — | — |
| ΔE(S1–T1) | — | — | — | — | — | — | — | — |
| Ref. | 131 | 131 | 131 | 131 | ||||
| CH2Cl2 | Solid | CH2Cl2 | Solid | aCH2Cl2/bMe-THF | Solid | aCH2Cl2/ | Solid | |
|---|---|---|---|---|---|---|---|---|
| λem-300K | 639 nm | 567 nm | 635 nm | 547 nm | a630 nm | 518 nm | a627 nm | 529 nm |
| λem-77K | — | — | — | — | b566 nm | — | b559 nm | — |
| PLQY300K | 1.2% | 9.5% | 1.8% | 33.8% | a1.5% | 42.7% | a3.3% | 58.8% |
| PLQY77K | — | — | — | — | — | — | — | — |
| τ-300K | 172 ns | 2.6 μs | 784 ns | 9.7 μs | a730 ns | 9.3 μs | a1595 ns | 9.8 μs |
| τ-77K | — | — | — | — | b81 μs | — | b75 μs | — |
| τ(T1) | — | — | — | — | — | — | — | — |
| τ(TADF) | — | — | — | — | — | — | — | — |
| ΔE(S1–T1) | — | — | — | — | — | — | — | — |
| Ref. | 131 | 131 | 131 | 131 | ||||
| EtOH | Solid | EtOH | Solid | CH2Cl2 | Solid | CH2Cl2 | Solid | |
|---|---|---|---|---|---|---|---|---|
| λem-300K | 575 nm | 555 nm | 655 nm | 575 nm | — | 490 nm | 540 | 495 nm |
| λem-77K | 535 nm | 575 nm | 605 nm | 595 nm | — | 508 nm | — | 507 |
| PLQY300K | 6% | 55% | <1% | 9% | — | 89.87% | — | 45% |
| PLQY77K | — | 47% | — | — | — | — | — | 71% |
| τ-300K | 2.5 μs | 11 μs | <1 μs | — | — | 23.6 μs | — | 134 μs |
| τ-77K | 73 μs | 87 μs | 16 μs | — | — | 269 μs | — | 671 μs |
| τ(T1) | — | 84 μs | — | — | — | — | — | 660 μs |
| τ(TADF) | — | 11 μs | — | — | — | — | — | 134 μs |
| ΔE(S1–T1) | — | 720 cm−1 | — | — | — | 726 cm−1 | — | 1452 cm−1 |
| Ref. | 134 | 134 | 135 | 136 | ||||
| CH2Cl2 | DPEPO film | CH2Cl2 | DPEPO film | CH2Cl2 | DPEPO film | CH2Cl2 | DPEPO film | |
|---|---|---|---|---|---|---|---|---|
| λem-300K | 514 nm | 534 nm | 518 nm | 533 nm | 534 nm | 565 nm | 537 nm | 564 nm |
| λem-77K | — | 544 nm | — | 545 nm | — | 582 nm | — | 575 nm |
| PLQY300K | 6.0% | 62% | 9.5% | 71% | 5.0% | 48% | 4.2% | 42% |
| PLQY77K | — | — | — | — | — | — | — | — |
| τ-300K | — | 21.4 μs | — | 24.1 μs | — | 5.8 μs | — | 4.3 μs |
| τ-77K | — | — | — | — | — | — | — | — |
| τ(T1) | — | — | — | — | 228 μs | |||
| τ(TADF) | — | — | — | — | 1.9 μs | |||
| ΔE(S1–T1) | — | 887 cm−1 | — | 645 cm−1 | — | 564 cm−1 | — | 403 cm−1 |
| Ref. | 137 | 137 | 137 | 137 | ||||
| CH2Cl2 | Solid | CH2Cl2 | Solid | CH2Cl2 | Pristine film | CH2Cl2 | Pristine film | |
|---|---|---|---|---|---|---|---|---|
| λem-300K | 616 nm | 550 nm | 616 nm | 556 nm | — | 572 nm | — | 533 nm |
| λem-77K | 543 nm | 568 nm | 546 nm | 564 nm | — | — | — | — |
| PLQY300K | — | 22.4% | — | 20.0% | — | 2.9% | — | 15.5% |
| PLQY77K | — | 19.3% | — | 19.4% | — | — | — | — |
| τ-300K | — | 5.7 μs | — | 5.7 μs | — | 0.95 μs | — | 0.90 μs |
| τ-77K | — | 343 μs | — | 363 μs | — | — | — | — |
| τ(T1) | — | 334 μs | — | 356 μs | — | — | — | — |
| τ(TADF) | — | 5.7 μs | — | 5.7 μs | — | — | — | — |
| ΔE(S1–T1) | — | 726 cm−1 | — | 726 cm−1 | — | 1766 cm−1 | — | 1347 cm−1 |
| Ref. | 139 | 139 | 138 | 138 | ||||
3.4. Evaluation of the TADF behavior of Cu(I) complexes
The TADF behavior of a compound depends strongly on certain properties such as the energy gap between the lowest energy singlet and triplet excited states (ΔE(S1–T1)), the spin–orbit coupling (SOC), the decay times of fluorescence (τ(S1)) and phosphorescence (τ(T1)), among others.19,22,50The luminescent decay time dependence (τ) with the temperature is generally employed for the determination of the emission properties of TADF compounds.19 The data obtained is fitted to a Boltzmann-like relation (see eqn (2)) assuming that the molecule has two thermally equilibrated excited states (S1 and T1) and the ground state (S0).40
 | (2) |
In eqn (2), τ(T) represents the overall decay time. τ(T1) and τ(S1) correspond to the phosphorescence and fluorescence decay times, and ΔE(S1–T1) is the energy gap between the lowest energy singlet and triplet excited states. According to this relation, the exponential terms disappear at low temperatures. As a result, the measured decay time τ(T) is equal to the phosphorescence decay time τ(T1) at such temperatures. In contrast, when the temperature increases, the solution of the equation leads to the TADF decay time (τ(TADF)) since the term containing τ(T1) vanishes.40 The total decay time of the compounds according to this model depends strongly on τ(T1), τ(S1) and ΔE(S1–T1) parameters. These parameters at the same time depend on the nature of the emitter and its environment.19 Moreover, τ(T1), τ(S1) and ΔE(S1–T1) values can be determined after fitting the experimental luminescent lifetimes measured at different temperatures (i.e. 77–300 K).134 The knowledge of τ(T1), τ(S1) and ΔE(S1–T1) values is of primary importance for the proposal of rational design rules for Cu(I) TADF complexes.50 In particular, the ΔE(S1–T1) gap has been recognized to greatly impact the emission behavior of TADF compounds.40,43 It has ideally been proposed that the ΔE(S1–T1) gap should not exceed 1000 cm−1 ≈ 120 meV to maximize the TADF luminescence.22 ΔE(S1–T1) values of various [Cu(N^N)2]+ and [Cu(N^N)(P^P)]+ complexes have been reported in the literature, which are summarized in Fig. 9.41,57,129,130,132–139,141–143
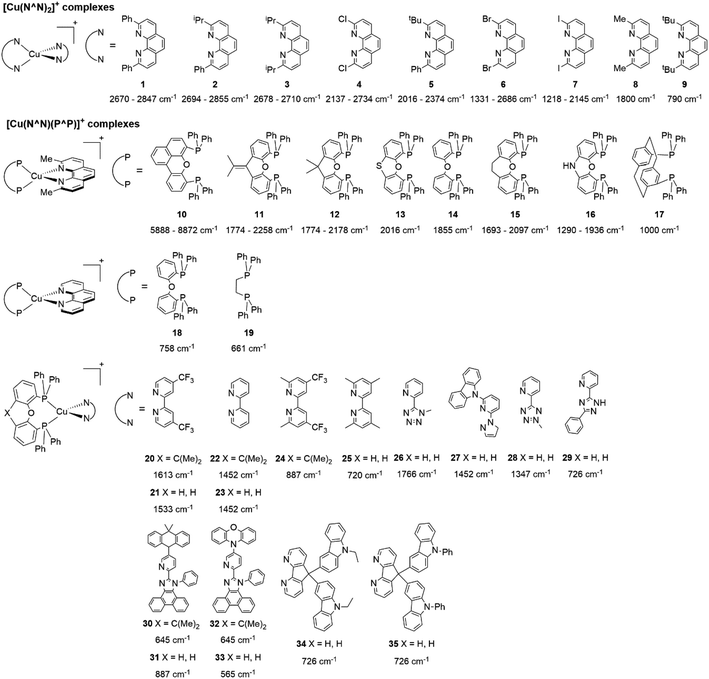 | ||
| Fig. 9 Selected [Cu(N^N)2]+ and [Cu(N^N)(P^P)]+ complexes together with their ΔE(S1–T1) values. Data taken from ref. 41, 57, 129, 130, 133–139 and 141–143. | ||
As previously explained ΔE(S1–T1) values can be determined by fitting the emission decay times at different temperatures to the Boltzmann-like relation shown in eqn (2). This approach has been used for calculating the TADF parameters in the case of complexes 9, 17–19, 27 and 34–35 (using the luminescent data in the solid state).57,130,134,136,137,139,143 Another method for the determination of ΔE(S1–T1) is based on the estimation of the S1 and T1 energies by considering the onsets of the fluorescence (298 K) and phosphorescence (77 K) emission spectra (commonly in the solid state).132,135,137–139 Using the latter approach, the ΔE(S1–T1) values of complexes 26, 28–35 have been estimated. For complexes 34 and 35, the difference between the ΔE(S1–T1) values obtained by fitting the luminescent data at different temperatures to eqn (2) and the estimation based on the onsets of the fluorescence (298 K) and phosphorescence (77 K) emission spectra was 0.01 eV (80 cm−1) and 0.05 eV (400 cm−1), respectively. Moreover, for 32, the difference between the ΔE(S1–T1) values calculated using both approaches was around 0.01 eV (80 cm−1).
Density functional theory (DFT) and time-dependent DFT (TD-DFT) quantum mechanical calculations have been also employed for the determination of ΔE(S1–T1) values (e.g. in complexes 1, 2, 4–7, 10–16, 20–24, 26, 28).129,133,138,141,142 DFT and TD-DFT techniques are nowadays widely used for the simulation of chemical systems and their properties.144 Although, in general, these techniques are robust and efficient at a reasonable computational cost, they also have some weaknesses.145–152
Modeling the excited state properties of homoleptic and heteroleptic Cu(I) complexes is challenging especially for capturing the effects of flattening distortion in the excited states upon light excitation.129 DFT and TD-DFT calculations of ΔE(S1–T1) can be carried out starting from different geometries such as the ground state geometry (more common) and/or the excited singlet or triplet state geometries.129,133,138,142 Besides, symmetry restrictions can be imposed and different conformers can be considered both in the ground state and excited state geometries.141,142
Rebilly, Gourlaouen, Pellegrin and coworkers studied the excited-state properties of complexes 1, 2, 3 and 5 by experiments and TD-DFT calculations.142 For the calculations different conformers were considered both in the ground and the excited states. For instance, in complex 1 ([Cu(dpp)2]+) two conformers were tested in the ground state, one of D2 symmetry (more stable) and another one of S4 symmetry. In the excited state two scenarios were evaluated to capture the flattening distortion of the molecule. First, the delocalization of the electron in the excited state over the two phenanthroline moieties to lead a D2 symmetry, and the second possibility was to consider the localization of the electron on one of the ligands results in a C2 geometry. The results of the ΔE(S1–T1) considering the D2 and C2 geometries (generated from the D2 ground state) were 0.331 eV (2670 cm−1) and 0.353 eV (2847 cm−1), respectively, proposing 1 as TADF emitter.
A similar analysis was performed by Zysman-Colman for [Cu(N^N)(P^P)]+ complexes (10–16).129 In their calculations of ΔE(S1–T1) they considered the geometries of the ground state and the excited states to account for the effect of the flattening distortion. According to their results, the differences between ΔE(S1–T1) values calculated using the ground state and the triplet excited state geometries were similar. For example, for complexes 12 and 14 the ΔE(S1–T1) values calculated using the ground state geometries were 0.27 eV (2178 cm−1) and 0.23 eV (1855 cm−1), respectively. While, the calculated ΔE(S1–T1) of the complexes, considering the triplet excited state geometry, were 0.22 eV (1774 cm−1) and 0.23 eV (1855 cm−1), respectively.
Zhu, Dias, Bryce and coworkers reported the calculation of ΔE(S1–T1) values of complexes 26 and 28 by an estimation based on the onsets of the fluorescence (298 K) and phosphorescence (77 K) emission spectra and by employing DFT and TD-DFT techniques.138 The values based on the estimation from the emission spectra were 0.219 eV (1766 cm−1) and 0.167 eV (1347 cm−1) for complexes 26 and 28, respectively; while values predicted from TD-DFT calculations were 0.177 eV (1428 cm−1) and 0.136 eV (1097 cm−1) for 26 and 28, respectively, performed on the optimized ground state geometries. These values agree with the tendency obtained based on the estimation from the emission spectra.
Although there are some differences in the ΔE(S1–T1) values reported using the different techniques described above, the examples provided in Fig. 9 could give some trends. For example, avoiding the flattening distortion by the use of bulky substituents in the 2,9 positions of the phenanthroline is minimizing ΔE(S1–T1) as can be identified comparing methyl substituents on the phenanthroline based complexes 8 (ΔE(S1–T1) = 1800 cm−1) respect to tert-butyl substituents in 9 (ΔE(S1–T1) = 790 cm−1). It is important to clarify that although the phenyl substituents are bulkiest than tert-butyl (comparison between complexes 1,2 and 3 vs. 9), the flattening restriction is avoided in 9 due to the limited possibility of π–π interactions, a situation that occurs in 1,2 and 3 between phenyl pendant substituents and the neighbor phenanthroline ligand.142 On the other hand, the substitution with –CF3 groups in the 4,4′ positions of the bipyridine ligand has an impact on the increase of the ΔE(S1–T1) value. For example, the inclusion of –CF3 at 20 or 21 produces higher ΔE(S1–T1) values (1613 and 1533 cm−1) than its bipyridine analogs 22 and 23 (1452 cm−1). Similar is the case when comparing 24 with 25.133 Conclusions regarding the different diphosphine ligands seem to be difficult to be drawn due to the variability of the ΔE(S1–T1) values (most of them were obtained by DFT and TD-DFT calculations, vide supra). However, it seems that the variation of the diphosphine ligand also plays an important role in minimizing ΔE(S1–T1). It is worth mentioning that the complex featuring dmp and phanephos (4,12-bis(diphenylphosphino)-[2.2]paracyclophane) ligands (17) displays a notable PLQY of 80% with a ΔE(S1–T1) value of 1000 cm−1. These characteristics made this complex an interesting candidate (or starting point) for electroluminescent applications.57
Minimizing the ΔE(S1–T1) value does not guarantee that a compound will show an efficient TADF.43 As explained before, the TADF phenomenon is originated from a relatively fast RISC from the lowest triplet excited state (T1) to the lowest singlet excited state (S1) facilitated by thermal energy.65 The two excited states involved in this non-radiative transition have a different multiplicity hence the electronic SOC dominates the interaction.43
Cu(I) complexes generally present weaker SOC in comparison with precious transition metal complexes with Ir or Pt.32,65 In terms of TADF, the weaker SOC of Cu(I) complexes is balanced with the small values of ΔE(S1–T1).44 The SOC is a determining factor in the TADF behavior, eventually, even complexes with high values of ΔE(S1–T1) (>1000 cm−1) are able to show TADF if the SOC is relatively high.32 For instance, the SOC of complexes 1, 2, 3 and 5 were calculated by DFT and TD-DFT techniques.142 The reported values of SOC for complex 1 ([Cu(dpp)2]+) were 15.3 cm−1 for a D2 symmetry (excited electron delocalized in the two phenanthroline ligands) and 49.5 cm−1 for a C2 symmetry (excited electron delocalized in one of the phenanthroline ligands). Similar values were obtained for the other complexes 2 (17.7–52.5 cm−1), 3 (18.2–56.8 cm−1) and 5 (32.9–63.4 cm−1). The ΔE(S1–T1) (see Fig. 9) and SOC values of 1, 2, 3 and 5 allow an efficient RISC, and thus, a good TADF behavior although ΔE(S1–T1) is larger than 1000 cm−1.
4. Applications, challenges and summary
Cu(I) complexes that exhibit TADF properties have been found attractive in the last years for their application in electroluminescent devices such as OLEDs or light-emitting electrochemical cells (LECs).22,46,47 Although these complexes present some drawbacks primarily associated with the flattening distortion of their geometry in the excited state opening non-radiative decay pathways, a series of synthetic strategies have been proposed to mitigate this effect via the introduction of bulky substituents in the backbone of the N^N and P^P ligands.21,36,51,153In this section, some Cu(I) complexes that have been successfully employed in electroluminescent devices are described.129,131–133,135,136,139 The main performance parameters of the devices built based on these complexes are depicted in Table 2. Besides, the structures and photophysical properties of the complexes are provided in Table 1. It is also worth mentioning that other kinds of Cu(I) complexes that are out of the scope of this review, have been also applied in electroluminescent devices.103,125,126,154–165
| Complex | Device | Von (V) | Javg (A m−2) | ton (min) | Lum0 (cd m−2) | Lummax (cd m−2) | t1/2 (h) | EQE (%) | CEmax (cd A−1) | λmax (nm) | Ref. |
|---|---|---|---|---|---|---|---|---|---|---|---|
| a Von = turn-on voltage recorded at a luminance of 1 cd m−2; Javg = average current density; ton = time to reach the maximum luminance; Lum0 = initial luminance; Lummax = maximum luminance; t1/2 = device lifetime; EQE = external quantum efficiency; CEmax = maximum current efficiency. | |||||||||||
| [Cu(czpzpy)(POP)]+ | OLED | 5.6 | — | — | — | 2939 | — | 6.34 | 17.34 | 514 | 136 |
| [Cu(ECAF)(POP)]+ | OLED | 5.2 | — | — | — | 11![[thin space (1/6-em)]](https://www.rsc.org/images/entities/char_2009.gif) 010 010 |
— | 14.81 | 47.03 | 544 | 139 |
| [Cu(PCAF)(POP)]+ | OLED | 5.3 | — | — | — | 5242 | — | 6.67 | 21.33 | 544 | 139 |
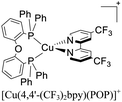
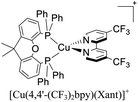
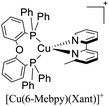
| [Cu(6-CF3bpy)(POP)]+ | LEC | — | 100 | 22 | 39 | 65 | 8.5 | 0.40 | 0.20 | 595 | 133 |
| [Cu(6-CF3bpy)(Xant)]+ | LEC | — | 100 | 137 | 5 | 109 | 31.0 | 0.50 | 0.40 | 589 | 133 |
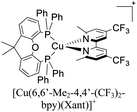
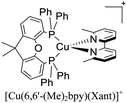
| [Cu(6,6′-Me2-4,4′–(CF3)2–bpy)(Xant)]+ | LEC | — | 100 | 8 | 59 | 131 | 2.0 | 0.60 | 0.40 | 593 | 133 |
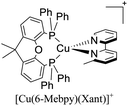
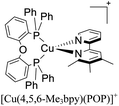
| [Cu(4,5,6-Me3bpy)(POP)]+ | LEC | — | 100 | 18 | 64 | 111 | 0.7 | 0.40 | 1.10 | 571 | 131 |
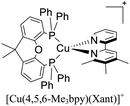
| [Cu(4,5,6-Me3bpy)(Xant)]+ | LEC | — | 100 | 13 | 0 | 462 | 3.1 | 1.70 | 4.60 | 570 | 131 |
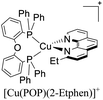
| [Cu(2-Etphen)(POP)]+ | LEC | — | 100 | 25 | 273 | 451 | 5.7 | 1.80 | 4.50 | 582 | 131 |
| [Cu (2-Etphen)(Xant)]+ | LEC | — | 100 | 122 | 0 | 153 | 34 | 0.60 | 1.50 | 580 | 131 |
| [Cu(dmp)(POP)]+ | LEC | — | 100 | 26 | — | 169 | 0.2 | 0.65 | 1.70 | — | 129 |
| OLED | — | — | — | — | 1860 | — | 3.60 | 11.1 | — | 129 | |
| [Cu(dmp)(Xant)]+ | LEC | — | 100 | 44 | — | 223 | 4.3 | 0.84 | 2.20 | — | 129 |
| OLED | — | — | — | — | 101 | — | 0.20 | 0.7 | — | 129 | |
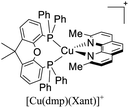
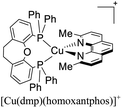
| [Cu(dmp)(homoxantphos)]+ | LEC | — | 100 | 0 | — | 452 | 16.5 | 1.85 | 4.50 | — | 129 |
| OLED | — | — | — | — | 937 | — | 4.40 | 13.9 | — | 129 | |
| [Cu(dmp)(thixantphos)]+ | LEC | — | 100 | 18 | — | 108 | 0.1 | 0.45 | 1.10 | — | 129 |
| OLED | — | — | — | — | 575 | — | 2.50 | 7.1 | — | 129 | |
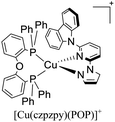
Examples of [Cu(N^N)(P^P)]+ complexes that have been employed in electroluminescent devices feature diphosphine ligands (P^P) such as POP and Xant derivatives in combination with diimine ligands (N^N) including phenanthroline, bipyridine, 4,5-diazafluorene, among others. For instance, in 2015, Lu and coworkers reported the synthesis and characterization of the luminescent complex [Cu(czpzpy)(POP)]+ (czpzpy = 2-(9H-carbazolyl)-6-(1H-pyrazolyl)pyridine).136,166 This complex was employed in an OLED device built on ITO-coated support followed by a hole injection layer made of PEDOT:PSS (poly(3,4-ethylene dioxythiophene):polystyrene sulfonate) (40 nm). The active layer made of 20 wt% [Cu(czpzpy)(POP)]+ and the free diimine ligand czpzpy (30 nm) was deposited by spin coating technique. Thermally deposited DPEPO (bis[2-(diphenylphosphino)phenyl]ether oxide) (10 nm) and TPBI (2,2′,2′′-(1,3,5-benzinetriyl)-tris(1-phenyl-1-H-benzimidazole) (50 nm) were used as the hole-blocking and electron-transporting layer, respectively. On top of this arrangement, a layer of LiF (0.8 nm) and Al (100 nm) was deposited as the cathode. The device showed a strong green emission (λmax = 514 nm) with 2939 cd m−2 and 6.34% of Lummax and EQE, respectively. The current maximum efficiency was 17.37 cd A−1.
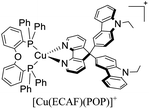
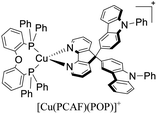
Chen, Lu, Zhai and coworkers reported the application of the complexes [Cu(ECAF)(POP)]+ (ECAF = 9,9-bis(9-ethylcarbazol-3-yl)-4,5-diazafluorene) and [Cu(PCAF)(POP)]+ (PCAF = 9,9-bis(9-phenylcarbazaol-3-yl)-4,5-diazafluorene) in OLEDs with the follow configuration: ITO/PEDOT:PSS (40 nm)/TCTA (4,4′,4′′-tris(carbazol-9-yl)-triphenylamine) (15 nm)/[Cu(N^N)(P^P)]+ complex (10 wt%): mCP (1,3-bis(9-carbazolyl)benzene) (30 nm)/TmPyPB (1,3,5-tri[(3-pyridyl)-phen-3-yl]benzene) (50 nm)/LiF (0.5 nm)/Al (100 nm). The devices built showed a yellowish – green emission (λmax = 544 nm).139 When the complex [Cu(ECAF)(POP)]+ was employed, a Lummax of 11![[thin space (1/6-em)]](https://www.rsc.org/images/entities/char_2009.gif) 010 cd m−2 was achieved. The EQE for this device was 14.81%. Conversely, the Lummax (5242) and EQE (6.67) decreased for the devices built using [Cu(PCAF)(POP)]+.
010 cd m−2 was achieved. The EQE for this device was 14.81%. Conversely, the Lummax (5242) and EQE (6.67) decreased for the devices built using [Cu(PCAF)(POP)]+.
In 2018, Housecroft, Ortí and coworkers employed [Cu(N^N)(P^P)]+ complexes featuring POP (or Xant) and CF3 substituted bipyridine ligands in LECs.133 The devices were built on ITO-coated glass and then PEDOT:PSS was employed as the hole injection layer. The active layer was a thin film of the luminescent Cu(I) complexes mixed with an ionic liquid ([Emim][PF6], 1-ethyl-3-methylimidazolium hexafluorophosphate) in a [Cu(N^N)(P^P)]+: [Emim][PF6] ratio of 4![[thin space (1/6-em)]](https://www.rsc.org/images/entities/char_2009.gif) :
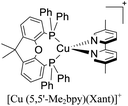
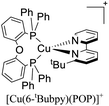
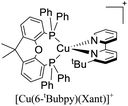
:![[thin space (1/6-em)]](https://www.rsc.org/images/entities/char_2009.gif) 1. Above this setup, a cathode made of an aluminum film was deposited. The LECs based on [Cu(6-CF3bpy)(POP)]+, [Cu(6-CF3bpy)(Xant)]+ and [Cu(6,6′-Me2-4,4′-(CF3)2bpy)(Xant)]+ were tested. The three devices emitted in the orange region (λmax = 589–595 nm). The LEC based on [Cu(6-CF3bpy)(POP)]+ showed an initial luminance (Lum0) of 39 cd m−2. The time to reach the maximum luminance (Lummax = 65 cd m−2) was ton = 22 min. The device lifetime (t1/2) defined as the time to decay half of Lummax was 8.5 h. The modification of the diphosphine ligand in [Cu(6-CF3bpy)(Xant)]+ increased the Lummax and t1/2 to 109 cd m−2 and 31 h, respectively. However, the ton was slower (137 min). On the other hand, the devices where [Cu(6,6′-Me2-4,4′-(CF3)2bpy)(Xant)]+ was used as the active layer, showed a further increase of the Lum0 (59 cd m−2) reaching a maximum luminance of 131 cd m−2 after a ton of 8 min. The device lifetime was nonetheless lower (t1/2 = 2.0 h).
1. Above this setup, a cathode made of an aluminum film was deposited. The LECs based on [Cu(6-CF3bpy)(POP)]+, [Cu(6-CF3bpy)(Xant)]+ and [Cu(6,6′-Me2-4,4′-(CF3)2bpy)(Xant)]+ were tested. The three devices emitted in the orange region (λmax = 589–595 nm). The LEC based on [Cu(6-CF3bpy)(POP)]+ showed an initial luminance (Lum0) of 39 cd m−2. The time to reach the maximum luminance (Lummax = 65 cd m−2) was ton = 22 min. The device lifetime (t1/2) defined as the time to decay half of Lummax was 8.5 h. The modification of the diphosphine ligand in [Cu(6-CF3bpy)(Xant)]+ increased the Lummax and t1/2 to 109 cd m−2 and 31 h, respectively. However, the ton was slower (137 min). On the other hand, the devices where [Cu(6,6′-Me2-4,4′-(CF3)2bpy)(Xant)]+ was used as the active layer, showed a further increase of the Lum0 (59 cd m−2) reaching a maximum luminance of 131 cd m−2 after a ton of 8 min. The device lifetime was nonetheless lower (t1/2 = 2.0 h).
The same group also reported the application of another set of [Cu(N^N)(P^P)]+ complexes in LECs.131 The diphosphine ligands included POP and Xant moieties whereas the diimine ligands included substituted phenanthroline and bipyridine ligands. The devices were built in a similar way than their previous report ITO/PEDOT: PSS/[Cu(P^P)(N^N)][PF6]: [Emim][PF6] 4![[thin space (1/6-em)]](https://www.rsc.org/images/entities/char_2009.gif) :
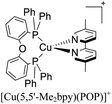
:![[thin space (1/6-em)]](https://www.rsc.org/images/entities/char_2009.gif) 1 molar ratio/Al. For instance, the LECs based on [Cu(4,5,6-Me3bpy)(POP)]+ reached a maximum luminance of 111 cd m−2 after a ton of 18 min. The device lifetime (t1/2) was around 0.7 h and the EQE around 0.4%. Upon the change of the diphosphine ligand in [Cu(4,5,6-Me3bpy)(Xant)]+ the Lummax increased to 462 cd m−2 and a decrease of the ton to 13 min was observed. The EQE of this device was 1.7% and the t1/2 around 3 hours. Regarding the complexes with substituted phenanthroline moieties, the devices where [Cu(2-Etphen)(POP)]+ was used as the active layer showed a higher initial luminance (Lum0 = 273 cd m−2). The ton of the device was 25 min reaching a Lummax of 451 cd m−2. The device lifetime (t1/2 = 5.7 h) and the EQE (1.8%) were also increased. Conversely, the Xant analogue ([Cu(2-Etphen)(Xant)] +) showed a slower turn on (t1/2 = 122 min) reaching a Lummax of 153 cd m−2 and a EQE of 0.6%. Nevertheless, the device lifetime was longer (t1/2 = 34 h) which could be interpreted as a better stability of the device during operation.131
1 molar ratio/Al. For instance, the LECs based on [Cu(4,5,6-Me3bpy)(POP)]+ reached a maximum luminance of 111 cd m−2 after a ton of 18 min. The device lifetime (t1/2) was around 0.7 h and the EQE around 0.4%. Upon the change of the diphosphine ligand in [Cu(4,5,6-Me3bpy)(Xant)]+ the Lummax increased to 462 cd m−2 and a decrease of the ton to 13 min was observed. The EQE of this device was 1.7% and the t1/2 around 3 hours. Regarding the complexes with substituted phenanthroline moieties, the devices where [Cu(2-Etphen)(POP)]+ was used as the active layer showed a higher initial luminance (Lum0 = 273 cd m−2). The ton of the device was 25 min reaching a Lummax of 451 cd m−2. The device lifetime (t1/2 = 5.7 h) and the EQE (1.8%) were also increased. Conversely, the Xant analogue ([Cu(2-Etphen)(Xant)] +) showed a slower turn on (t1/2 = 122 min) reaching a Lummax of 153 cd m−2 and a EQE of 0.6%. Nevertheless, the device lifetime was longer (t1/2 = 34 h) which could be interpreted as a better stability of the device during operation.131
More recently, Zysman-Colman and coworkers reported the application of [Cu(dmp)(P^P)]+ complexes in both LECs and OLEDs. Interestingly, different P^P ligands were tested.129 LEC devices were prepared using an ITO glass substrate coated with PEDOT:PSS (40 nm) hole injection layer. Abode this arrangement, the emissive layer composed of a mixture of the luminescent [Cu(dmp)(P^P)]+ complex and LiBF4 in a 9![[thin space (1/6-em)]](https://www.rsc.org/images/entities/char_2009.gif) :
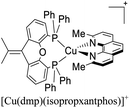
:![[thin space (1/6-em)]](https://www.rsc.org/images/entities/char_2009.gif) 1 molar ratio was spin-coated. A layer of an Al cathode was then vacuum deposited on the top. The OLED devices, alternatively, were constructed on glass ITO substrates coated with PEDOT:PSS. Then, a VNPB (N4,N4′-dinaphthalen-1-yl-N4,N4′-bis(4-vinylphenyl)biphenyl-4,4′-diamine) hole transporting layer was spin-coated and thermally treated to allow the fixation of the emissive layer. The emissive layer was constituted by a mixture of [Cu(dmp)(P^P)]+ complex (5 wt%), TCTA and OXD-7 (1,3-bis[2-(4-tert-butylphenyl)-1,3,4-oxadiazo-5- yl]benzene). On top of this arrangement, a layer of the electron-transporting material BmPyPhB (1,3-bis[3,5-di(pyridin-3-yl)phenyl]benzene) followed by a Ba (5 nm)/Ag (100 nm) bilayer cathode was placed. The Lummax of the devices were in the 108–450 cd m−2 range. Moreover, the lifetimes of the devices (t1/2) were between 0.1 h for [Cu(dmp)(thixantphos)]+ (4,6-Bis-[bis-(4-methoxy-phenyl)-phosphanyl]-2,8-dimethyl-phenoxathiin) to 16.5 h for [Cu(dmp)(homoxantphos)]+ (4,6-Bis(diphenylphosphino)-10,11-dihydrodibenz[b,f]oxepin). The best EQE (1.85%) was obtained for [Cu(dmp)(homoxantphos)]+. Regarding OLEDs, the Lummax depended greatly on the diphosphine ligand used. For instance, a Lummax of 101 cd m−2 was reached for [Cu(dmp)(Xant)]+ whereas the Lummax of the device based on [Cu(POP)(dmp)]+ was 1860 cd m−2. The EQE of the OLED devices (0.20–4.40%) were in general higher than those reported for the LECs (0.45–1.85%). The device with the highest EQE (4.40%) was based on [Cu(dmp)(homoxantphos)]+.
1 molar ratio was spin-coated. A layer of an Al cathode was then vacuum deposited on the top. The OLED devices, alternatively, were constructed on glass ITO substrates coated with PEDOT:PSS. Then, a VNPB (N4,N4′-dinaphthalen-1-yl-N4,N4′-bis(4-vinylphenyl)biphenyl-4,4′-diamine) hole transporting layer was spin-coated and thermally treated to allow the fixation of the emissive layer. The emissive layer was constituted by a mixture of [Cu(dmp)(P^P)]+ complex (5 wt%), TCTA and OXD-7 (1,3-bis[2-(4-tert-butylphenyl)-1,3,4-oxadiazo-5- yl]benzene). On top of this arrangement, a layer of the electron-transporting material BmPyPhB (1,3-bis[3,5-di(pyridin-3-yl)phenyl]benzene) followed by a Ba (5 nm)/Ag (100 nm) bilayer cathode was placed. The Lummax of the devices were in the 108–450 cd m−2 range. Moreover, the lifetimes of the devices (t1/2) were between 0.1 h for [Cu(dmp)(thixantphos)]+ (4,6-Bis-[bis-(4-methoxy-phenyl)-phosphanyl]-2,8-dimethyl-phenoxathiin) to 16.5 h for [Cu(dmp)(homoxantphos)]+ (4,6-Bis(diphenylphosphino)-10,11-dihydrodibenz[b,f]oxepin). The best EQE (1.85%) was obtained for [Cu(dmp)(homoxantphos)]+. Regarding OLEDs, the Lummax depended greatly on the diphosphine ligand used. For instance, a Lummax of 101 cd m−2 was reached for [Cu(dmp)(Xant)]+ whereas the Lummax of the device based on [Cu(POP)(dmp)]+ was 1860 cd m−2. The EQE of the OLED devices (0.20–4.40%) were in general higher than those reported for the LECs (0.45–1.85%). The device with the highest EQE (4.40%) was based on [Cu(dmp)(homoxantphos)]+.
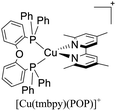
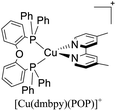
Although, as mentioned before, Cu(I) TADF complexes have come into the limelight as potential emitters in electroluminescent devices, their TADF properties have been recently started to be exploited in other areas such as synthetic chemistry. Noteworthy, Dumur, Lalevée and coworkers successfully employed the TADF complex [(Cu(tmbpy)(POP)]+ as a photosensitizer in the photoinduced free radical polymerization (FRP) of methacrylates and the cationic polymerization (CP) of diepoxides.67 Besides, a comparison of the activity of the TADF complex [(Cu(tmbpy)(POP)]+ and the non-TADF complex [Cu(dmbpy)(POP)]+ was carried out. Regarding the FRP of methacrylates a conversion of 60% was achieved using [(Cu(tmbpy)(POP)]+ whereas the conversion was only 30% when the non-TADF [Cu(dmbpy)(POP)]+ was employed. The same trend was observed for the CP of di-epoxides with conversions of 30% and 12% for [(Cu(tmbpy)(POP)]+ and [Cu(dmbpy)(POP)]+, respectively. The enhancement in the conversions of the reactions studied was mainly attributed to the TADF character of [(Cu(tmbpy)(POP)]+.
5. Conclusions
Needless to say TADF [Cu(N^N)2]+ and [Cu(N^N)(P^P)]+ complexes have been come into the limelight in recent years as interesting alternatives for luminescent complexes based on precious metals such as Ru, Ir and Pt thanks to their capacity to harvest both triplet and singlet excitons via RISC, and also considering the abundance of copper in the earth crust.18,32,42As has been commented, [Cu(N^N)2]+ and [Cu(N^N)(P^P)]+ TADF complexes have been employed as active layers in various OLEDs and LECs devices. Although the performance of these devices is still far from a commercial application, there is still plenty of room for improvement and several efforts should be performed to address the main drawbacks associated with the usage of these complexes.
[Cu(N^N)2]+ and [Cu(N^N)(P^P)]+ commonly undergo flattening distortion in the excited state which overall decreases the luminescent quantum yield (vide supra).37 Some strategies have been implemented to impede the distortion of the geometry in the excited state such as the functionalization of N^N moieties including bulky alkyl or aromatic groups and the introduction of voluminous chelating diphosphine ligands.19,38
Although [Cu(N^N)(P^P)]+ complexes mostly address the flattening distortion issue, they often undergo a ligand exchange equilibrium reaction between [Cu(N^N)(P^P)]+ complex and the respective homoleptic [Cu(N^N)2]+ and [Cu(P^P)]+ species.62 This ligand exchange equilibrium could affect the operational performance of [Cu(N^N)(P^P)]+ complexes.
The TADF phenomenon is greatly influenced by the ΔE(S1–T1) and SOC values. As a result, efforts must be done to minimize the ΔE(S1–T1) value and improve the SOC (and thus the RISC).32 LECs and OLECs generally require short luminescent lifetimes (τ) to avoid non-radiative quenching processes that could reduce the stability of the device.70 Therefore, more research must be done to minimize the decay times of fluorescence (τ(S1)) and phosphorescence (τ(T1)) in [Cu(N^N)2]+ and [Cu(N^N)(P^P)]+ complexes, especially since lower τ(S1) values, are associated with higher ΔE(S1–T1) values (not beneficial for TADF).19
Conflicts of interest
The authors declare that they have no known competing financial interests or personal relationships that could have appeared to influence the work reported in this paper.Acknowledgements
C.S-P. is grateful to CONICYT-PFCHA/Doctorado Nacional/2019-21190173 and Programa de Incentivos a la Iniciación Científica (PIIC 2020) of Universidad Técnica Federico Santa María, M. S-N. acknowledges FONDECYT project No. 3170663, P. D. acknowledges FONDECYT project No. 1201173 and PI_M_2020_31 USM project.References
- J. Twilton, C. Le, P. Zhang, M. H. Shaw, R. W. Evans and D. W. C. MacMillan, Nat. Rev. Chem., 2017, 1, 0052 CrossRef CAS.
- T. E. Bitterwolf, J. Organomet. Chem., 2004, 689, 3939–3952 CrossRef CAS.
- M. Graetzel, Acc. Chem. Res., 1981, 14, 376–384 CrossRef CAS.
- T. J. Meyer, Acc. Chem. Res., 1989, 22, 163–170 CrossRef CAS.
- K. Kalyanasundaram and M. Grätzel, Coord. Chem. Rev., 1998, 177, 347–414 CrossRef CAS.
- C. Kreitner, A. K. C. Mengel, T. K. Lee, W. Cho, K. Char, Y. S. Kang and K. Heinze, Chem.– Eur. J., 2016, 22, 8915–8928 CrossRef CAS PubMed.
- V. A. Grinberg, A. V. Medved’ko, V. V. Emets, S. A. Kurzeev, S. A. Kozyukhin, A. E. Baranchikov, V. K. Ivanov, V. N. Andreev and E. A. Nizhnikovskii, Russ. J. Electrochem., 2014, 50, 503–509 CrossRef CAS.
- H. Yersin, A. F. Rausch, R. Czerwieniec, T. Hofbeck and T. Fischer, Coord. Chem. Rev., 2011, 255, 2622–2652 CrossRef CAS.
- H. Xu, R. Chen, Q. Sun, W. Lai, Q. Su, W. Huang and X. Liu, Chem. Soc. Rev., 2014, 43, 3259–3302 RSC.
- W. Wu, S. Ji, W. Wu, H. Guo, X. Wang, J. Zhao and Z. Wang, Sens. Actuators, B, 2010, 149, 395–406 CrossRef CAS.
- Z.-B. Zheng, Z.-M. Duan, Y.-Y. Ma and K.-Z. Wang, Inorg. Chem., 2013, 52, 2306–2316 CrossRef CAS PubMed.
- S. A. Archer, A. Raza, F. Dröge, C. Robertson, A. J. Auty, D. Chekulaev, J. A. Weinstein, T. Keane, A. J. H. M. Meijer, J. W. Haycock, S. MacNeil and J. A. Thomas, Chem. Sci., 2019, 10, 3502–3513 RSC.
- T. J. Whittemore, T. A. White and C. Turro, J. Am. Chem. Soc., 2018, 140, 229–234 CrossRef CAS PubMed.
- M. H. Shaw, J. Twilton and D. W. C. MacMillan, J. Org. Chem., 2016, 81, 6898–6926 CrossRef CAS PubMed.
- W. Deng, W. Feng, Y. Li and H. Bao, Org. Lett., 2018, 20, 4245–4249 CrossRef CAS PubMed.
- N. Armaroli, Chem. Soc. Rev., 2001, 30, 113–124 RSC.
- B. M. Hockin, C. Li, N. Robertson and E. Zysman-Colman, Catal. Sci. Technol., 2019, 9, 889–915 RSC.
- K. Hans Wedepohl, Geochim. Cosmochim. Acta, 1995, 59, 1217–1232 CrossRef.
- R. Czerwieniec, M. J. Leitl, H. H. H. Homeier and H. Yersin, Coord. Chem. Rev., 2016, 325, 2–28 CrossRef CAS.
- O. S. Wenger, J. Am. Chem. Soc., 2018, 140, 13522–13533 CrossRef CAS PubMed.
- C. Förster and K. Heinze, Chem. Soc. Rev., 2020, 49, 1057–1070 RSC.
- M. J. Leitl, D. M. Zink, A. Schinabeck, T. Baumann, D. Volz and H. Yersin, Top. Curr. Chem., 2016, 374, 25 CrossRef PubMed.
- A. Lennert and D. M. Guldi, ChemPhotoChem, 2019, 201900104 CrossRef.
- Y. Saygili, M. Söderberg, N. Pellet, F. Giordano, Y. Cao, A. B. Muñoz-García, S. M. Zakeeruddin, N. Vlachopoulos, M. Pavone, G. Boschloo, L. Kavan, J.-E. Moser, M. Grätzel, A. Hagfeldt and M. Freitag, J. Am. Chem. Soc., 2016, 138, 15087–15096 CrossRef CAS PubMed.
- B. van den Bosch, H.-C. Chen, J. I. van der Vlugt, A. M. Brouwer and J. N. H. Reek, ChemSusChem, 2013, 6, 790–793 CrossRef CAS PubMed.
- R. S. Khnayzer, C. E. McCusker, B. S. Olaiya and F. N. Castellano, J. Am. Chem. Soc., 2013, 135, 14068–14070 CrossRef CAS PubMed.
- C. Sandoval-Pauker, G. Molina-Aguirre and B. Pinter, Polyhedron, 2021, 199, 115105 CrossRef CAS.
- C. B. Larsen and O. S. Wenger, Chem.– Eur. J., 2018, 24, 2039–2058 CrossRef CAS PubMed.
- A. Hossain, A. Bhattacharyya and O. Reiser, Science, 2019, 364, eaav9713 CrossRef PubMed.
- P. Xiao, J. Zhang, D. Campolo, F. Dumur, D. Gigmes, J. P. Fouassier and J. Lalevée, J. Polym. Sci. A: Polym. Chem., 2015, 53, 2673–2684 CrossRef CAS.
- P. Xiao, F. Dumur, J. Zhang, J. P. Fouassier, D. Gigmes and J. Lalevée, Macromolecules, 2014, 47, 3837–3844 CrossRef CAS.
- L. Bergmann, D. M. Zink, S. Bräse, T. Baumann and D. Volz, Top. Curr. Chem., 2016, 374, 22 CrossRef PubMed.
- A. K. Ichinaga, J. R. Kirchhoff, D. R. McMillin, C. O. Dietrich-Buchecker, P. A. Marnot and J. P. Sauvage, Inorg. Chem., 1987, 26, 4290–4292 CrossRef CAS.
- C. O. Dietrich-Buchecker, P. A. Marnot, J.-P. Sauvage, J. R. Kirchhoff and D. R. McMillin, J. Chem. Soc., Chem., 1983, 513, 513–515 RSC.
- M. K. Eggleston, D. R. McMillin, K. S. Koenig and A. J. Pallenberg, Inorg. Chem., 1997, 36, 172–176 CrossRef CAS.
- Y. Zhang, M. Schulz, M. Wächtler, M. Karnahl and B. Dietzek, Coord. Chem. Rev., 2018, 356, 127–146 CrossRef CAS.
- A. LAVIECAMBOT, M. CANTUEL, Y. LEYDET, G. JONUSAUSKAS, D. BASSANI and N. MCCLENAGHAN, Coord. Chem. Rev., 2008, 252, 2572–2584 CrossRef CAS.
- D. G. Cuttell, S.-M. Kuang, P. E. Fanwick, D. R. McMillin and R. A. Walton, J. Am. Chem. Soc., 2002, 124, 6–7 CrossRef CAS PubMed.
- F. Dumur, Org. Electron., 2015, 21, 27–39 CrossRef CAS.
- H. Yersin, R. Czerwieniec, M. Z. Shafikov and A. F. Suleymanova, ChemPhysChem, 2017, 18, 3508–3535 CrossRef CAS PubMed.
- J. R. Kirchhoff, R. E. Gamache, M. W. Blaskie, A. A. Del Paggio, R. K. Lengel and D. R. McMillin, Inorg. Chem., 1983, 22, 2380–2384 CrossRef CAS.
- A. Monkman, in Highly Efficient OLEDs, Wiley-VCH Verlag GmbH & Co. KGaA, Weinheim, Germany, 2018, pp. 425–463 Search PubMed.
- C. M. Marian, J. Föller, M. Kleinschmidt and M. Etinski, in Highly Efficient OLEDs, Wiley-VCH Verlag GmbH & Co. KGaA, Weinheim, Germany, 2018, pp. 257–296 Search PubMed.
- G. Li, Z.-Q. Zhu, Q. Chen and J. Li, Org. Electron., 2019, 69, 135–152 CrossRef CAS.
- R. Ilmi, I. Juma Al-busaidi, A. Haque and M. S. Khan, J. Coord. Chem., 2018, 71, 3045–3076 CrossRef CAS.
- Y. Liu, S.-C. Yiu, C.-L. Ho and W.-Y. Wong, Coord. Chem. Rev., 2018, 375, 514–557 CrossRef CAS.
- I. Benesperi, R. Singh and M. Freitag, Energies, 2020, 13, 2198 CrossRef CAS.
- C. K. Prier, D. A. Rankic and D. W. C. MacMillan, Chem. Rev., 2013, 113, 5322–5363 CrossRef CAS PubMed.
- N. Corrigan, S. Shanmugam, J. Xu and C. Boyer, Chem. Soc. Rev., 2016, 45, 6165–6212 RSC.
- H. Yersin, R. Czerwieniec, M. Z. Shafikov and A. F. Suleymanova, in Highly Efficient OLEDs, Wiley-VCH Verlag GmbH & Co. KGaA, Weinheim, Germany, 2018, pp. 1–60 Search PubMed.
- N. Armaroli, G. Accorsi, F. Cardinali and A. Listorti, in Photochemistry and Photophysics of Coordination Compounds I, Springer Berlin Heidelberg, Berlin, Heidelberg, 2006, vol. 269, pp. 69–115 Search PubMed.
- A. K. I. Gushurst, D. R. McMillin, C. O. Dietrich-Buchecker and J. pierre Sauvage, Inorg. Chem., 1989, 28, 4070–4072 CrossRef CAS.
- R. A. Rader, D. R. McMillin, M. T. Buckner, T. G. Matthews, D. J. Casadonte, R. K. Lengel, S. B. Whittaker, L. M. Darmon and F. E. Lytle, J. Am. Chem. Soc., 1981, 103, 5906–5912 CrossRef CAS.
- M. T. Buckner and D. R. McMillin, J. Chem. Soc., Chem., 1978, 759, 759–761 RSC.
- E. Mejía, S. Luo, M. Karnahl, A. Friedrich, S. Tschierlei, A.-E. Surkus, H. Junge, S. Gladiali, S. Lochbrunner and M. Beller, Chem.– Eur. J., 2013, 19, 15972–15978 CrossRef PubMed.
- C. Minozzi, A. Caron, J.-C. Grenier-Petel, J. Santandrea and S. K. Collins, Angew. Chem., Int. Ed., 2018, 57, 5477–5481 CrossRef CAS PubMed.
- R. Czerwieniec, K. Kowalski and H. Yersin, Dalton Trans., 2013, 42, 9826 RSC.
- A. Barbieri, G. Accorsi and N. Armaroli, Chem. Commun., 2008, 2185 RSC.
- R. D. Costa, D. Tordera, E. Ortí, H. J. Bolink, J. Schönle, S. Graber, C. E. Housecroft, E. C. Constable and J. A. Zampese, J. Mater. Chem., 2011, 21, 16108 RSC.
- T. Tsubomura, K. Kimura, M. Nishikawa and T. Tsukuda, Dalton Trans., 2015, 44, 7554–7562 RSC.
- L.-Y. Zou, Y.-X. Cheng, Y. Li, H. Li, H.-X. Zhang and A.-M. Ren, Dalton Trans., 2014, 43, 11252–11259 RSC.
- A. Kaeser, M. Mohankumar, J. Mohanraj, F. Monti, M. Holler, J.-J. Cid, O. Moudam, I. Nierengarten, L. Karmazin-Brelot, C. Duhayon, B. Delavaux-Nicot, N. Armaroli and J.-F. Nierengarten, Inorg. Chem., 2013, 52, 12140–12151 CrossRef CAS PubMed.
- T. P. Nicholls and A. C. Bissember, Tetrahedron Lett., 2019, 60, 150883 CrossRef CAS.
- M. Heberle, S. Tschierlei, N. Rockstroh, M. Ringenberg, W. Frey, H. Junge, M. Beller, S. Lochbrunner and M. Karnahl, Chem.– Eur. J., 2017, 23, 312–319 CrossRef CAS PubMed.
- Y. Tao, K. Yuan, T. Chen, P. Xu, H. Li, R. Chen, C. Zheng, L. Zhang and W. Huang, Adv. Mater., 2014, 26, 7931–7958 CrossRef CAS PubMed.
- J. Avó, T. Palmeira and F. B. Dias, Springer Series on Fluorescence, in Fluorescence in Industry, ed. B. Pedras and M. Hof, Springer, Cham, 2019, vol. 18, pp. 269–292 Search PubMed.
- M. Bouzrati-Zerelli, N. Guillaume, F. Goubard, T.-T. Bui, S. Villotte, C. Dietlin, F. Morlet-Savary, D. Gigmes, J. P. Fouassier, F. Dumur and J. Lalevée, New J. Chem., 2018, 42, 8261–8270 RSC.
- C. Bizzarri, F. Hundemer, J. Busch and S. Bräse, Polyhedron, 2018, 140, 51–66 CrossRef CAS.
- Q. Wei, Z. Ge and B. Voit, Macromol. Rapid Commun., 2019, 40, 1800570 CrossRef PubMed.
- C. Bizzarri, E. Spuling, D. M. Knoll, D. Volz and S. Bräse, Coord. Chem. Rev., 2018, 373, 49–82 CrossRef CAS.
- B. Pashaei, S. Karimi, H. Shahroosvand, P. Abbasi, M. Pilkington, A. Bartolotta, E. Fresta, J. Fernandez-Cestau, R. D. Costa and F. Bonaccorso, Chem. Soc. Rev., 2019, 48, 5033–5139 RSC.
- D. Volz, J. Photonics Energy, 2016, 6, 020901 CrossRef.
- E. F. Schubert and T. Gessmann, in Encyclopedia of Condensed Matter Physics, Elsevier, 2005, pp. 102–111 Search PubMed.
- W.-P. To, G. Cheng, G. S. M. Tong, D. Zhou and C.-M. Che, Front. Chem., 2020, 8, 1–7 CrossRef PubMed.
- M. N. Berberan-Santos, in New Trends in Fluorescence Spectroscopy Applications to Chemical and Life Sciences, eds. V. Bernard and J.-C. Brochon, Springer-Verlag Berlin Heidelberg, First., 2001, pp. 7–33 Search PubMed.
- G. N. Lewis, D. Lipkin and T. T. Magel, J. Am. Chem. Soc., 1941, 63, 3005–3018 CrossRef CAS.
- R. Delorme and F. Perrin, J. Phys. Radium, 1929, 10, 177–186 CrossRef CAS.
- A. Jabłoński, Zeitschrift für Physik, 1935, 94, 38–46 CrossRef.
- G. N. Lewis and M. Kasha, J. Am. Chem. Soc., 1944, 66, 2100–2116 CrossRef CAS.
- A. Terenin, Acta Physicochim. URSS, 1943, 18, 210–211 CAS.
- M. Kasha, Chem. Rev., 1947, 41, 401–419 CrossRef CAS PubMed.
- J. L. Rosenberg and D. J. Shombert, J. Am. Chem. Soc., 1960, 82, 3252–3257 CrossRef CAS.
- C. A. Parker and C. G. Hatchard, Trans. Faraday Soc., 1961, 57, 1894 RSC.
- C. A. PARKER, C. G. HATCHARD and T. A. JOYCE, Nature, 1965, 205, 1282–1284 CrossRef CAS.
- F. Wilkinson and A. Horrocks, in Luminescence in chemistry, ed. E. Bowen, Van Nostrand, London, 1968, pp. 116–153 Search PubMed.
- P. F. Jones and A. R. Calloway, Chem. Phys. Lett., 1971, 10, 438–443 CrossRef CAS.
- R. E. Brown, L. A. Singer and J. H. Parks, Chem. Phys. Lett., 1972, 14, 193–195 CrossRef CAS.
- J. B. Callis, M. Gouterman, Y. M. Jones and B. H. Henderson, J. Mol. Spectrosc., 1971, 39, 410–420 CrossRef CAS.
- A. Maciejewski, M. Szymanski and R. P. Steer, J. Phys. Chem. A, 1986, 90, 6314–6318 CrossRef CAS.
- M. Sikorski, I. V. Khmelinskii, W. Augustyniak and F. Wilkinson, J. Chem. Soc., Faraday Trans., 1996, 92, 3487 RSC.
- B. S. Yamanashi and D. M. Hercules, Appl. Spectrosc., 1971, 25, 457–460 CrossRef CAS.
- P. B. Garland and C. H. Moore, Biochem. J., 1979, 183, 561–572 CrossRef CAS PubMed.
- J. C. Fister, D. Rank and J. M. Harris, Anal. Chem., 1995, 67, 4269–4275 CrossRef CAS.
- M. N. Berberan-Santos and J. M. M. Garcia, J. Am. Chem. Soc., 1996, 118, 9391–9394 CrossRef CAS.
- F. A. Salazar, A. Fedorov and M. N. Berberan-Santos, Chem. Phys. Lett., 1997, 271, 361–366 CrossRef CAS.
- S. M. Bachilo, A. F. Benedetto, R. B. Weisman, J. R. Nossal and W. E. Billups, J. Phys. Chem. A, 2000, 104, 11265–11269 CrossRef CAS.
- C. Baleizão and M. N. Berberan-Santos, J. Fluoresc., 2006, 16, 215–219 CrossRef PubMed.
- C. Baleizão, S. Nagl, M. Schäferling, M. N. Berberan-Santos and O. S. Wolfbeis, Anal. Chem., 2008, 80, 6449–6457 CrossRef PubMed.
- C. Baleizão and M. N. Berberan-Santos, ChemPhysChem, 2011, 12, 1247–1250 CrossRef PubMed.
- S. Kochmann, C. Baleizão, M. N. Berberan-Santos and O. S. Wolfbeis, Anal. Chem., 2013, 85, 1300–1304 CrossRef CAS PubMed.
- Merck Patent GmbH (DE), WO-2010031485-A1, 2008.
- A. Endo, M. Ogasawara, A. Takahashi, D. Yokoyama, Y. Kato and C. Adachi, Adv. Mater., 2009, 21, 4802–4806 CrossRef CAS PubMed.
- J. C. Deaton, S. C. Switalski, D. Y. Kondakov, R. H. Young, T. D. Pawlik, D. J. Giesen, S. B. Harkins, A. J. M. Miller, S. F. Mickenberg and J. C. Peters, J. Am. Chem. Soc., 2010, 132, 9499–9508 CrossRef CAS PubMed.
- M. Y. Wong and E. Zysman-Colman, Adv. Mater., 2017, 29, 1605444 CrossRef PubMed.
- H. Uoyama, K. Goushi, K. Shizu, H. Nomura and C. Adachi, Nature, 2012, 492, 234–238 CrossRef CAS PubMed.
- V.-N. Nguyen, A. Kumar, M. H. Lee and J. Yoon, Coord. Chem. Rev., 2020, 425, 213545 CrossRef CAS.
- N. R. Paisley, C. M. Tonge and Z. M. Hudson, Front. Chem., 2020, 8, 1–14 CrossRef PubMed.
- T. Huang, W. Jiang and L. Duan, J. Mater. Chem. C, 2018, 6, 5577–5596 RSC.
- M. Osawa and M. Hoshino, in Highly Efficient OLEDs, Wiley-VCH Verlag GmbH & Co. KGaA, Weinheim, Germany, 2018, pp. 119–176 Search PubMed.
- C. E. Housecroft and E. C. Constable, J. Mater. Chem. C, 2022, 10, 4456–4482 RSC.
- A. Tsuboyama, in Highly Efficient OLEDs, Wiley-VCH Verlag GmbH & Co. KGaA, Weinheim, Germany, 2018, pp. 93–118 Search PubMed.
- M. El Sayed Moussa, S. Evariste, H.-L. Wong, L. Le Bras, C. Roiland, L. Le Polles, B. Le Guennic, K. Costuas, V. W. W. Yam and C. Lescop, Chem. Commun., 2016, 52, 11370–11373 RSC.
- A. Schinabeck, N. Rau, M. Klein, J. Sundermeyer and H. Yersin, Dalton Trans., 2018, 47, 17067–17076 RSC.
- A. V. Artem’ev, M. R. Ryzhikov, I. V. Taidakov, M. I. Rakhmanova, E. A. Varaksina, I. Y. Bagryanskaya, S. F. Malysheva and N. A. Belogorlova, Dalton Trans., 2018, 47, 2701–2710 RSC.
- A. Schinabeck, M. J. Leitl and H. Yersin, J. Phys. Chem. Lett., 2018, 9, 2848–2856 CrossRef CAS PubMed.
- A. V. Artem’ev, E. P. Doronina, M. I. Rakhmanova, O. A. Tarasova, I. Y. Bagryanskaya and N. A. Nedolya, Inorg. Chem. Front., 2019, 6, 671–679 RSC.
- A. Schinabeck, J. Chen, L. Kang, T. Teng, H. H. H. Homeier, A. F. Suleymanova, M. Z. Shafikov, R. Yu, C.-Z. Lu and H. Yersin, Chem. Mater., 2019, 31, 4392–4404 CrossRef CAS.
- A. Y. Baranov, A. S. Berezin, D. G. Samsonenko, A. S. Mazur, P. M. Tolstoy, V. F. Plyusnin, I. E. Kolesnikov and A. V. Artem’ev, Dalton Trans., 2020, 49, 3155–3163 RSC.
- A. V. Artem’ev, M. P. Davydova, A. S. Berezin, M. R. Ryzhikov and D. G. Samsonenko, Inorg. Chem., 2020, 59, 10699–10706 CrossRef PubMed.
- C. Li, W. Li, A. F. Henwood, D. Hall, D. B. Cordes, A. M. Z. Slawin, V. Lemaur, Y. Olivier, I. D. W. Samuel and E. Zysman-Colman, Inorg. Chem., 2020, 59, 14772–14784 CrossRef CAS PubMed.
- M. Matejdes, M. Stöter, R. Czerwieniec, M. Leitl, S. Rosenfeldt, T. Schumacher, J. Albert, M. Lippitz, H. Yersin and J. Breu, Adv. Opt. Mater., 2021, 9, 2100516 CrossRef CAS.
- G. Cheng, D. Zhou, U. Monkowius and H. Yersin, Micromachines, 2021, 12, 1500 CrossRef PubMed.
- C. Sun, L. Llanos, P. Arce, A. Oliver, R. Wannemacher, J. Cabanillas-Gonzalez, L. Lemus and D. Aravena, Chem. Mater., 2021, 33, 6383–6393 CrossRef CAS.
- A. V. Artem’ev, Y. V. Demyanov, M. I. Rakhmanova and I. Y. Bagryanskaya, Dalton Trans., 2022, 51, 1048–1055 RSC.
- S. Igawa, M. Hashimoto, I. Kawata, M. Yashima, M. Hoshino and M. Osawa, J. Mater. Chem. C, 2013, 1, 542–551 RSC.
- A. Tsuboyama, K. Kuge, M. Furugori, S. Okada, M. Hoshino and K. Ueno, Inorg. Chem., 2007, 46, 1992–2001 CrossRef CAS PubMed.
- M. J. Leitl, V. A. Krylova, P. I. Djurovich, M. E. Thompson and H. Yersin, J. Am. Chem. Soc., 2014, 136, 16032–16038 CrossRef CAS PubMed.
- M. J. Leitl, F.-R. Küchle, H. A. Mayer, L. Wesemann and H. Yersin, J. Phys. Chem. A, 2013, 117, 11823–11836 CrossRef CAS PubMed.
- C. Li, C. F. R. Mackenzie, S. A. Said, A. K. Pal, M. A. Haghighatbin, A. Babaei, M. Sessolo, D. B. Cordes, A. M. Z. Slawin, P. C. J. Kamer, H. J. Bolink, C. F. Hogan and E. Zysman-Colman, Inorg. Chem., 2021, 60, 10323–10339 CrossRef CAS PubMed.
- E. Leoni, J. Mohanraj, M. Holler, M. Mohankumar, I. Nierengarten, F. Monti, A. Sournia-Saquet, B. Delavaux-Nicot, J.-F. Nierengarten, N. Armaroli, J.-F. Nierengarten and N. Armaroli, Inorg. Chem., 2018, 57, 15537–15549 CrossRef CAS PubMed.
- S. Keller, A. Prescimone, M.-G. La Placa, J. M. Junquera-Hernández, H. J. Bolink, E. C. Constable, M. Sessolo, E. Ortí and C. E. Housecroft, RSC Adv., 2020, 10, 22631–22644 RSC.
- A. V. Rozhkov, S. N. Eliseeva, S. V. Baykov, L. E. Zelenkov, D. O. Goriachiy and I. V Taydakov, New J. Chem., 2020, 44, 110–120 RSC.
- S. Keller, F. Brunner, J. M. Junquera-Hernández, A. Pertegás, M.-G. La-Placa, A. Prescimone, E. C. Constable, H. J. Bolink, E. Ortí and C. E. Housecroft, ChemPlusChem, 2018, 83, 217–229 CrossRef CAS PubMed.
- C. L. Linfoot, M. J. Leitl, P. Richardson, A. F. Rausch, O. Chepelin, F. J. White, H. Yersin and N. Robertson, Inorg. Chem., 2014, 53, 10854–10861 CrossRef CAS PubMed.
- H. Xu, T. Yang, F. Wang, J. Zhang, X. Zhang, H. Wang and B. Xu, J. Lumin., 2019, 205, 82–86 CrossRef CAS.
- X.-L. Chen, C.-S. Lin, X.-Y. Wu, R. Yu, T. Teng, Q.-K. Zhang, Q. Zhang, W.-B. Yang and C.-Z. Lu, J. Mater. Chem. C, 2015, 3, 1187–1195 RSC.
- T. Teng, J. Xiong, G. Cheng, C. Zhou, X. Lv and K. Li, Molecules, 2021, 26, 1125 CrossRef CAS PubMed.
- G. Li, R. S. Nobuyasu, B. Zhang, Y. Geng, B. Yao, Z. Xie, D. Zhu, G. Shan, W. Che, L. Yan, Z. Su, F. B. Dias and M. R. Bryce, Chem.– Eur. J., 2017, 23, 11761–11766 CrossRef CAS PubMed.
- F. Zhang, Y. Guan, X. Chen, S. Wang, D. Liang, Y. Feng, S. Chen, S. Li, Z. Li, F. Zhang, C. Lu, G. Cao and B. Zhai, Inorg. Chem., 2017, 56, 3742–3753 CrossRef CAS PubMed.
- G. Farias, C. A. M. Salla, R. S. Heying, A. J. Bortoluzzi, S. F. Curcio, T. Cazati, P. L. dos Santos, A. P. Monkman, B. de Souza and I. H. Bechtold, J. Mater. Chem. C, 2020, 8, 14595–14604 RSC.
- S. Brown-Xu, M. Fumanal, C. Gourlaouen, L. Gimeno, A. Quatela, C. Thobie-Gautier, E. Blart, A. Planchat, F. Riobé, C. Monnereau, L. X. Chen, C. Daniel and Y. Pellegrin, Inorg. Chem., 2019, 58, 7730–7745 CrossRef PubMed.
- L. Gimeno, E. Blart, J. Rebilly, M. Coupeau, M. Allain, T. Roisnel, A. Quarré de Verneuil, C. Gourlaouen, C. Daniel and Y. Pellegrin, Chem.–Eur. J., 2020, 26, 11887–11899 CrossRef CAS PubMed.
- M. S. Asano, K. Tomiduka, K. Sekizawa, K. Yamashita and K. Sugiura, Chem. Lett., 2010, 39, 376–378 CrossRef CAS.
- S. F. Sousa, P. A. Fernandes and M. J. Ramos, J. Phys. Chem. A, 2007, 111, 10439–10452 CrossRef CAS PubMed.
- A. J. Cohen, P. Mori-Sanchez and W. Yang, Science, 2008, 321, 792–794 CrossRef CAS PubMed.
- P. Verma and D. G. Truhlar, Trends Chem., 2020, 2, 302–318 CrossRef CAS.
- B. Pinter, A. Chankisjijev, P. Geerlings, J. N. Harvey and F. De Proft, Chem.– Eur. J., 2018, 24, 5281–5292 CrossRef CAS PubMed.
- M. Swart, Int. J. Quantum Chem., 2013, 113, 2–7 CrossRef CAS.
- M. Costas and J. N. Harvey, Nat. Chem., 2013, 5, 7–9 CrossRef CAS PubMed.
- J. N. Harvey, Phys. Chem. Chem. Phys., 2007, 9, 331–343 RSC.
- S. Grimme, R. Huenerbein and S. Ehrlich, ChemPhysChem, 2011, 12, 1258–1261 CrossRef CAS PubMed.
- S. Grimme, W. Hujo and B. Kirchner, Phys. Chem. Chem. Phys., 2012, 14, 4875 RSC.
- S. Paria and O. Reiser, ChemCatChem, 2014, 6, 2477–2483 CrossRef CAS.
- B.-K. Guo, F. Yang, Y.-Q. Wang, Q. Wei, L. Liu, X.-X. Zhong, L. Wang, J.-K. Gong, F.-B. Li, W.-Y. Wong, K. A. Alamry and Y. Zhao, J. Lumin., 2020, 220, 116963 CrossRef CAS.
- R. Czerwieniec, J. Yu and H. Yersin, Inorg. Chem., 2011, 50, 8293–8301 CrossRef CAS PubMed.
- M. Klein, N. Rau, M. Wende, J. Sundermeyer, G. Cheng, C.-M. Che, A. Schinabeck and H. Yersin, Chem. Mater., 2020, 32, 10365–10382 CrossRef CAS.
- M. Osawa, I. Kawata, R. Ishii, S. Igawa, M. Hashimoto and M. Hoshino, J. Mater. Chem. C, 2013, 1, 4375 RSC.
- J. Zhang, C. Duan, C. Han, H. Yang, Y. Wei and H. Xu, Adv. Mater., 2016, 28, 5975–5979 CrossRef CAS PubMed.
- A. Verma, D. M. Zink, C. Fléchon, J. Leganés Carballo, H. Flügge, J. M. Navarro, T. Baumann and D. Volz, Appl. Phys. A, 2016, 122, 191 CrossRef.
- L. Lin, D.-H. Chen, R. Yu, X.-L. Chen, W.-J. Zhu, D. Liang, J.-F. Chang, Q. Zhang and C.-Z. Lu, J. Mater. Chem. C, 2017, 5, 4495–4504 RSC.
- X. Hong, B. Wang, L. Liu, X.-X. Zhong, F.-B. Li, L. Wang, W.-Y. Wong, H.-M. Qin and Y. H. Lo, J. Lumin., 2016, 180, 64–72 CrossRef CAS.
- K. Xu, B. L. Chen, R. Zhang, L. Liu, X. X. Zhong, L. Wang, F. Y. Li, G. H. Li, K. A. Alamry, F. B. Li, W. Y. Wong and H. M. Qin, Dalton Trans., 2020, 49, 5859–5868 RSC.
- M. Wallesch, A. Verma, C. Fléchon, H. Flügge, D. M. Zink, S. M. Seifermann, J. M. Navarro, T. Vitova, J. Göttlicher, R. Steininger, L. Weinhardt, M. Zimmer, M. Gerhards, C. Heske, S. Bräse, T. Baumann and D. Volz, Chem.– Eur. J., 2016, 22, 16400–16405 CrossRef CAS PubMed.
- Q. Wei, H.-T. Chen, L. Liu, X.-X. Zhong, L. Wang, F.-B. Li, H.-J. Cong, W.-Y. Wong, K. A. Alamry and H.-M. Qin, New J. Chem., 2019, 43, 13408–13417 RSC.
- M. Osawa, M. Hoshino, M. Hashimoto, I. Kawata, S. Igawa and M. Yashima, Dalton Trans., 2015, 44, 8369–8378 RSC.
- X.-L. Chen, C.-S. Lin, X.-Y. Wu, R. Yu, T. Teng, Q.-K. Zhang, Q. Zhang, W.-B. Yang and C.-Z. Lu, J. Mater. Chem. C, 2015, 3, 1408 RSC.
| This journal is © The Royal Society of Chemistry 2022 |

