
 Open Access Article
 This Open Access Article is licensed under a Creative Commons Attribution-Non Commercial 3.0 Unported Licence
Temperature non-uniformity detection on dPCR chips and temperature sensor calibration†
Martina Gaňová‡
a,
Xinlu Wang‡b,
Zhiqiang Yan c,
Haoqing Zhangb,
Tomáš Lednickýa,
Marie Korabečnád and
Pavel Neužil*b
c,
Haoqing Zhangb,
Tomáš Lednickýa,
Marie Korabečnád and
Pavel Neužil*b
aCentral European Institute of Technology, Brno University of Technology, Purkyňova 123, 612 00 Brno, Czech Republic
bNorthwestern Polytechnical University, School of Mechanical Engineering, Department of Microsystem Engineering, 127 West Youyi Road, Xi'an, Shaanxi 710072, PR China. E-mail: pavel.neuzil@gmail.com
cNorthwestern Polytechnical University, School of Marine Science and Technology, 127 West Youyi Road, Xi'an, Shaanxi 710072, PR China
dInstitute of Biology and Medical Genetics, First Faculty of Medicine, Charles University and General University Hospital in Prague, Albertov 4, 128 00 Prague, Czech Republic
First published on 17th January 2022
Abstract
A microfluidic-based digital polymerase chain reaction (dPCR) chip requires precise temperature control as well as uniform temperature distribution to ensure PCR efficiency. However, measuring local temperature and its distribution over thousands of μL/nL-volume samples with minimum disturbance is challenging. Here, we present a method of non-contact localized temperature measurement for determination of the non-uniformity of temperature distribution over a dPCR chip. We filled the dPCR chip with a PCR solution containing amplified DNA fragments with a known melting temperature (TM). We then captured fluorescent images of the chip when it was heated from 70 to 99 °C, plotted the fluorescence intensity of each partition as a function of temperature, and calculated measured TM values from each partition. Finally, we created a 3-D map of the dPCR chip with the measured TM as the parameter. Even when the actual TM of the PCR solution was constant, the measured TM value varied between locations due to temperature non-uniformity in the dPCR chip. The method described here thereby characterized the distribution of temperature non-uniformity using a PCR solution with known TM as a temperature sensor. Among the non-contact temperature measurement methods, the proposed TM-based method can determine the temperature distribution within the chip, instead of only at the chip surface. The method also does not suffer from the undesirable photobleaching effect of fluorescein-based temperature measurement method. Temperature determination over the dPCR chip based on TM allowed us to calibrate the temperature sensor and improve the dPCR configuration and precision. This method is also suitable for determining the temperature uniformity of other microarray systems where there is no physical access to the system and thus direct temperature measurement is not possible.
Introduction
Over the past few decades, the development of microfluidics1 has enabled new technologies such as digital polymerase chain reaction (dPCR).2 dPCR was originally developed to perform absolute deoxyribonucleic acid (DNA) quantification of a sample.3,4 dPCR can also detect rare DNA sequences among a background of abundant ones.5 The PCR master mix, combined with target DNA molecules, is compartmentalized into thousands of micro/nano partitions. The target DNA molecules are distributed into those partitions such that, statistically, either none or one DNA copy is present in each partition. Thermal cycling is then performed to amplify the number of targets to a fluorescently detectable level.6Temperature uniformity between partitions is critical as the temperature during thermal cycling affects PCR efficiency.7 The thermal uniformity of the dPCR device depends on its heating/cooling elements and the thermal conductance between the elements.8 The most commonly used heating/cooling techniques are based on thermoelectric coolers (TEC).9 Other techniques, based on different principles, can also be used such as photonic heating with airflow cooling.10 Additional problems arise from non-uniform temperature distribution11 due to insufficient heat transfer or non-uniform cooling in open systems such as those using air convection.12 This is a significant problem as the relative PCR efficiency between partitions is strongly affected by poor temperature uniformity during thermal cycling.13
Therefore, each dPCR assay must be optimized carefully and reasons causing false positive signals are more easily detectable than the causes of false negative partitions. Attempts to prevent false negative dropouts mainly focus on optimizing the surface to volume ratio of partitions, which potentially inhibit PCR process, or on pre-analytical steps associated with the preparation of the DNA template.14 When optimizing dPCR on a chip, thermal non-uniformity is usually not considered as measurement of sample temperature (TS) inside partitions with a sample volume of pico-/nano-liters is a challenging job.15,16 An accurate system to calibrate a temperature sensor with respect to the fluid inside the partitions, and enable determination of the temperature distribution over the dPCR chip, or even between the partitions, would benefit the optimization of temperature uniformity,17 thus improving PCR efficiency.
TS can be measured by contact or non-contact methods. Contact methods primarily use temperature sensors10,18,19 such as resistive temperature detectors (RTD),20 thermistors19 or thermocouples21 for point measurement. However, it is impossible to determine TS within a single micro/nano partition using those sensors due to the size limitations.22,23 The most popular non-contact temperature measurement method is based on an emitted infrared (IR) power determination.10,19 This only determines the power of the IR radiation emitted from the surface, which for these chips is typically that of a glass covering the partitions inside the chip, meant to prevent water evaporation from the PCR master mix.24 Unfortunately the glass is not transparent at IR wavelengths, making it impossible to determine the temperature (T) of the master mix, which is the most critical information for optimal PCR operation. The measurement precision can also be affected by surface contamination.
Other non-contact temperature measurement methods use the fluid in the partitions as a sensing element, via the inclusion of thermochromic dyes, such as organic leuco dyes, with specific temperature-dependent optical properties.25 However, these methods are restricted to temperatures up to ≈50 °C, insufficient for dPCR applications. An obvious alternative would seem to be fluorescein, as its amplitude of fluorescence (F) is a function of T,26 and fluorescence measurements are compatible with the instrumentation used for dPCR quantification. Unfortunately, this technique is susceptible to photobleaching and thus the system cannot be calibrated for precise temperature determination.
An alternative fluorescence measurement technique, based on melting curve analysis (MCA) of DNA, has been utilized.27 At the melting temperature (TM) of DNA, ≈50% of the double-stranded DNA is denatured, leading to a drop in the emitted F value.28 The TM depends only on the composition of the DNA template and the PCR master mix, making it independent of photobleaching. The F value decreases with exposure time, however the first derivation of the melting curves with respect to TS provides the constant value of TM with minimal deviation.27 This MCA-based non-contact temperature measurement technique was previously applied to determine the temperature uniformity inside of the microfluidic channel of a microcalorimeter, and the device was subsequently calibrated accordingly.22,29
Here we proposed a non-contact temperature sensing technique based on MCA to determine the temperature non-uniformity of the fluid within the micro partitions of a dPCR chip. We also used this technique to calibrate temperature sensor using two points calibration. The proposed method is non-contact thus it does not affect the temperature of the device such as contact methods do. It measures temperature of the fluid, which is the temperature of interest instead of infrared technique measuring only radiation from the surface. Finally the MCA-based technique is not suffering from undesirable photobleaching effect such as earlier used fluorescein-based temperature measurement method.
This method provided information about T inside the partitions where precision is required. We loaded the dPCR chip with the PCR master mix after amplification and then captured fluorescence images of the chip in the temperature range from 70 to 99 °C. We subsequently performed image processing to extract and plot the F values of each partition as a function of T. We then performed MCA and extracted TM values from each partition. We finally plotted the TM values as a function of partition location, determining the temperature distribution over the dPCR chip. Our method of determining temperature uniformity is particularly suitable for microfluidic systems where access for even a miniaturized temperature sensor is challenging or impossible. Once the temperature distribution of the device has been determined, should there be any undesirable variation or other non-uniformity, researchers can check the heat transfer system and improve it to ensure that the system functions properly.
Materials and methods
dPCR chip design
We used a (9 × 9) mm2 dPCR chip with 26![[thin space (1/6-em)]](https://www.rsc.org/images/entities/char_2009.gif) 448 partitions, each with a target diameter of 50 μm, split into 6 blocks. The chip was designed using script-based Nanolithography Toolbox24,30 and manufactured from a Si wafer using a single lithography step followed by deep reactive ion etching with a target depth of 30 μm (Fig. 1A).24
448 partitions, each with a target diameter of 50 μm, split into 6 blocks. The chip was designed using script-based Nanolithography Toolbox24,30 and manufactured from a Si wafer using a single lithography step followed by deep reactive ion etching with a target depth of 30 μm (Fig. 1A).24
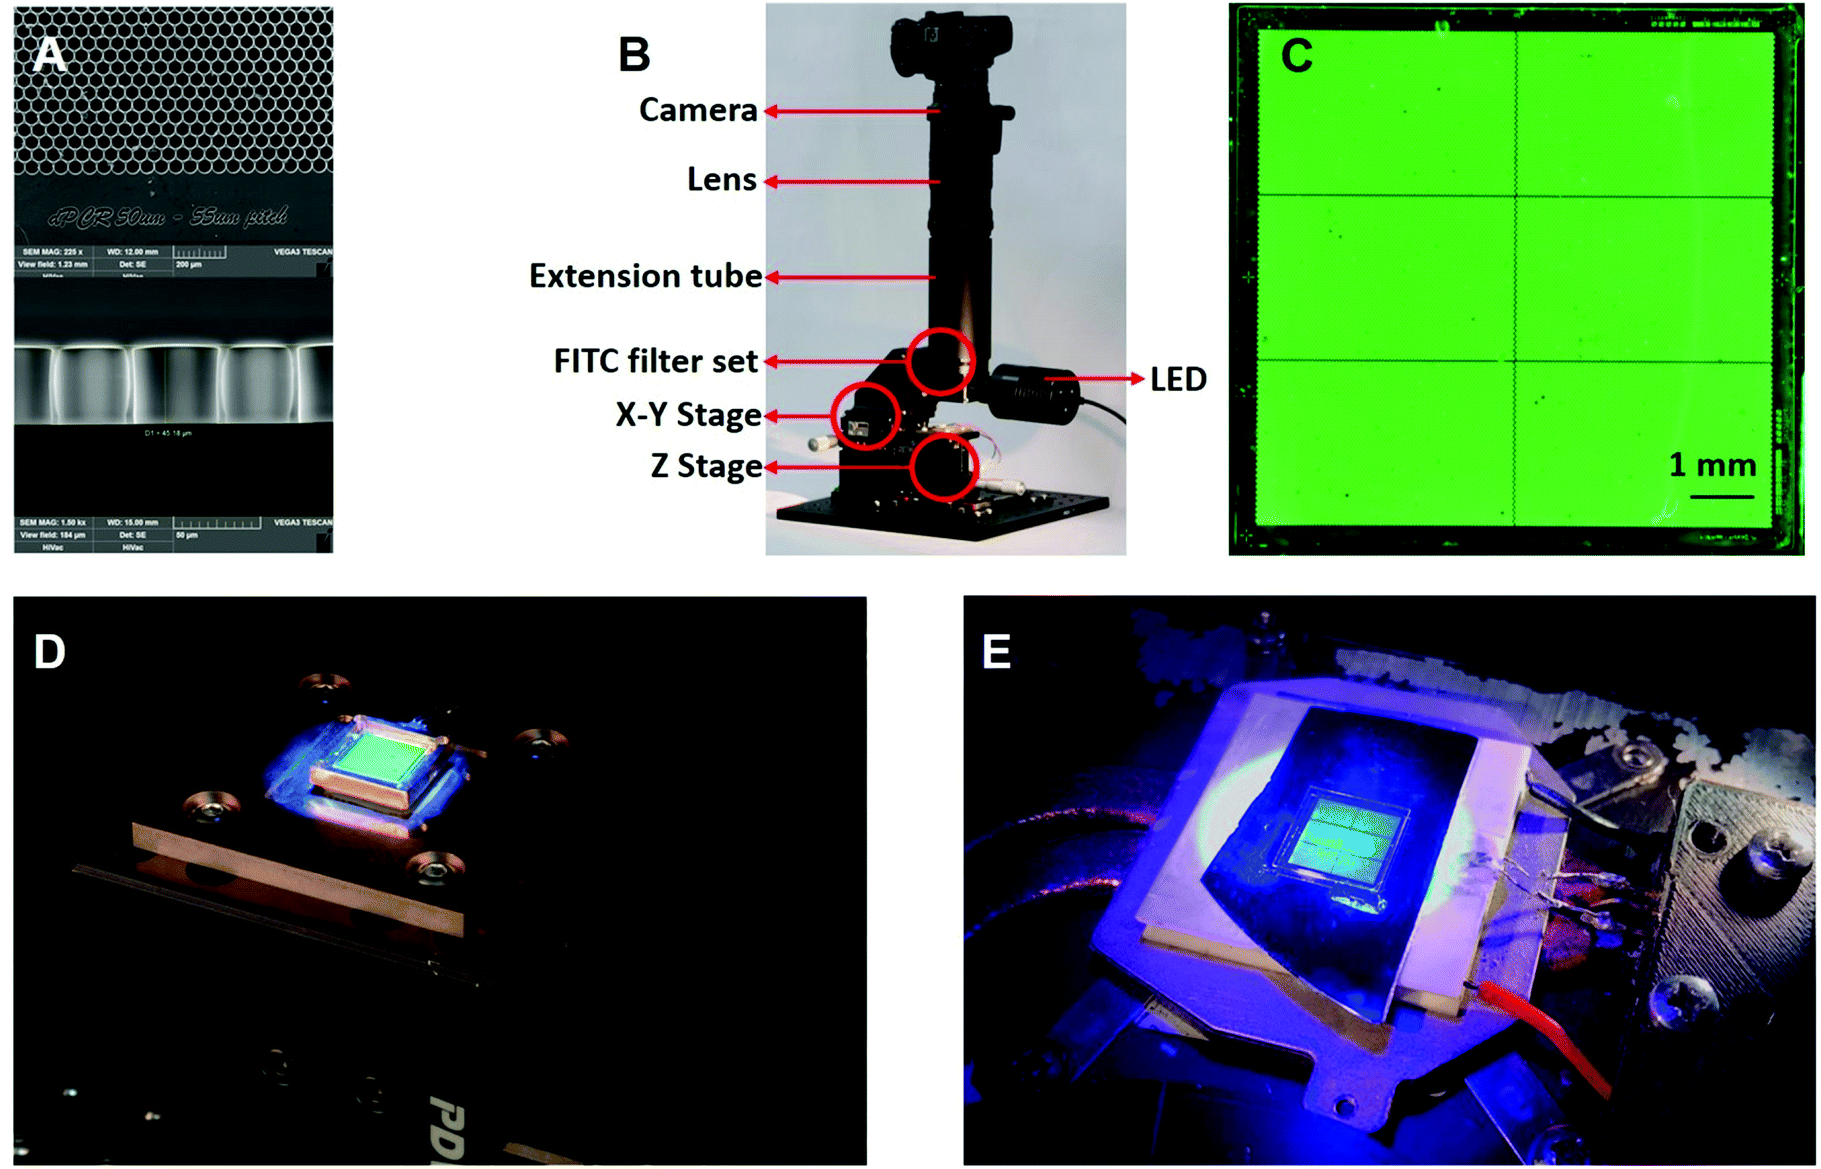 | ||
| Fig. 1 The dPCR testing configuration. (A) Images from scanning electron microscope showing small portion of a chip with designed diameter of 50 μm and target depth of 30 μm. (B) Photograph of dPCR hardware consisting of Z-stage for the sample, including TEC and RTD. The sample is illuminated via the fluorescent cube by an LED. A fluorescent image of the chip is captured by an SLR camera via a spacer tube, macro lens and a 1.4× extension. (C) Fluorescent image at 25 °C of a chip filled with fluorescein. (D) Photograph of dPCR chip placed in a brass holder on top of TEC (dPCR configuration A) and (E) dPCR chip placed on a silicon wafer instead of the brass interface (dPCR configuration B). | ||
dPCR configuration
We designed two dPCR configurations with different interfaces between the chip and the TEC. Configuration A had a brass interface between the TEC and the dPCR chip, while configuration B used a silicon wafer. The Si wafer also helped to remove an undesirable high background signal, as the original white surface of the TEC was dispersing light which then penetrated through the optical filters. Both configurations were consisted of a fluorescence imaging system (Fig. 1B) using a fluorescein isothiocyanate (FITC) cube to process a fluorescence image obtained from a dPCR chip filled with fluorescein (Fig. 1C). The cube was mounted on an X–Y stage with a light-emitting diode (LED) with a nominal principal wavelength and maximum power of 470 nm and 30 W, respectively. The optical power was controlled by an LED controller using pulse-width modulation (PWM). The image was captured by a commercial complementary metal oxide semiconductor single-lens reflex (SLR) camera, with a full-frame image size of (35 × 24) mm2 and 26 megapixels capable of 16-bit resolution. The camera was attached to the cube via a 1.4× image extender, a macro lens with a focal length of 180 mm, a minimum aperture of 3.5, and an extension tube with a length of 150 mm. The standard fluorescence microscope equipped with FITC filter set can be used instead of our system. The problem is smaller field of view which is given by the optics. The objective lenses with largest field of view are typically 1.3× or similar and they provide 13× magnification with a field of view of a few mm. As a result, the entire chip cannot be observed.The TEC was powered by electrical current pulses using an H-bridge system. The temperatures of the brass plate (Fig. 1D) and the TEC itself (Fig. 1E) were monitored with an RTD-type Pt100 temperature sensor. Temperature was controlled via PWM from a personal computer using software based on proportional integral derivative regulation. The dPCR chip, with a TEC, was placed on another brass plate equipped with a fan for cooling. The bottom part of the TEC was mounted on a Z-stage located on two sliders, allowing convenient dPCR chip filling and replacements. The dPCR chip was placed either in a brass holder on top of the TEC (configuration A) or directly on the TEC surface with silicon wafer interface (configuration B), yielding different chip temperature uniformity. We assembled two systems with different configurations just to demonstrate the different temperature distribution between two different types of system using the proposed method.
Data acquisition and processing
The entire data acquisition process (Fig. 2A) started with real-time PCR (qPCR) sample preparation by mixing PCR master mix with the DNA template, amplification, and performing MCA (Fig. 2B) to determine TM of the sample. Then the dPCR chip was filled with this solution (Fig. 1C) and fluorescent images of the chip at various temperatures were captured. Further details of these steps are described below.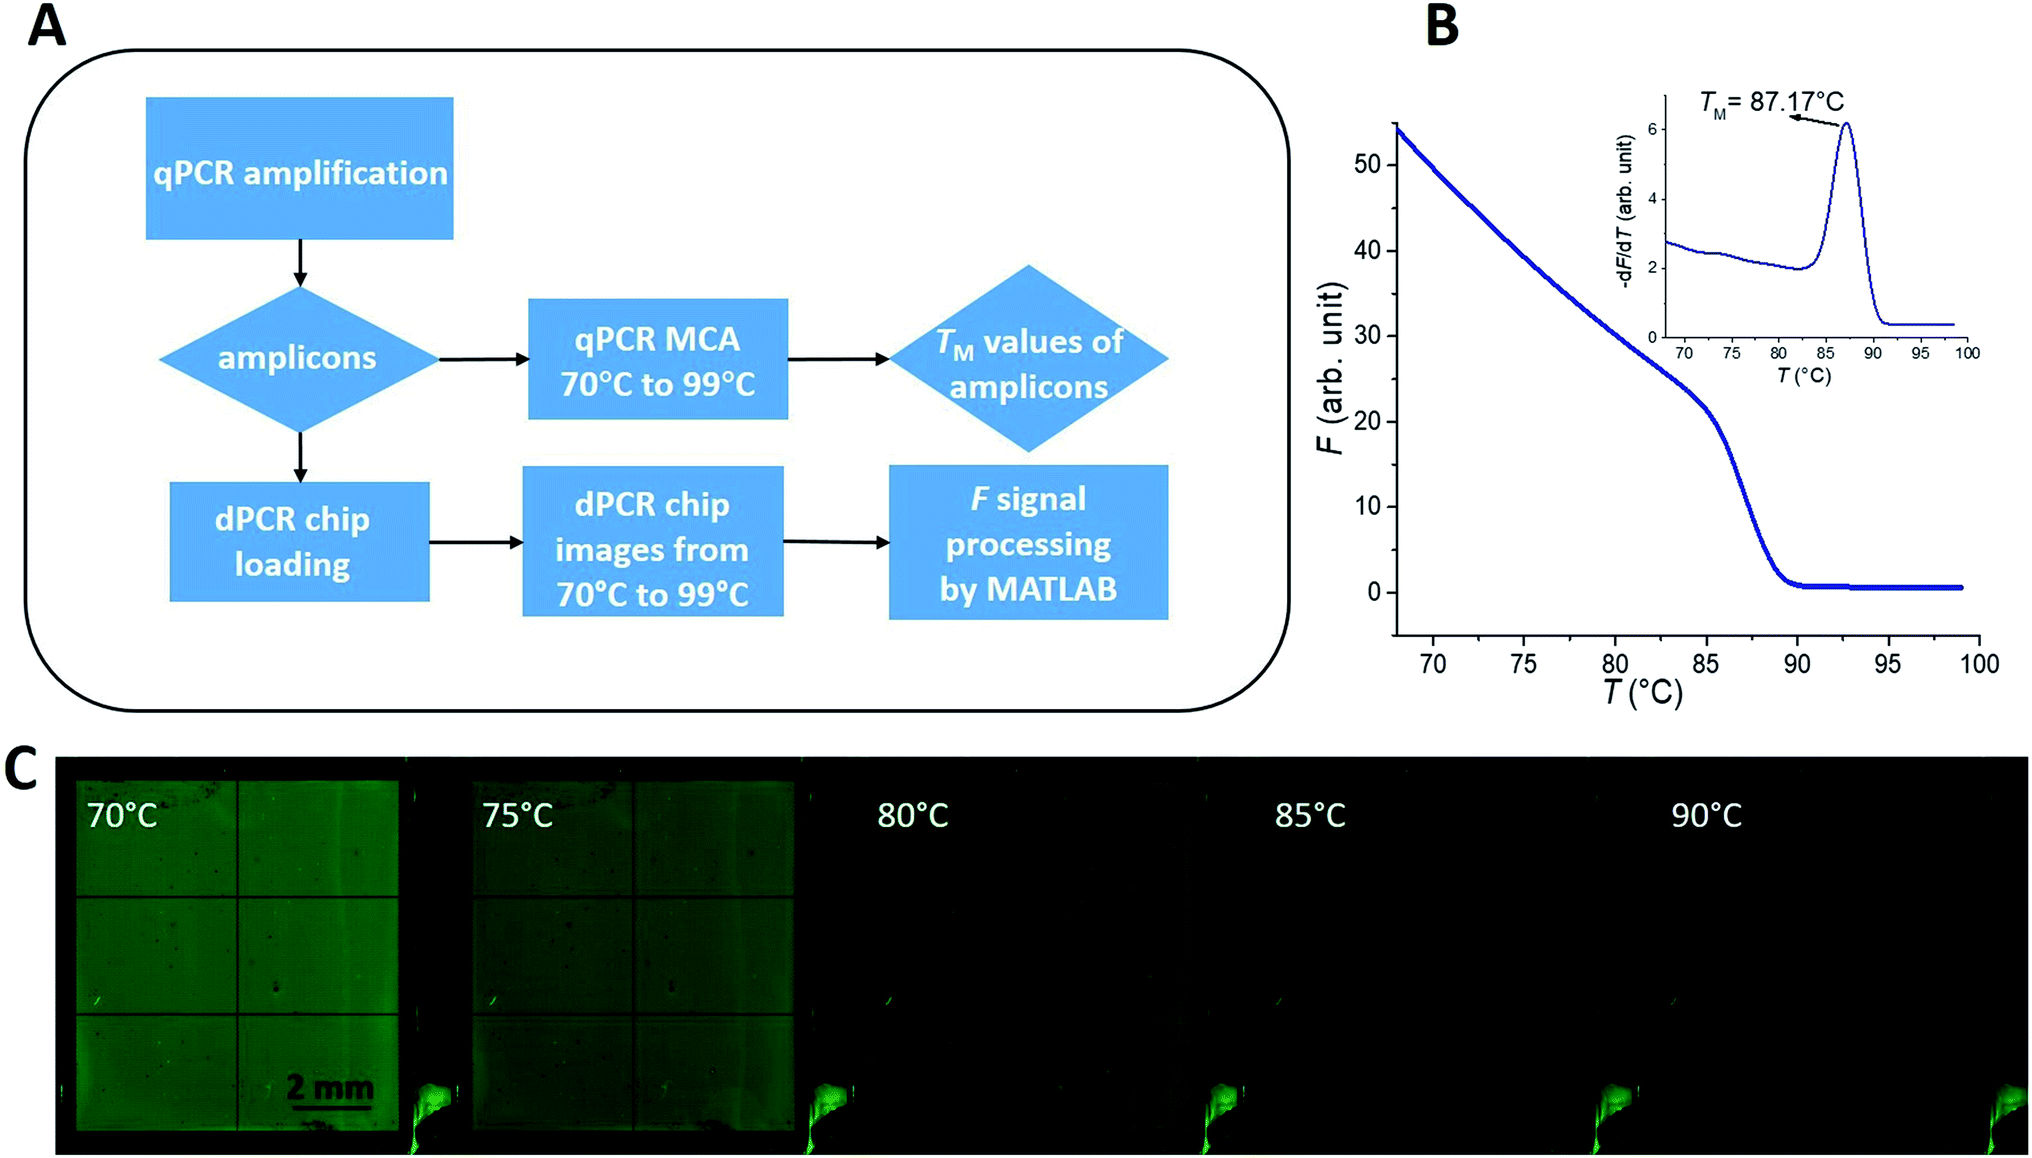 | ||
| Fig. 2 (A) Schematic diagram of data acquisition. The diamonds represent the output results of measurement or data processing, and the rectangles represent the measurement method or data processing method. (B) The hepatitis B virus (HBV) gene melting curve and its derivative after amplification from a commercial qPCR thermal cycler. (C) Five fluorescent images of the dPCR chip, at different values of T, loaded with the PCR amplicons and covered with mineral oil and a cover glass as an example. | ||
PCR master mix and the PCR protocol
The PCR master mix consisted of ≈0.3 μL Taq polymerase, ≈2 μL of PCR buffer with deoxyribonucleotides, ≈0.1 μL of bovine serum albumin solution, ≈0.5 μL of EvaGreen, and ≈0.4 μL of each of the forward and reverse primers (Table 1). Synthetic DNA of HBV and chromosome 21 (Chr21) were used as the target DNAs. The HBV target belonged to the C section of the gene and the target location was from 1469 to 1570. The Chr21 target location was from 14099141 to 14099218 in the human genomic DNA. Finally, we adjusted the final volume of the PCR master mix to ≈10 μL by adding sterilized water.
We performed the following PCR protocol using a commercial qPCR instrument: a hot start for 120 s at 95 °C, followed by 40 cycles of three-step PCR amplification consisting of denaturation for 15 s at 95 °C, annealing for 15 s at 56 °C, and extension for 30 s at 72 °C, followed by MCA from 65 to 95 °C. We then plotted F as a function of T (Fig. 2B for HBV as an example), thereby obtaining the melting temperature of HBV (TMB) equal to (87.17 ± 0.04) °C (mean ± standard deviation [σ] from 7 measurements), as shown in an inset of Fig. 2B. We also performed the same experiment for the Chr21 gene target, obtaining its melting temperature (TMC) equal to (83.69 ± 0.20) °C (mean ± σ from 16 measurements) as described in ESI Section A.†
We pipetted ≈4 μL of the amplified sample onto the edge of the dPCR chip, and the sample was then spread by the glass to fill each partition of the chip. Then ≈10 μL of mineral oil was pipetted on the edge of the cover glass, coated with parylene and polydimethylsiloxane,24 and placed on top of the dPCR chip to cover the sample in the micro partitions and prevent the sample's evaporation. The Chr21 and HBV genes were tested with dPCR configuration A and dPCR configuration B, respectively.
dPCR MCA measurement
The loaded dPCR chip, with the amplicons covered with mineral oil and cover glass, was placed under the dPCR configuration to perform MCA. We set the lens aperture to 8.0 and the camera exposure time to 15 s, with sensitivity set to the international organization for standardization (known as ISO) of 200. Then we captured the F images of the dPCR chip at different values of TS, starting at 25 °C and then in the range from 70 to 99 °C with examples shown in Fig. 2C and details in ESI Section B.†Results and discussion
We used a MATLAB-based script to process the F values after taking a series of images at various temperatures below and above TM (Fig. 3) for both targets and the MATLAB scripts are in ESI Section C.† We first extracted the average F values of each partition (Fi) at given T from all images and saved them into a file set. We subsequently performed a piecewise cubic interpolation at an interval set to 0.01 °C on the file set and obtained the Fi values of each partition as a function of assumed T, extracting MCAs from all partitions of the chip. Then we performed the −dF/dT and acquired the measured TM values of each partition.
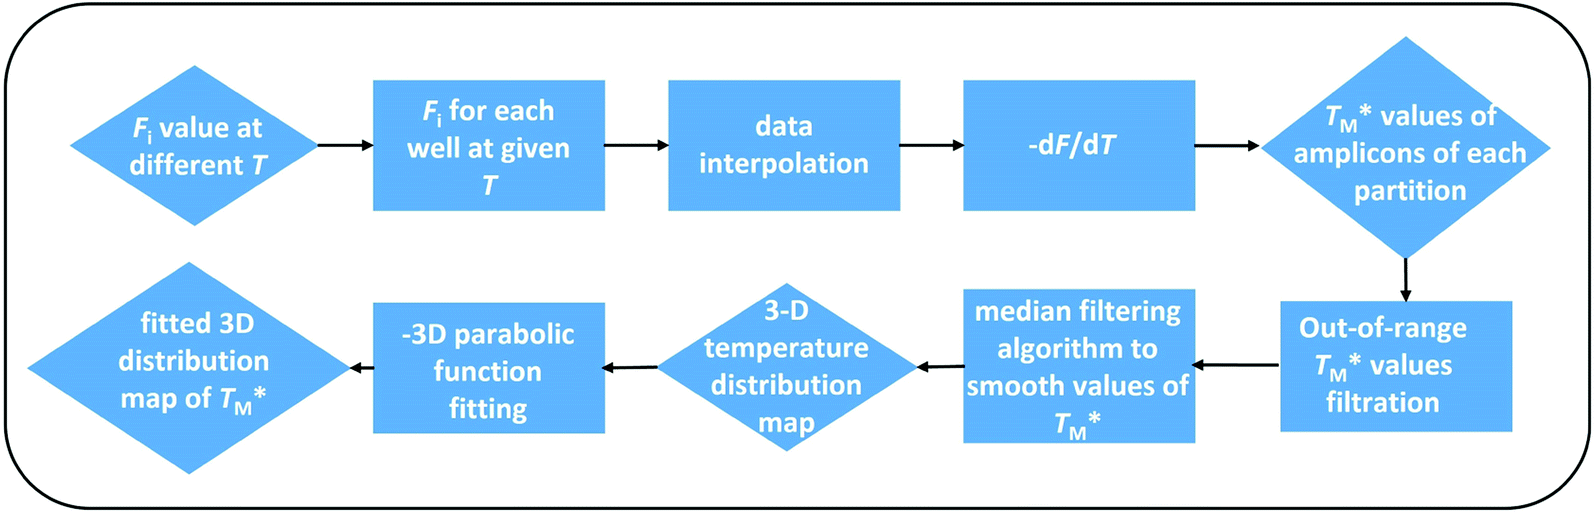 | ||
Fig. 3 Block diagram showing the data processing MATLAB script used to obtain the distribution of  The script evaluated simultaneous MCA at each partition over the whole dPCR chip. The script evaluated simultaneous MCA at each partition over the whole dPCR chip. | ||
We assumed that the  values deviated from the mean value of TM in surrounding partitions by more than 1 °C were due to defects such as empty partitions, flaws in the cover glass or chip damage. These out-of-range
  values were not considered in calculations. Damaged chip or glass could also be replaced to remove the out-of-range
  values. A few melting curves from partitions for both targets (HBV, Chr21) were shown in the ESI Section D.†
Subsequently, we built a discrete 3D  distribution map as a function of partition positions, followed by a median filtering algorithm to smooth the map (Fig. 4A and C) for both targets. Then we performed 3D parabolic function fitting on the 3D map and constructed the fitted 3D
  distribution map (Fig. 4B and D) of the dPCR chip. The fitted 3D map with continuity here showed a trend in dPCR chip temperature distribution more clearly than the original data, which is particularly clear in Fig. 4B with a distinguishable temperature gradient across the dPCR chip.
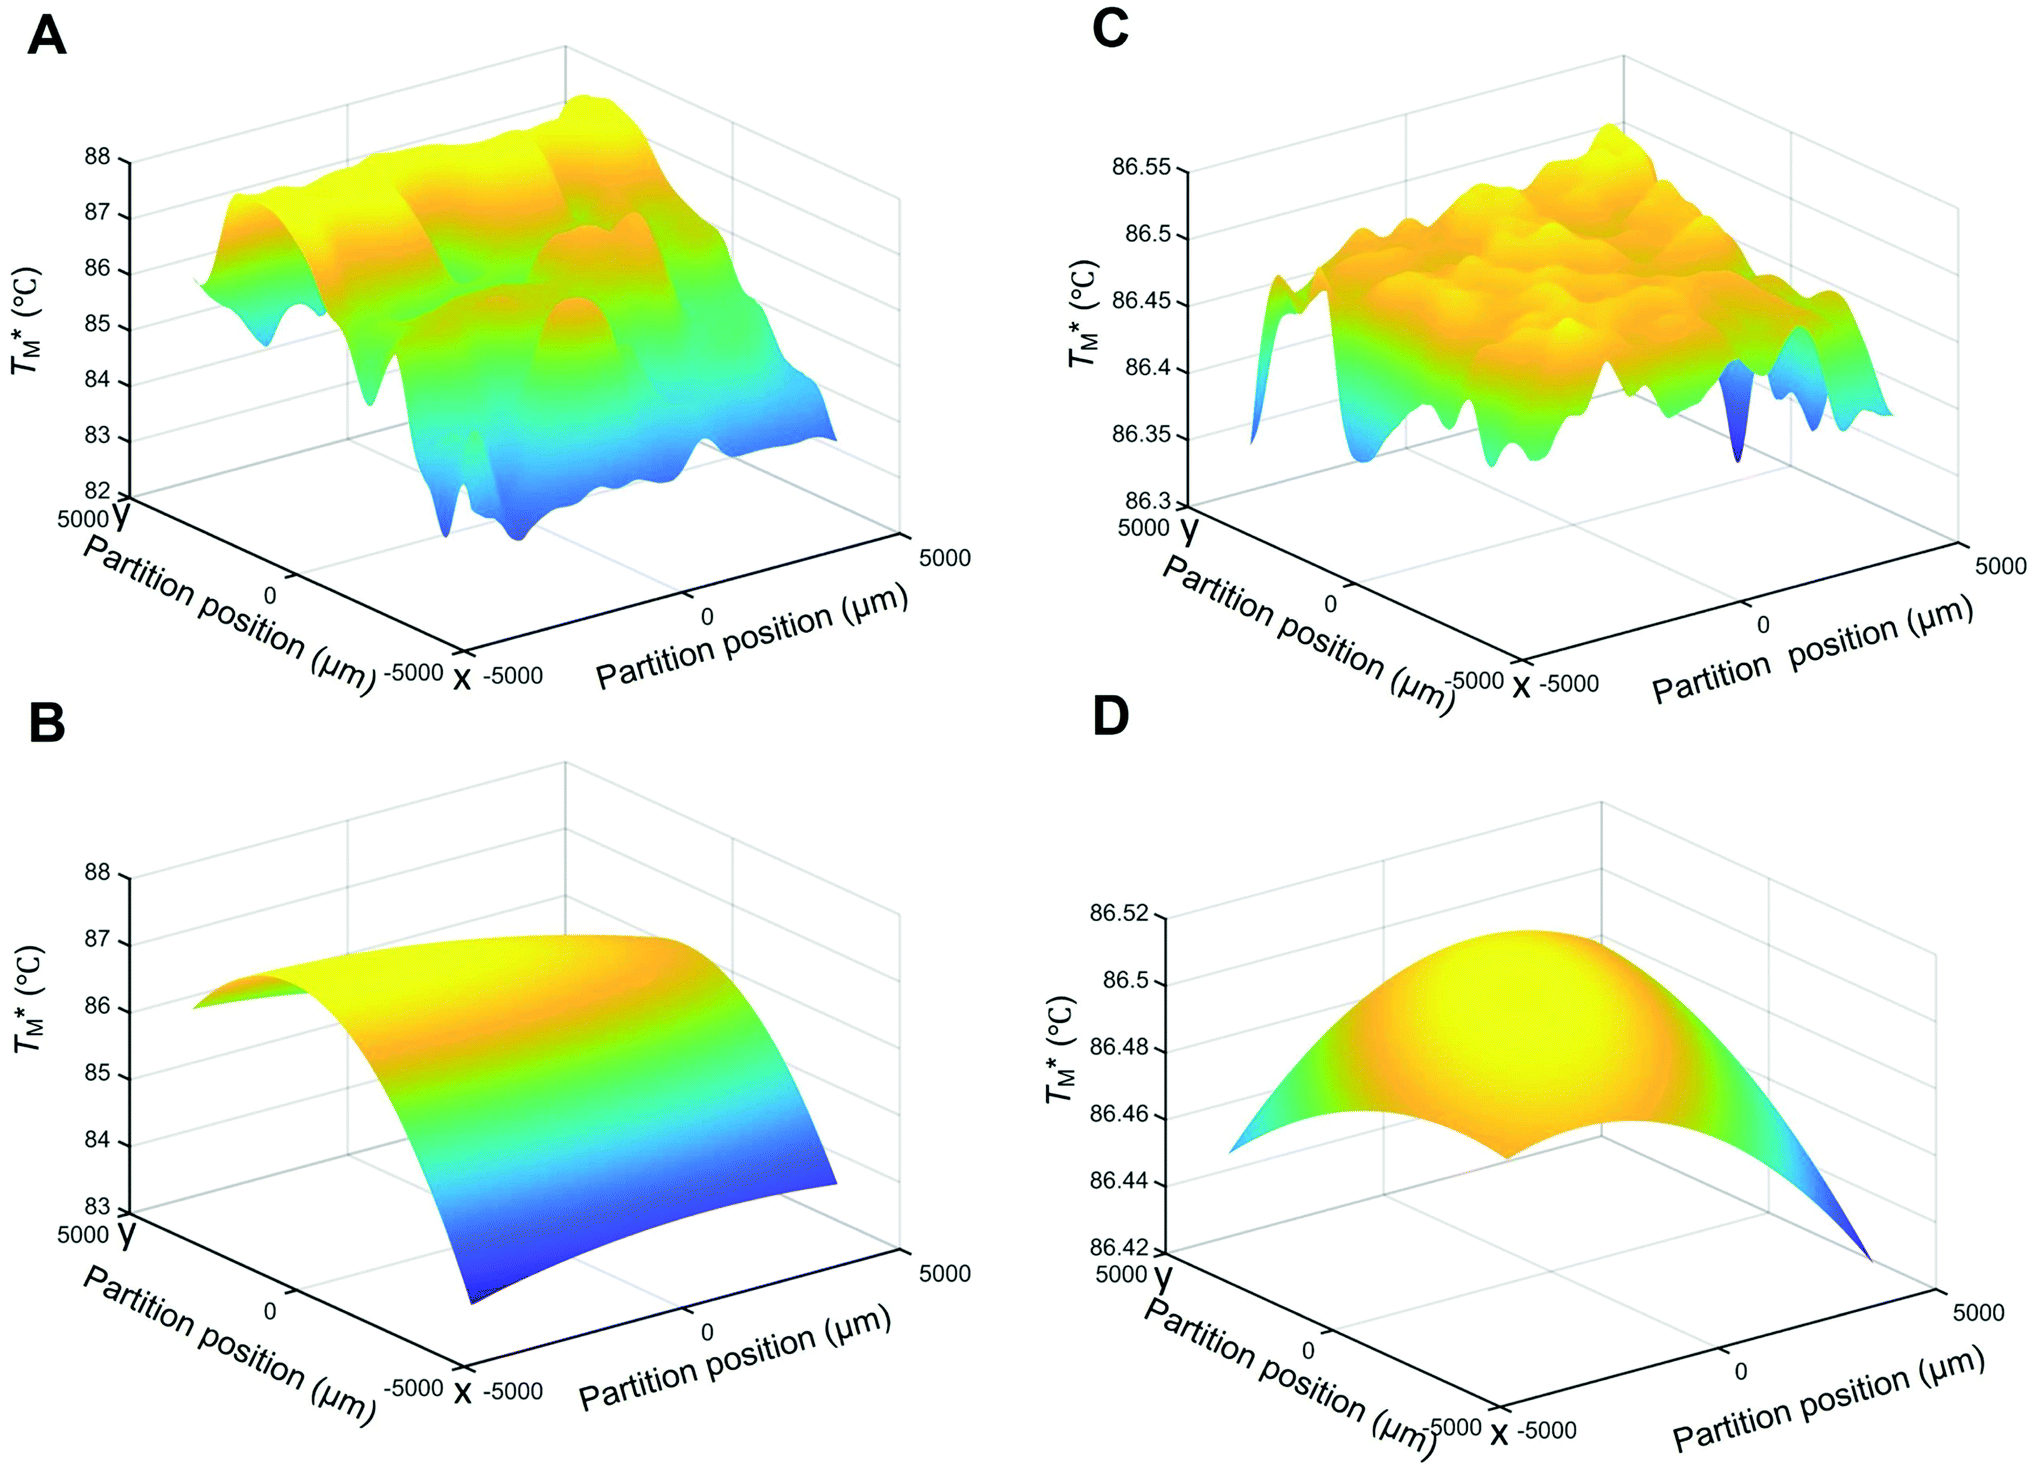 | ||
Fig. 4 Temperature distribution maps of  (A) with Chr21 target gene based on dPCR configuration A showing the original 3D map and (B) map after parabolic fitting. (C) Original 3D map and (D) fitted map of HBV target gene based on dPCR configuration B, demonstrating the superiority of configuration B over configuration A. (A) with Chr21 target gene based on dPCR configuration A showing the original 3D map and (B) map after parabolic fitting. (C) Original 3D map and (D) fitted map of HBV target gene based on dPCR configuration B, demonstrating the superiority of configuration B over configuration A. | ||
The mean  value and deviation were estimated from the
  values (Fig. 4A and C) through fitting to a Gauss distribution function. The
  of Chr21 (
 was ≈ 3.28 °C. Configuration B yielded
  equal to (86.49 ± 0.08) °C and the difference between TMB and
  was only ≈0.68 °C. This shows a better temperature homogeneity across the dPCR chip from configuration B (Fig. 4C and D) extending over the whole configuration, including the RTD sensor. Configuration A exhibits a temperature difference of ≈9 °C between the coldest and the warmest parts of the chip. Such a large temperature variance is clearly unsuitable for feasible dPCR.
The major difference between configurations was the size of TEC elements, (12 × 12) mm2 (A) vs. (30 × 30) mm2 (B), in respect to the (9 × 9) mm2 dPCR chip and the chip substrate. Configuration A used a brass block while configuration B utilized a piece of Si wafer as interface between the TEC and the dPCR chip. The contributing effects to the large dPCR chip temperature nonuniformity were presumably insufficient heat transfer, non-uniform thermal conductance, the heat capacity of the substrate, and the cooling of chip and substrate edges by the surrounding air.
We created an equivalent 3D temperature map of the chip (Fig. 4C and D) from configuration B. This configuration, with a (30 × 30) mm2 TEC and a piece of Si wafer as an interface between the TEC and the dPCR chip, has a superior performance compared to configuration A. Its σ value of fitting error was only 0.08 °C and the temperature difference between the cold and hot parts of the dPCR chip was only ≈0.22 °C. It demonstrated that the temperature fluctuation across the chip was either ≈0.22 °C or smaller. These data demonstrated that the heat transfer between the TEC and the dPCR chip was significantly better with the Si interface compared to the brass interface. All temperature data are summarized in Table 2.
| Configuration | Target gene | Room T (°C) | Sensor (°C) | TM by qPCR (°C) |
|
|
Min
|
Max
|
|---|---|---|---|---|---|---|---|---|
| A | Chr21 | 22.4 | 22.6 | 83.69 ± 0.20 | 86.97 ± 1.14 | 3.28 | 82.00 | 90.98 |
| B | HBV | 19.0 | 14.6 | 87.17 ± 0.04 | 86.49 ± 0.08 | 0.68 | 86.30 | 86.52 |


The difference in  and TM values between these configurations shows the importance of sensor calibration. This was also demonstrated earlier, when the readout of the RTD sensor calibrated traditionally differed from the actual fluid T by almost 10 °C.22 We used
  relative to TM as the first calibration point (Fig. 5A). The second calibration point was obtained by comparison of the integrated RTD sensor value with an external thermometer with, the configuration being measured having the power for the TEC off, thus assuring the temperature of the dPCR chip had equalized with the ambient environment (Fig. 5B).
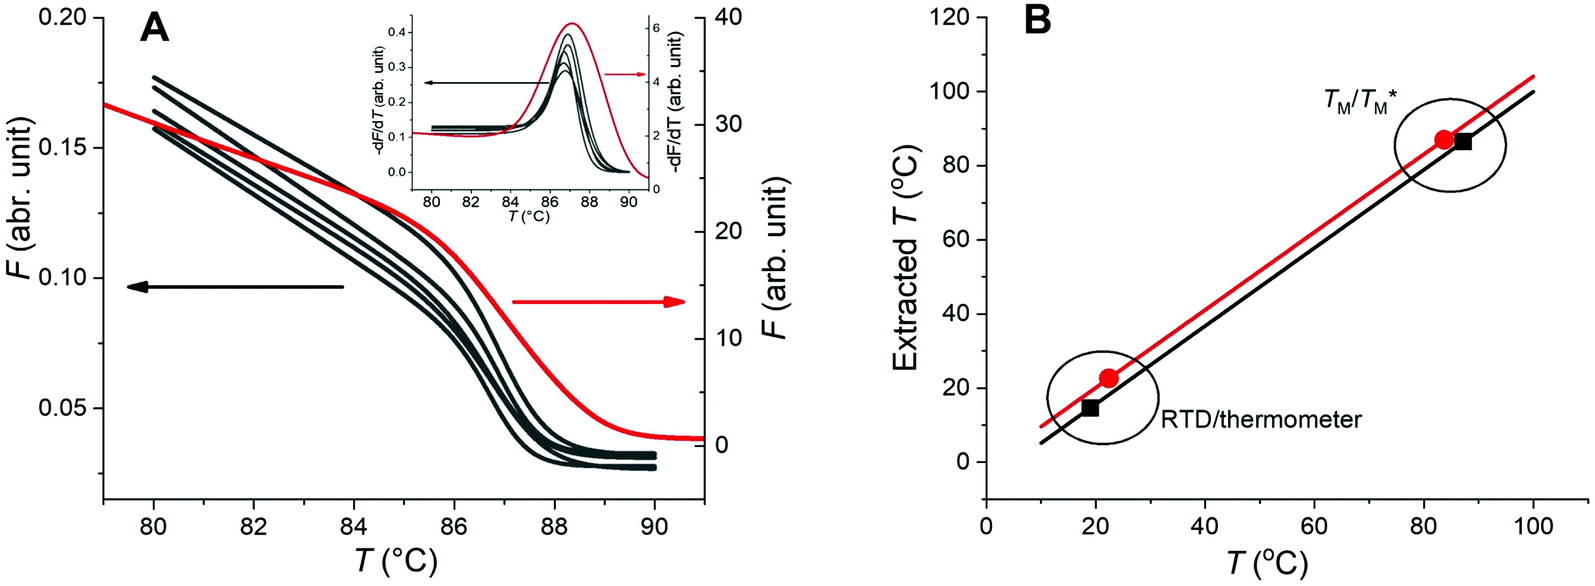 | ||
| Fig. 5 Two-point calibration of the temperature sensor for configurations A and B. (A) MCA from qPCR (red) and MCAs from dPCR (black) and their −dF/dT values (inset), again with qPCR data in red. (B) Calibration curves for configurations A (red) and B (black). | ||
The prevention of temperature non-uniformity on a dPCR chip is extremely important during assay optimization. It can contribute to the elimination of false negative partitions and to the removal of the so-called rain caused by inaccurate annealing temperature in the rain-forming partitions. The presence of this artifact makes it very difficult to interpret the results as it complicates the correct setting of the fluorescence threshold between positive and negative partitions.31 Our proposed MCA-based non-contact temperature measurement method provided an option to determine the temperature non-uniformity on a dPCR chip and it helped for the subsequent temperature non-uniformity optimization.
In principle we might measure both systems using both, HBV as well as Chr21, but the temperature distribution of the chip only depends on the system configurations and not the target thus single target measurement is sufficient.
Conclusion
This proposed MCA-based temperature determination at the dPCR chip surface offers a specific, precise, and photobleaching-independent method of TM measurement to calibrate the system temperature sensor with respect to the liquid inside the dPCR chip partitions. It is not affected by the heat capacitance of the temperature probe or the small sample size as with traditional temperature sensors. The proposed technique allowed us to generate 3-D temperature maps showing temperature distribution in a dPCR chip with micro-partitions, each with a diameter of 50 μm. The presented method also allowed us to digitally define the temperature fluctuation of each partition at the dPCR chip surface and obtain the overall distribution of the temperature profile. This provides the ability to calibrate the temperature sensor based on MCA and determine the temperature homogeneity of the dPCR chip. Knowing that there is a problem with either the temperature or its inhomogeneity gives engineers a guide to redesign the system to correct these values and thus improve dPCR accuracy. The proposed method can also be applied to various microfluidic platforms and microarray systems to calibrate their temperature sensors and improve their temperature uniformity.Conflicts of interest
There are no conflicts to declare.Acknowledgements
We were supported by grant no. 2018YFE0109000 from the Ministry of Science and Technology of the P. R. of China. M.K. acknowledges support by grant no. LTACH19005 from the Ministry of Education, Youth, and Sports of the Czech Republic and M. G. and T. L. acknowledge support from CzechNanoLab Research Infrastructure by grant MEYS CR (LM2018110).References
- J. Wu, R. Kodzius, W. Cao and W. Wen, Microchim. Acta, 2014, 181, 1611–1631 CrossRef CAS.
- B. Vogelstein and K. W. Kinzler, Proc. Natl. Acad. Sci. U. S. A., 1999, 96, 9236–9241 CrossRef CAS PubMed.
- C. M. Hindson, J. R. Chevillet, H. A. Briggs, E. N. Gallichotte, I. K. Ruf, B. J. Hindson, R. L. Vessella and M. Tewari, Nat. Methods, 2013, 10, 1003–1005 CrossRef CAS PubMed.
- R. Sanders, J. F. Huggett, C. A. Bushell, S. Cowen, D. J. Scott and C. A. Foy, Anal. Chem., 2011, 83, 6474–6484 CrossRef CAS PubMed.
- I. Hudecova, Clin. Biochem., 2015, 48, 948–956 CrossRef CAS PubMed.
- M. Gaňová, H. Zhang, H. Zhu, M. Korabečná and P. Neužil, Biosens. Bioelectron., 2021, 181, 113155 CrossRef PubMed.
- J. Khandurina, T. E. McKnight, S. C. Jacobson, L. C. Waters, R. S. Foote and J. M. Ramsey, Anal. Chem., 2000, 72, 2995–3000 CrossRef CAS PubMed.
- V. Miralles, A. Huerre, F. Malloggi and M.-C. Jullien, Diagnostics, 2013, 3, 33–67 CrossRef PubMed.
- K. R. Sreejith, C. H. Ooi, J. Jin, D. V. Dao and N.-T. Nguyen, Lab on a Chip, 2018, 18, 3717–3732 RSC.
- C. D. Ahrberg, J. W. Choi, J. M. Lee, K. G. Lee, S. J. Lee, A. Manz and B. G. Chung, Lab Chip, 2020, 20, 3560–3568 RSC.
- C.-y. Mao, R.-s. Chen, Y.-s. Chen, 1st Electronic Systemintegration Technology Conference, 2006, vol. 2, pp. 1242–1248 Search PubMed.
- H. Nagai, Y. Murakami, K. Yokoyama and E. Tamiya, Biosens. Bioelectron., 2001, 16, 1015–1019 CrossRef CAS PubMed.
- T.-M. Hsieh, C.-H. Luo, F.-C. Huang, J.-H. Wang, L.-J. Chien and G.-B. Lee, Sens. Actuators, B, 2008, 130, 848–856 CrossRef CAS.
- P.-L. Quan, M. Sauzade and E. Brouzes, Sensors, 2018, 18, 1271 CrossRef PubMed.
- E. T. Lagally, P. C. Simpson and R. A. Mathies, Sens. Actuators, B, 2000, 63, 138–146 CrossRef CAS.
- C.-Y. Lee, G.-B. Lee, H.-H. Liu and F.-C. Huang, Int. J. Nonlinear Sci. Numer. Simul., 2002, 3, 215–218 CrossRef CAS.
- Y. Wang, Q. Zhang, R. Tao, D. Chen, J. Xie, H. Torun, L. E. Dodd, J. Luo, C. Fu and J. Vernon, Sens. Actuators, A, 2021, 318, 112508 CrossRef CAS.
- D. A. Selck and R. F. Ismagilov, PLoS One, 2016, 11, e0163060 CrossRef PubMed.
- T. Gou, J. Hu, W. Wu, X. Ding, S. Zhou, W. Fang and Y. Mu, Biosens. Bioelectron., 2018, 120, 144–152 CrossRef CAS PubMed.
- H. Yin, Z. Wu, N. Shi, Y. Qi, X. Jian, L. Zhou, Y. Tong, Z. Cheng, J. Zhao and H. Mao, Biosens. Bioelectron., 2021, 188, 113282 CrossRef CAS PubMed.
- Y. Ho Kim, I. Yang, Y.-S. Bae and S.-R. Park, BioTechniques, 2008, 44, 495–505 CrossRef PubMed.
- S. Ni, Y. Bu, H. Zhu, P. Neuzil and L. Yobas, J. Microelectromech. Syst., 2021, 30, 759–769 Search PubMed.
- C. Shen and C. Gau, Biosens. Bioelectron., 2004, 20, 103–114 CrossRef CAS PubMed.
- H. Li, H. Zhang, Y. Xu, A. Tureckova, P. Zahradník, H. Chang and P. Neuzil, Sens. Actuators, B, 2019, 283, 677–684 CrossRef CAS.
- M. W. Khalid, C. Whitehouse, R. Ahmed, M. U. Hassan and H. Butt, Adv. Opt. Mater., 2019, 7, 1801013 CrossRef.
- P. Neuzil, W. Sun, T. Karasek and A. Manz, Appl. Phys. Lett., 2015, 106, 024104 CrossRef.
- P. Neuzil, F. Cheng, J. B. W. Soon, L. L. Qian and J. Reboud, Lab Chip, 2010, 10, 2818–2821 RSC.
- H. Zhang, M. Gaňová, Z. Yan, H. Chang and P. Neužil, ACS Omega, 2020, 5, 30267–30273 CrossRef CAS PubMed.
- S. Ni, H. Zhu, P. Neuzil and L. Yobas, J. Microelectromech. Syst., 2020, 29, 1103–1105 CAS.
- K. C. Balram, D. A. Westly, M. Davanco, K. E. Grutter, Q. Li, T. Michels, C. H. Ray, L. Yu, R. J. Kasica and C. B. Wallin, J. Res. Natl. Inst. Stand. Technol., 2016, 121, 464–476 CrossRef CAS PubMed.
- L. Gerdes, A. Iwobi, U. Busch and S. Pecoraro, Biomol. Detect. Quantif., 2016, 7, 9–20 CrossRef CAS PubMed.
- C. Tan, X. Chen, F. Wang, D. Wang, Z. Cao, X. Zhu, C. Lu, W. Yang, N. Gao, H. Gao, Y. Guo and L. Zhu, Analyst, 2019, 144, 2239–2247 RSC.
Footnotes |
| † Electronic supplementary information (ESI) available. See DOI: 10.1039/d1ra08138a |
| ‡ M. G. and X. W. contributed equally as they are both considered first authors. |
| This journal is © The Royal Society of Chemistry 2022 |