 Open Access Article
Creative Commons Attribution 3.0 Unported Licence
High performance and remarkable cyclic stability of a nanostructured RGO–CNT-WO3 supercapacitor electrode
Farah Nasreena,
Abdul Waheed Anwar *a,
Abdul Majeedb,
Muhammad Ashfaq Ahmadc,
Usman Ilyasa and
Furqan Ahmadd
aDepartment of Physics, University of Engineering and Technology, Lahore 548900, Pakistan. E-mail: abdulwaheedanwar@uet.edu.pk
bInstitute of Metal Research, Chinese Academy of Sciences, Shenyang, China
cCOMSATS Institute of Information and Technology, Lahore, 54000, Pakistan
dDepartment of Metallurgical Engineering, University of Engineering and Technology, Lahore 548900, Pakistan
First published on 11th April 2022
Abstract
One of the most pressing concerns in today's power networks is ensuring that consumers (both home and industrial) have access to efficient and long-lasting economic energy. Due to improved power accessibility and high specific capacitance without deterioration over long working times, supercapacitor-based energy storage systems can be a viable solution to this problem. So, here, tungsten trioxide (WO3) nanocomposites containing reduced graphene oxide and carbon nanotubes i.e. (RGO-WO3), (CNT-WO3), and (RGO–CNT-WO3), as well as pure WO3 nanostructures as electrode materials, were synthesized using a simple hydrothermal process. The monoclinic phase of WO3 with high diffraction peaks is visible in X-ray diffraction analysis, indicating good crystallinity of all electrode materials. Nanoflowers of WO3 were well-decorated on the RGO/CNTs conductive network in SEM micrographs. In a three-electrode system, the specific capacitance of the RGO–CNT-WO3 electrode is 691.38 F g−1 at 5 mV s−1 and 633.3 F g−1 at 2 A g−1, which is significantly higher than that of pure WO3 and other binary electrodes. Furthermore, at 2 A g−1, it achieves a coulombic efficiency of 98.4%. After 5000 cycles, RGO–CNT-WO3 retains 89.09% of its capacitance at 1000 mV s−1, indicating a promising rate capability and good cycling stability performance.
1. Introduction
The development of energy storage systems (ESSs) is crucial for tackling climate change and the finite availability of fossil fuels, as well as for storing solar and wind energy efficiently. One of the most difficult challenges now facing academics is to build highly efficient, low-cost, and environmentally friendly ESS devices. With the rapid rise of the portable electronic device industry and the development of hybrid electric vehicles, the demand for high-energy and high-power density energy storage technologies has surged. Even at increased power densities, the stored energy should be able to be released smoothly and distributed. Among these ESSs, supercapacitors are one of the most important technologies for energy storage applications because they can give better power and energy densities than batteries and ordinary dielectric capacitors.1–4 A number of materials have already been studied as supercapacitor electrode materials. Amongst all, RuO2 and IrO2 are good supercapacitor electrode materials because they have a high specific capacitance value and a high cycle capacity, which has sparked increased interest in this subject. However, their high cost and toxicity limit their practical application. One of the most active research subjects in electrochemistry is the creation of alternative economical and environmentally acceptable electrode materials with good performance. Many researchers are now working on alternate materials to IrO2 and RuO2. One of the most enticing alternatives to RuO2 and IrO2 may be WO3 owing to its electrochemical redox characteristics, environmental friendliness and low cost.5–7 Tungsten trioxide (WO3) is a well-known wide band gap n-type semiconductor with a variety of unique features and many crystal forms that are suited for the intercalation of tiny cations such as H+. It's been explored extensively as a possible material for a variety of applications which includes solar energy devices, semiconductor gas sensors, photocatalysts, electrode materials for secondary batteries and supercapacitors, field-emission devices. As a supercapacitor electrode, the capacitive characteristics of tungsten oxides e.g. mesoporous tungsten oxide, nanostructured tungsten trioxide, amorphous tungsten oxide and others have been studied.8–11 Xu He et al. developed and synthesized tungsten trioxide microspheres electrode materials with a specific capacitance of 488.78 F g−1.12 M. Ashraf et al. presented an asymmetric supercapacitor (HRG/m-WO3 ASC) made of monoclinic tungsten oxide (m-WO3) nanoplates for the negative electrode and highly reduced graphene oxide (HRG) for the positive electrode and exhibited a specific capacitance of 389 F g−1 at a current density of 0.5 A g−1.13 Nevertheless, the main disadvantages of tungsten oxide pseudocapacitors are their limited electrical conductivity and weak rate performance. Supercapacitor resistance should be reduced to increase rate capability. However, tungsten oxide preparations with diverse morphologies have received a lot of attention in terms of capacitive characteristics. The majority of investigations, on the other hand, focused on WO3 nanostructures produced from nanostructures, nanorods, or films. Until now, the capacitive characteristics of WO3 and carbon composites have received little attention in research.14 Concerning greater surface area, environmental friendliness, linked pore structure, high electrical conductivity and pore size regulation, carbon materials with varied micro textures are considered the major choice for supercapacitors.15–18 When WO3 is mixed with carbon/graphene sheets that are extremely conductive, its conductivity greatly enhanced, resulting in good capacitive materials with excellent system conductivity. A 1D multi-walled CNTs (MWCNTs) and reduced graphene oxide interwoven network also enhance electrical conductivity while also providing greater electrochemically active surface area and efficient routes for both electrons and ions in a hybrid electrode.19 The electrical double layer capacitor (EDLC) and pseudocapacitive processes in composites of WO3 and RGO/MWCNTs are of particular interest because they contain a dual charge storage mechanism.20 In addition, chemical vapour deposition, sol–gel, hydrothermal technique, and other methods have been used to synthesize WO3 nanostructures in the current findings. Among these, the hydrothermal approach was deemed superior because it allows the preparation of WO3 nanoflowers in a mild, well-controlled, and cost-effective manner,21 which was ideal for our experiment. In the present work, a facile hydrothermal procedure is demonstrated to prepare monoclinic tungsten trioxide combined with carbon nanotubes and reduced graphene oxide i.e. RGO–CNT-WO3 composite electrode. The electrochemical experiments revealed that the RGO–CNT-WO3 composite electrode has better capacitive properties than the WO3, RGO-WO3, CNT-WO3 electrode, with greater reversible charging/discharging capabilities and larger capacitance values along with high cyclic stability. The flower-like architectures of WO3 are very well assembled on reduced graphene sheets that are connected to CNTs with strong interfacial contact in RGO/CNT based tungsten trioxide nanocomposites, which ultimately provides the fastest electron transportation and thus enhances the performance of electrode.2. Experimental section
The tungsten precursor was sodium tungstate dihydrate (Na2WO4·2H2O). The pH was adjusted with hydrochloric acid (HCl). DI water was used to dissolve the precursor, dilute the acid to the appropriate molarity, and wash the finished product. Ethanol was also used to remove any contaminants from the finished product. Nickel foam was employed as the substrate for slurry casting the as-prepared powder. The samples were slurry cast onto the substrate using PVDF, Nafion, and carbon black. Sodium dodecyl benzenesulfonate (SDBS) was used to make CNTs solution in DI water. All of the reagents were acquired from Sigma Aldrich Co. LLC and utilized without additional purification. Nickel (Ni) foam was purchased from Winfay Group Co. Ltd, China.2.1 Synthesis of WO3 nanostructures
First of all, 2 g of Na2WO4·2H2O was dissolved in 50 ml DI water followed by the addition of 3 M HCl (i.e. 12.5 ml HCl in 50 ml DI water) until the pH reached 1. After that, 3.06 g of oxalic acid and 4 g of (NH4)2SO4 were added. The mixture was transferred to a stainless steel autoclave lined with Teflon and holding 150 ml. The autoclave was sealed and placed in an oven at 180 °C for 16 hours, after which it was allowed to cool naturally. The precipitate was filtered and washed with DI water and ethanol multiple times before being vacuum dried for 12 hours at 80 °C (light grey colour Fig. 1a).2.2 Synthesis of RGO-WO3 nanostructures
To begin, a 40 ml (1 mg/1 ml) graphene oxide solution was prepared using sonication and centrifugation. The RGO-WO3 nanocomposite was then made by dissolving 2 g of Na2WO4·2H2O in 30 ml of deionized water and stirring it for 30 minutes with a magnetic stirrer. Then, drop by drop, 3 M HCl was added until the pH reached up to 1.3.06 g of oxalic acid and (NH4)2SO4 were added after that. The solution was then diluted with 50 ml of deionized water. After that, the GO solution was gently added using sonication for 45 minutes. The solution was then put down into a Teflon-lined stainless steel autoclave and heated for 20 hours at 180 °C. The RGO-WO3 precipitate was filtered and washed multiple times with acetone and DI water and placed further in a vacuum oven to dry at 80 °C for 12 h (Fig. 1b).2.3 Synthesis of CNT-WO3 nanostructures
First, 10 mg ml−1 MWCNTs were ultrasonically dispersed in 5 mg ml−1 sodium dodecyl benzenesulfonate (SDBS) for 8 hours. The CNT-WO3 nanocomposite was then synthesized by dissolving 2 g of Na2WO4·2H2O in 30 ml of deionized water and stirring it for 30 minutes with a magnetic stirrer. Then, drop by drop, 3 M HCl was added until the pH reached 1.3.06 g of oxalic acid and 4 g of (NH4)2SO4 were added after that. The solution was then diluted with 50 ml of deionized water. After that, the CNT solution was gently added using sonication for 45 minutes. The solution was then put into a Teflon-lined stainless steel autoclave and heated for 20 hours at 180 °C. The CNT-WO3 precipitates were obtained through filtration and washing with acetone and DI water multiple times and placed further in a vacuum oven to dry at 80 °C for 12 h shown in Fig. 1c.2.4 Synthesis of RGO–CNT-WO3 nanostructures
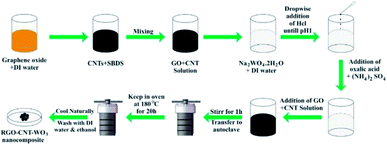
By sonication for 9 hours, 10 mg ml−1 MWCNTs were disseminated in 5 mg ml−1 SDBS. Then, to make GO/CNT dispersion, 40 mg ml−1 graphene oxide solution was mixed thoroughly with CNTs solution. The RGO–CNT-WO3 nanocomposite was then synthesized by dissolving 2 g of Na2WO4·2H2O in 30 ml of deionized water and stirring it for 30 minutes with a magnetic stirrer. Then, drop by drop, 3 M HCl was added until the pH reached 1. Then, 3.06 g of oxalic acid and 4 g of (NH4)2SO4 were added after that. The solution was then diluted with 50 ml of deionized water. After that, the CNT solution was gently added using sonication for 45 minutes. The solution was then positioned into a Teflon-lined stainless steel autoclave and heated for 20 hours at 180 °C. RGO–CNT-WO3 precipitates were obtained by filtration and washing with acetone and DI water multiple times before being dried for 12 hours in a vacuum oven at 80 °C. The final black product is exhibited in Fig. 1d. The Schematic diagram of the synthesis of RGO–CNT-WO3 through hydrothermal method has been displayed in Fig. 2.2.5 Structural characterization
The crystal structure was studied through X-ray diffraction (XRD; Rigaku Diffractometer) using Cu Kα radiation with a wavelength of (λ = 1.5416 Å) and a temperature range of 5° to 60°. Raman Spectroscopy (Jobin Yvon HR800) was also used to do the Raman analysis, which used a He–Ne laser with a wavelength of 632.8 nm. Scanning Electron Microscopy was employed to investigate the morphology of nanocomposites (Nova NanoSEM 430, 10 kV).2.6 Electrochemical characterization and fabrication of electrodes
Under a three-electrode cell configuration in 3 M KOH at ambient temperature, cyclic voltammetry (CV), galvanostatic charge–discharge (GCD), electrochemical impedance spectroscopy (EIS), and cyclic stability tests of composite electrodes were investigated. As working, counter, and reference electrodes, the as-prepared composite electrodes, platinum wire, and Ag/AgCl were employed respectively. On an electrochemical workstation (Gamry Reference 3000 Instrument, USA), all electrochemical properties were recorded. To make the working electrodes, the nickel sponge was cleaned with acetone, 2 M HCl, ethanol, and DI water many times for 15 minutes each. After that, it is dried entirely at 90 °C for 12 hours. The nickel sponge was sliced into (1 × 1 cm2) dimensions after drying. In NMP solution, the electrode active material, polyvinylidene flouride (PVDF), and acetylene black were mixed in 80![[thin space (1/6-em)]](https://www.rsc.org/images/entities/char_2009.gif) :
:![[thin space (1/6-em)]](https://www.rsc.org/images/entities/char_2009.gif) 10
10![[thin space (1/6-em)]](https://www.rsc.org/images/entities/char_2009.gif) :
:![[thin space (1/6-em)]](https://www.rsc.org/images/entities/char_2009.gif) 10 ratio to produce a homogenous slurry. Finally, this paste was spread onto sponge to make composite electrodes, which were then dried for 8 hours at 90 °C. The difference between loaded and unloaded nickel foam was used to compute the loading density of active materials for composite electrodes. The loading density of active materials for all electrodes was 1 mg cm−2. Using an Ag/AgCl reference electrode, CV experiments were conducted in the 0–0.48 voltage range at 5, 10, 20, 40 and 50 mV s−1. GCD tests were performed at densities of 2, 4, 6, and 8 A g−1. EIS study was performed with a 10 mV AC voltage amplitude and a frequency range of 1 Hz to 105 Hz. Eqn (1) and (2) are used to calculate specific capacitance (Cs) from CVs and galvanostatic discharging curves respectively;
10 ratio to produce a homogenous slurry. Finally, this paste was spread onto sponge to make composite electrodes, which were then dried for 8 hours at 90 °C. The difference between loaded and unloaded nickel foam was used to compute the loading density of active materials for composite electrodes. The loading density of active materials for all electrodes was 1 mg cm−2. Using an Ag/AgCl reference electrode, CV experiments were conducted in the 0–0.48 voltage range at 5, 10, 20, 40 and 50 mV s−1. GCD tests were performed at densities of 2, 4, 6, and 8 A g−1. EIS study was performed with a 10 mV AC voltage amplitude and a frequency range of 1 Hz to 105 Hz. Eqn (1) and (2) are used to calculate specific capacitance (Cs) from CVs and galvanostatic discharging curves respectively;
 | (1) |
 | (2) |
The coulombic efficiency of an electrode can be computed by using the following relation
 | (3) |
3. Results and discussion
3.1 Physical characterizations
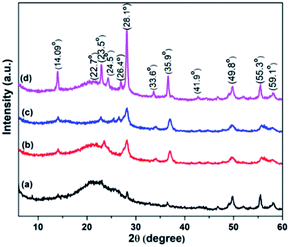
The crystallinity of WO3, RGO-WO3, CNT-WO3, RGO-CNT-WO3 materials was studied using X-ray diffraction (XRD, Rigaku diffractometer) with Cu Kα radiation (λ = 1.5416 Å). Scanning electron microscopy (SEM, Hitachi S4800, operating voltage 10 kV) was used to examine the morphologies of the produced materials. Raman spectrometer (Jobin Yvon HR 800) equipped with He–Ne laser was used to record Raman spectra at an excitation source of 632.8 nm wavelength.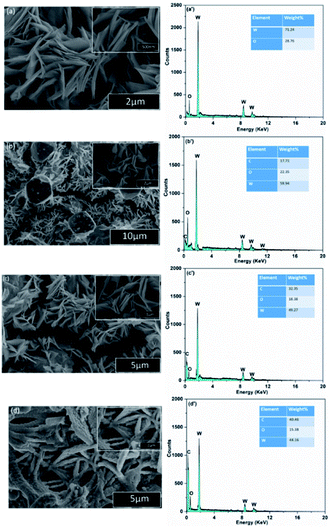 | ||
| Fig. 4 SEM images of (a) WO3 (b) RGO-WO3 (c) CNT-WO3 (d) RGO–CNT-WO3 nanostructures and the corresponding EDS graphs of (a′) WO3 (b′) RGO-WO3 (c′) CNT-WO3 (d′) RGO–CNT-WO3. | ||
The pores in RGO/CNTs network provide vast channels for ion-transportation and inter-connected sheet works as conduction skeleton for electron transportation. This unique feature also provides enhanced contact area with electrolytic ions which results in path length reduction thus leads to promotion of fast electrons and ion transportation. This will overall improve the electrochemical performance.30 The corresponding EDS spectra of all nanocomposites, displayed in Fig. 4a′–d′ indicate the presence of C, O and W elements without any other impurities.
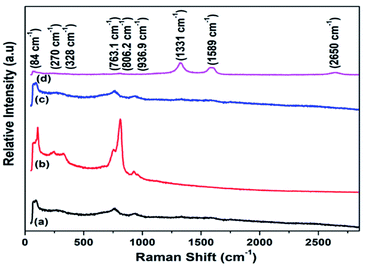
As depicted in Fig. 5, there are six modes (Raman active) for tungsten trioxide (WO3). A G peak, D peak and 2D bands for RGO-CNTs are located at 1331 cm−1, 1589 cm−1 and 2650 cm−1 respectively. A D-band referred to defects present in carbon nanostructures whereas scattering of sp2 carbon atoms results in G-peak. Also, 2D bands are created as a result of dual resonance processes. The peak located at 936.9 cm−1 attributes to W![[double bond, length as m-dash]](https://www.rsc.org/images/entities/char_e001.gif) O bond stretching, whereas stretching vibration of oxygen (O–W–O) is related to the peaks 763.1 cm−1 and 806.2 cm−1 respectively. The bending vibration of (W–O–W) occurs and results in a peak at 264 cm−1 while peak located at 328 cm−1 correlates to v (W–OH2) vibrations. Additionally, a pair of peaks are found at 84 cm−1 and 270 cm−1. Also, in addition, two low-intensity peaks referred to D & G bands, representing the presence of RGO-CNTs in CNT-WO3, RGO-WO3 and RGO–CNT-WO3 nanostructures.31–34
O bond stretching, whereas stretching vibration of oxygen (O–W–O) is related to the peaks 763.1 cm−1 and 806.2 cm−1 respectively. The bending vibration of (W–O–W) occurs and results in a peak at 264 cm−1 while peak located at 328 cm−1 correlates to v (W–OH2) vibrations. Additionally, a pair of peaks are found at 84 cm−1 and 270 cm−1. Also, in addition, two low-intensity peaks referred to D & G bands, representing the presence of RGO-CNTs in CNT-WO3, RGO-WO3 and RGO–CNT-WO3 nanostructures.31–34
3.2 Electrochemical characterizations
To prepare the working electrodes, the active materials (80 wt%), acetylene black (10 wt%) and PVDF (solvent is NMP) are mixed and pressed on a nickel foam and finally dried in an oven at a temperature of 120 °C for 10 hours. The cyclic voltammetry (CV), galvanostatic charge discharge (GCD), cyclic stability and electrochemical impedance spectroscopy (EIS) were employed to study the electrochemical features of as-prepared electrodes in a three-electrode cell configuration in 3 M KOH electrolytic solution while this cell configuration contains a Pt wire acting as counter electrode, as-prepared electrodes as working electrode and Ag/AgCl electrode worked as reference electrode. A gold wire is used as current collector. These measurements were taken in a potential range 0–0.48 V at various scan rates. Different current densities (2–8 A g−1) were employed to record GCD curves. The EIS spectra was taken for frequency range (1–105 Hz) using 10 mV AC perturbation. Cyclic voltammetry (CV) was employed to inspect stability performance of (RGO–CNT-WO3) hybrid electrode. The CV cycles were run for 5000 cycles at a scan rate of 1000 mV s−1 and two CV curves were recorded at scan rate 5 mV s−1 initially and after 5000th cycle and then capacitance retention of prepared electrode was calculated.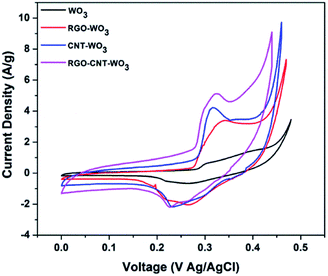 | ||
| Fig. 6 Comparison of CV curves of WO3, RGO-WO3, CNT-WO3, RGO–CNT-WO3 electrodes at a scan rate of 5 mV s−1. | ||
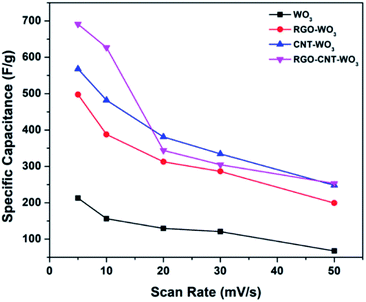
Eqn (1) was used to compute the specific capacitance of each electrode. Among all the electrodes, RGO–CNT-WO3 composite owns higher capacitance of 691.38 F g−1 as compared to other electrodes (Table 1). The higher accessible surface area facilitates faster ion adsorption which leads to efficient transportation of charges and ion intercalation36 resulting in higher specific capacitance of RGO–CNT-WO3. The supercapacitive performance of WO3, RGO-WO3, CNT-WO3, RGO–CNT-WO3 from 5-50 mV s−1 are displayed in Fig. 7.
| Sample | Specific capacitance (F g−1) | ||||
|---|---|---|---|---|---|
| 5 mV s−1 | 10 mV s−1 | 20 mV s−1 | 30 mV s−1 | 50 mV s−1 | |
| WO3 | 212.93 | 156.3 | 129.4 | 120.6 | 67.32 |
| RGO-WO3 | 497.6 | 387.91 | 312.8 | 286.3 | 199.08 |
| CNT-WO3 | 567.99 | 481.97 | 381.07 | 334.3 | 247.94 |
| RGO–CNT-WO3 | 691.38 | 627.03 | 344.03 | 304.6 | 253.09 |
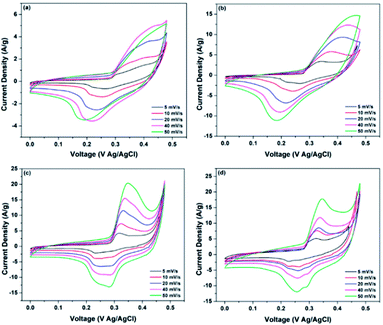 | ||
| Fig. 7 Comparison of CV curves of (a) WO3, (b) RGO-WO3, (c) CNT-WO3, (d) RGO–CNT-WO3 electrodes at various scan rates. | ||
As expected, the increase in scan rate resulted in increased current density and integrated area with nearly little change in shape of CV curves which reflects the higher reversibility and stability of all electrodes. Nevertheless, as presented in Fig. 7d, even at higher scan rates of 50 mV s−1, there is no remarkable change in shapes of CV curves which indicates behaviour close to ideal supercapacitor and high rate performance as compared to other electrodes.
The specific capacitance variation with scan rates is depicted in Fig. 8. It can be clearly seen that the increase in scan rate reduces specific capacitance because the redox reactions occur only onto the surface as inner electroactive sites for ion intercalation are not available completely and vice versa.
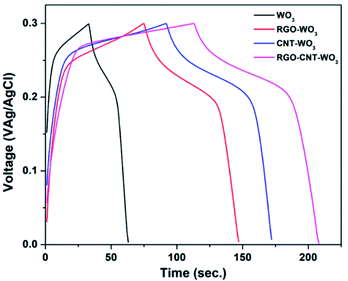 | ||
| Fig. 9 Comparison of GCD curves of WO3, RGO-WO3, CNT-WO3, RGO–CNT-WO3 electrodes at a current density of 2 A g−1. | ||
Such greater performance of RGO–CNT-WO3 can be credited to (i) the short ion diffusion path and facilitates rapid electron transport which is produced as a result of sufficient interfacial contact amongst RGO/CNT nanosheets and WO3 nanostructures (ii) WO3 nanoflowers permit reversible and instantaneous oxidation–reduction reactions to enhance the capacitance (iii) the production of electroactive sites increased due to unique hybrid nanostructures.37
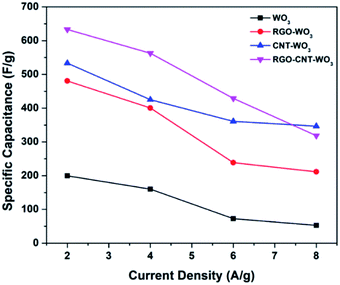
The RGO–CNT-WO3 electrode possesses specific capacitances of 633.3, 562.6, 429 & 340.7 F g−1 at 2, 4, 6 and 8 A g−1 respectively [Table 2]. Distinctly, even at a high current density of 8 A g−1, the capacitance of the RGO–CNT-WO3 electrode remains as high as 346.7 F g−1.
| Sample | Specific capacitance (F g−1) | |||
|---|---|---|---|---|
| 2 A g−1 | 4 A g−1 | 6 A g−1 | 8 A g−1 | |
| WO3 | 199.7 | 160.27 | 72.4 | 52.8 |
| RGO-WO3 | 480.6 | 400.5 | 238.6 | 211.47 |
| CNT-WO3 | 533.3 | 425.3 | 361 | 318.4 |
| RGO–CNT-WO3 | 633.3 | 562.7 | 429 | 346.7 |
To study the effect of higher current densities on specific capacitances, the GCD curves of each electrode at various current densities were obtained as represented in Fig. 10. It is clear that when the current density increases, the discharging time for all electrodes reduces. This is because at greater current densities, surface synergy between electrode and electrolyte is more likely to occur, resulting in a reduction in specific capacitance and a faster rate of discharge.38,39 Fig. 11 illustrates the range of specific capacitance of RGO–CNT-WO3 electrodes with various current densities WO3, RGO-WO3, CNT-WO3, RGO–CNT-WO3 electrodes with various current densities.
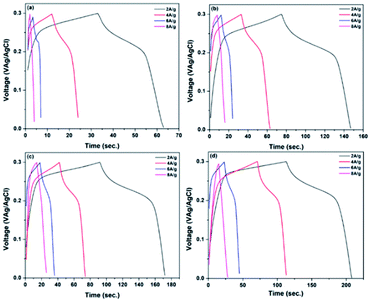 | ||
| Fig. 10 GCD curves of (a) WO3 (b) RGO-WO3 (c) CNT-WO3 (d) RGO–CNT-WO3 electrodes at different current densities. | ||
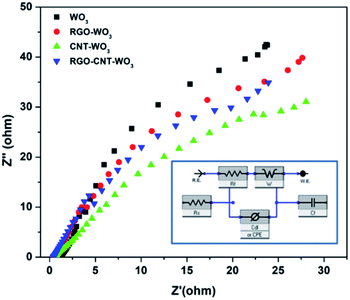 | ||
| Fig. 12 Comparison of Nyquist plots of WO3, RGO-WO3, CNT-WO3 and RGO–CNT-WO3 composite electrodes while inset shows an equivalent fitting circuit of a supercapacitor. | ||
It is noticeable that on the real component i.e. the Z′ axis, the diameter of a semicircle in high frequency zone is associated to the Rct, indicating greater ion diffusion into electrode pores. In the high frequency band, the Nyquist plot of all electrodes displays no semicircle, indicating optimal super-capacitive behaviour.29,40 In comparison to other electrodes, the RGO–CNT-WO3 has a relatively low charge transfer resistance of 5.182 Ω. A vertical curve larger than 45° in the low-frequency zone suggests considerable super-capacitive activity with low diffusion resistance in the electrodes. The analogous circuit (inset) was used to investigate the produced impedance spectra, and the results are provided in Table 3, where CPE stands for constant phase element. The RGO/CNT conductive network that governs fast electron transfer channels and WO3 nanoflowers that facilitate electrolyte penetration and reduce ion and electron diffusion routes are responsible for the improved electrochemical performance.41
| Sample | Series resistance, Rs (Ω) | Charge-transfer resistance, Rct (Ω) | Constant phase element, CPE | Warburg impedance, W (Ω) |
|---|---|---|---|---|
| WO3 | 1.051 | 8.773 | 0.0045 | 661.6 × 10⁻³ |
| pRGO-WO3 | 0.350 | 8.508 | 0.5004 | 652.3 × 10⁻³ |
| CNT-WO3 | 0.542 | 9.354 | 0.0064 | 638.8 × 10⁻³ |
| RGO–CNT-WO3 | 0.388 | 5.182 | 0.0052 | 597.7 × 10⁻³ |
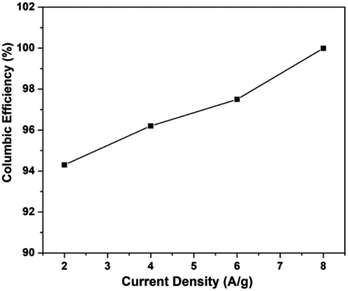
| Electrode materials | Coulombic efficiency η (%) | |||
|---|---|---|---|---|
| 2 A g−1 | 4 A g−1 | 6 A g−1 | 8 A g−1 | |
| WO3 | 90.6 | 92.1 | 95.6 | 112.4 |
| RGO-WO3 | 93.1 | 97.3 | 110 | 99.07 |
| CNT-WO3 | 93.3 | 95.7 | 98.2 | 99.9 |
| RGO–CNT-WO3 | 94.3 | 96.2 | 97.5 | 99.99 |
It is noticed that the RGO–CNT-WO3 electrode has the highest coulombic efficiency of 94.3% that is more than 93.3%, 93.1% and 90.6% for WO3, RGO-WO3, CNT-WO3 accordingly at a current density of 2 A g−1. Fig. 13 shows the coulombic efficiency vs. current density, revealing the strong reversibility of the redox processes of the RGO–CNT-WO3 electrode. Furthermore, at a greater current density of 8 A g−1, the coulombic efficiency of WO3 exceeds 100%. At 6 A g−1, the RGO-WO3 electrode material achieves a coulombic efficiency of 110 percent. The increased (η) value (>100%) of RGO-WO3 at 6 A g−1 might be attributable to the breakdown of electrode material, which produces extra charges during the discharging cycle.42
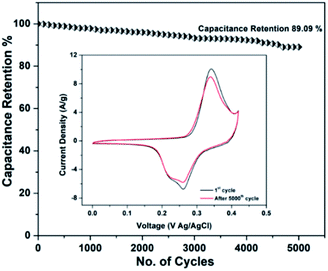 | ||
| Fig. 14 Cyclic stability of RGO–CNT-WO3 composite electrode at 1000 mV s−1 for 5000 cycles. The inset shows the CV curves obtained at 5 mV s−1 before and after 5000 cycles. | ||
The improved electro-chemical performance of RGO–CNT-WO3 can be accredited to tungsten trioxide and CNT/RGO nanostructures, which increase the electrolyte–electrode contact area and hence favour ion transport, resulting in a higher rate capability.43 These findings suggest that RGO–CNT-WO3 is a tremendous candidate for use in well-efficient energy storage devices. The comparison of electrochemical performance of (RGO-WO3), (CNT-WO3), and (RGO–CNT-WO3) with the reported literature was done and it is listed in Table 5. The results manifest that the prepared electrodes have capacitance and cyclic stability comparable to or higher than the others, suggesting the superior electrochemical performance. Also, to the best of our knowledge, RGO–CNT-WO3 electrode has not reported in the literature yet.
| Electrode materials | Synthesis method | Surface morphology | Electrolyte used | Specific capacitance (Cs) | Capacitance retention | Ref. |
|---|---|---|---|---|---|---|
| Graphene nanosheets–tungsten oxide GNS–W | Facile solution approach | WO3 platelets | 1 M H2SO4 | 143.6 F g−1 | 40 | |
| Feather duster-like CNT@WO3 | Microwave heating method | WO3 nanosheet arrays | 0.5 M H2SO4 | 496 F g−1 at 1 A g−1 | 96.3% after 8000 cycles | 44 |
| WO3·2H2O/bamboo charcoal | ϒ-Irradiation | Irregular forms | 6 M KOH | 391 F g−1 at 0.5 A g−1 | 82% retention after 10![[thin space (1/6-em)]](https://www.rsc.org/images/entities/char_2009.gif) 000 cycles 000 cycles |
45 |
| HRG//m-WO3 ASC | Hydrothermal method | WO3 nanoplates | 1 M H2SO4 | 389 F g−1 at 0.5 A g−1 | 92% after 5000 cycles | 46 |
| WO3-rGO hybrids | Hydrothermal method | Micro-rod like morphology | 3 M KOH | 801.6 F g−1 at 4 A g−1 | 75.7% after 5000 cycles | 47 |
| RGO–CNT-WO3 | Hydrothermal method | WO3 nanoflowers | 3 M KOH | 633.3 F g−1 at 2 A g−1 | 89.09% after 5000 cycles | Present work |
4. Conclusions
In summary, this study shows a simplistic synthesis of graphene oxide (GO) and tungsten trioxide (WO3) nanostructures, followed by hydrothermal hybridization of this transition metal oxide with carbon materials (graphene, CNTs) to produce binary and ternary nanocomposites. XRD analysis confirms the monoclinic phase and high crystallinity of WO3. SEM investigation demonstrates the RGO/CNT network integrated with WO3 nanoflowers in binary and ternary nanocomposites. Many of the vibrational modes of WO3 and D, G peaks of RGO/CNTs have been confirmed through Raman investigation. According to electrochemical results, the (RGO–CNT-WO3) electrode among all pure and binary nanocomposite electrodes has a superb specific capacitance of 633.3 F g−1 at a current density of 2 A g−1, a coulombic efficiency of 94.3% at 2 A g−1, and specific capacitance retention of about 89.09% for 5000 cycles at a scan rate of 1000 mV s−1. In short, (RGO–CNT-WO3) nanocomposite electrode exhibits superior specific capacitance, reversibility, cyclic stability, coulombic efficiency and low resistances making it suitable for use in supercapacitors. For high-performance supercapacitor applications, this facile methodology also provides an easy way to synthesize novel electrode materials with improved electrochemical properties.Conflicts of interest
There are no conflicts to declare.Acknowledgements
We thank Dr Muhammad Awais Javed for his skilful assistance in the electrochemical characterization.References
- J. Chen, H. Wang, J. Deng, C. Xu and Y. Wang, J. Mater. Chem. A, 2018, 6, 8986–8991 RSC.
- X. He, X. Wang, B. Sun, J. Wan, Y. Wang, D. He, H. Suo and C. Zhao, RSC Adv., 2020, 10, 13437–13441 RSC.
- R. Adalati, A. Kumar, Y. Kumar and R. Chandra, Energy Technol., 2020, 8, 2000466 CrossRef CAS.
- A. S. Lemine, M. M. Zagho, T. M. Altahtamouni and N. Bensalah, Int. J. Energy Res., 2018, 42, 4284 CrossRef CAS.
- M. Kandasamy, S. Sahoo, S. K. Nayak, B. Chakroborty and C. S. Rout, J. Mater. Chem. A, 2021, 9, 17643–17700 RSC.
- X.-L. Li, T.-J. Lou, X.-M. Sun and Y.-D. Li, Inorg. Chem., 2004, 43, 5442–5544 CrossRef CAS PubMed.
- Y. Cai, Y. Wang, S. Deng, G. Chen, Q. Li, B. Han, R. Han and Y. Wang, Ceram. Int., 2014, 40, 4109–4116 CrossRef CAS.
- J. Xiao, Y. Che, B. Lv, M.-C. Benedicte, G. Feng, T. Sun and C. Song, Mater. Res., 2021, 24(3), 20200434 CrossRef.
- F. S. Tehrani, H. Ahmadian and M. Aliannezhadi, Mater. Res. Express, 2020, 7, 015911 CrossRef CAS.
- V. Hariharan, B. Gnanavel, R. Sathiyapriya and V. Aroulmoji, Int. J. Adv. Sci. Eng., 2019, 5(4), 1163–1168 CAS.
- H. Peng, G. Ma, K. Sun, J. Mu, M. Luo and Z. Lei, Electrochim. Acta, 2014, 147, 54–61 CrossRef CAS.
- X. He, J. Wan, D. He, X. Yang, H. Suo and C. Zhao, Crystals, 2019, 9, 485 CrossRef.
- M. A. S. S. Shah, D. I. Khan, D. M. A. Aziz, P. N. Ullah, D. M. Khan, D. S. F. Adil, Z. Liaqat, D. M. Usman, P. W. Tremel and D. M. N. Tahir, Chem.–Eur. J., 2021, 27(23), 6973–6984 CrossRef PubMed.
- D. Pragati, A. Shinde and P. S. C. Jun, ChemSusChem, 2019, 13(1), 11–38 Search PubMed.
- P. K. Sahoo, C.-A. Tseng, Y.-J. Huang and C.-P. Lee, Carbon-based nanocomposite materials for high-performance supercapacitors, in Novel Nanomaterials, ed. K. Krishnamoorthy, IntechOpen, 2021 Search PubMed.
- Y. Wang, L. Zhang, H. Hou, W. Xu, G. Duan, S. He, K. Liu and S. Jiang, J. Mater. Sci., 2021, 56, 173–200 CrossRef CAS.
- H. Peng, G. Ma, K. Sun, J. Mu, M. Luo and Z. Lei, Electrochim. Acta, 2014, 147, 54–61 CrossRef CAS.
- D. Xue, D. Zhu, H. Duan, Z. Wang, Y. Lv, W. Xiong, L. Li, M. Liu and L. Gan, Chem. Commun., 2019, 55, 11219–11222 RSC.
- X. Zheng, L. Miao, Z. Song, W. Du, D. Zhu, Y. Lv, L. Li, L. Gan and M. Liu, J. Mater. Chem. A, 2022, 10, 611–621 RSC.
- P. A. Shinde, Y. Seo, C. Ray and S. C. Jun, Electrochim. Acta, 2019, 308, 231–242 CrossRef CAS.
- H. Ahmadian, F. S. Tehrani and M. Aliannezhadi, Mater. Res. Express, 2019, 6(10), 105024 CrossRef CAS.
- Y. W. Y. Cai, S. Deng, G. Chen, Q. Li, B. Han, R. Han and Y. Wang, Ceram. Int., 2014, 40, 4109–4116 CrossRef CAS.
- Y. Y. J.-G. Wang, Z.-H. Huang and F. Kang, Mater. Chem. Phys., 2013, 140, 643–650 CrossRef.
- W. Wang, Q. How, W. Lei, X. Xia and X. Wang, J. Power Sources, 2014, 269, 250–259 CrossRef CAS.
- R. Hatel and M. Batoul, J. Phys.: Conf. Ser., 2019, 1292, 012014 CrossRef CAS.
- D. Susanti, S. Haryo, H. Nisfu, E. P. Nugroho, H. Purwaningsih and G. E. Kusuma, Front. Chem. Sci. Eng., 2012, 6(4), 371–380 CrossRef CAS.
- B. Liu, D. Cai, Y. Liu, D. Wang, L. Wang and Y. Wang, Sens. Actuators, B, 2014, 193, 28–34 CrossRef CAS.
- E. H. Jo, S. K. Kim, H. Chang, C. Lee, S. R. Choi and J. h. Choi, Aerosol Air Qual. Res., 2018, 19, 449–454 CrossRef.
- S. P. Gupta, H. H. Nishad, V. B. Patil, S. D. Chakane, M. A. More, D. J. Late and P. S. Walke, Mater. Adv., 2020, 1, 2492–2500 RSC.
- H. Peng, G. Ma, K. Sun, J. Mu, M. Luo and Z. Lei, Electrochim. Acta, 2014, 147, 54–61 CrossRef CAS.
- G. Jeevitha, R. Abhinayaa, D. Mangalaraj, N. Ponpandian, P. Meena and V. Mounasamy, Nanoscale Adv., 2019, 1, 1799–1811 RSC.
- M. Zhi, W. Huang, Q. Shi, M. Wang and Q. Wang, RCS Adv., 2016, 6, 67488 CAS.
- Y. Djaoued, S. Balaji and R. Bruning, J. Nanomater., 2012, 2012, 674168 CrossRef.
- F. S. Manciu, J. L. Enriquez, W. G. Durrer and Y. Yun, J. Mater. Res., 2010, 25(12), 2401–2406 CrossRef CAS.
- L. Gao, X. Wang, Z. Xie, W. Song, L. Wang, X. Wu, F. Qu, D. Chen and G. Shen, J. Mater. Chem., 2013, 1, 7167–7173 RSC.
- L. L. Xing, K. J. Hunag and L. X. Fang, Dalton Trans., 2016, 45, 17439–17446 RSC.
- X. Lu, T. Zhai, X. Zhang, Y. Shen, L. Yuan, B. Hu, L. Gong, J. Chen, Y. Gao, J. Zhou, Y. Tong and Z. L. Wang, Adv. Mater., 2012, 24, 938–944 CrossRef CAS PubMed.
- C. Yuan, H. Lin, H. Lu, E. Xing, Y. Zhang and B. Xie, Mater. Lett., 2015, 148, 167–170 CrossRef CAS.
- J. Xu, T. Ding, J. Wang, J. Zhang, S. Wang, C. Chen, Y. Fang, Z. Wu, K. Huo and J. Dai, Electrochim. Acta, 2015, 174, 728–734 CrossRef CAS.
- Y. Cai, Y. Wang, S. Deng, G. Chen, Q. Li, B. Han, R. Han and Y. Wang, Ceram. Int., 2014, 40, 4109–4116 CrossRef CAS.
- S. Yao, F. Qu, G. Wang and X. Wu, J. Alloys Compd., 2017, 724, 695–702 CrossRef CAS.
- W.-C. Peng, S.-B. Wang and X.-Y. Li, Sep. Purif. Technol., 2016, 163, 15–22 CrossRef CAS.
- A. K. Nayak, A. K. Das and D. Pradhan, ACS Sustainable Chem. Eng., 2017, 5, 10128–10138 CrossRef CAS.
- J. Di, H. Xu, X. Gai, R. Yang and H. Zheng, One-step solvothermal synthesis of feather duster-like CNT@WO3 as high-performance electrode for supercapacitor, Mater. Lett., 2019, 246, 129–132 CrossRef CAS.
- F. Yang, J. Jia, R. Mi, X. Liu, Z. Fu, C. Wang, X. Liu and Y. Tang, Front. Chem., 2018, 6, 2296–2646 Search PubMed.
- M. Ashraf, S. S. Shah, I. Khan, M. A. Aziz, N. Ullah, M. Khan, S. F. Adil, Z. Liaqat, M. Usman, W. Tremel and M. N. Tahir, Chem.–Eur. J., 2019, 27(23), 6973–6984 CrossRef PubMed.
- R. Samal, B. Chakraborty, M. Saxena, D. J. Late and C. S. Rout, ACS Sustainable Chem. Eng., 2019, 7(2), 2350–2359 CrossRef CAS.
| This journal is © The Royal Society of Chemistry 2022 |


