
 Open Access Article
 This Open Access Article is licensed under a Creative Commons Attribution-Non Commercial 3.0 Unported Licence
Mean drop behavior in the standard liquid–liquid extraction systems on an L-shaped pulsed sieve-plate column: experiment and modeling
Fatemeh Ardestania,
Ahad Ghaemi *a,
Jaber Safdarib and
Alireza Hemmatia
*a,
Jaber Safdarib and
Alireza Hemmatia
aSchool of Chemical, Petroleum and Gas Engineering, Iran University of Science and Technology, P.O. Box: 16765-163, Tehran, Iran. E-mail: aghaemi@iust.ac.ir
bMaterials and Nuclear Fuel Research School, Nuclear Science and Technology Research Institute, Tehran, Iran
First published on 2nd February 2022
Abstract
In this study, the effect of operating parameters on drop behavior was investigated experimentally in an L-shaped pulsed sieve-plate column (LPSPC). LPSPC offers enhanced efficiency due to a high mixing rate provided by pneumatic or hydraulic pulsation of the liquids, which makes the dispersed phase drops coalesce and break. The response surface methodology (RSM) based on the central composite design (CCD) approach was applied for experimental modeling of three standard systems including toluene–water, butyl acetate–water, and butanol–water. Four parameters including pulsation intensity, interfacial tension, dispersion, and continuous phase velocities were examined in the experiments. Experimental results indicated that an increase in the pulsation intensity led to a decrease in Sauter mean diameter (SMD), and an increase in the flow rates of the phase cause an increase in SMD, although the effect of the flow rates on SMD was much lower than the pulsation intensity. Based on the obtained experimental data, new correlations have been proposed to predict SMD in two sections of the column tested by the goodness-of-fit statistics through analysis of variance. The coefficient of determination was achieved at 0.998 and 0.978 for horizontal and vertical sections, respectively, which demonstrated that the presented models estimated the experimental values very well. The optimum SMDs were obtained at 0.789 mm and 0.639 mm for the horizontal and vertical sections, respectively.
1. Introduction
Solvent extraction is a technique for separation having broad applications in different industries such as the petroleum, metal salt extraction, wastewater purification, pharmaceutical, and nuclear industries.1–11 Various types of liquid–liquid contactors have been developed, including columns, centrifugal extractors, and mixer-settlers in this respect over many years.12–19 The contactors with internal moving parts have a lower capacity than convectional non-internal moving part contactors, though their extraction efficiency is high.1,2 Hence, efforts have been made to expand the extractive columns lacking mixers or internal moving parts. Generally, criteria to choose a suitable contractor must be considered, including capacity, maintenance, protection, high efficiency under a broad range of operational conditions, process control, and cost. Accordingly, pulsed sieve-plate columns are the main choice.20,21 Van Dijck introduced the pulsed sieve-plate columns in 1935.22 These columns have long been used in counter-current liquid extraction. A reciprocating mechanism attached to the outside equipment can generate the pulsation. The entrance pulse plays the function of the mechanical stirrer and produces smaller diameter droplets, which subsequently increases the efficiency of the column.23Pulsed sieve-plate columns are classified into vertical and horizontal columns. Although these columns have many advantages for industrial applications, the horizontal structure of these columns enjoys several significant advantages, which can be summarized as follows:
• Due to the horizontal structure, high-ceilinged buildings do not need to be maintained, leading to a reduction in the cost of radiation protection.
• Improves process control and reduces the possibility of radioactive contamination of process equipment.
• Ease of repair, maintenance, and disassembly of the device as compared to vertical columns when the level of activity is high.
On the other hand, horizontal pulsed columns have several drawbacks comparing to vertical columns such as:
• Low capacity owing to non-use of gravity.
• A higher time required to achieve stable conditions.
• Not using the maximum free space of the trays to avoid flow canalization.
• More dispersed phase droplet accumulation at the end of the columns, as well as premature flooding.20–33
Thusly, each type of pulsed column has its own benefits and disadvantages. The L-shaped (horizontal–vertical) pulsed sieve-plate column (LPSPC) is a novel extractor of pulsed column.1,12 It is expected that this class of columns will present more advantages and will perform better than compared to those with the horizontal or vertical extraction columns in the applications with region limitation.23–28 In addition, its installation height and required surface area are less than those of vertical and horizontal columns. Finally, it has been shown that the energy intake of LPSPC is in the range of columns (vertical and horizontal).28 Moreover, there are only few studies conducted on LPSPCs.34–37
One basic parameter required for designing LPSPCs is to determine the droplets' the mean diameter at specific operation conditions. Drop size knowledge is essential in designing and evaluating the performance of the columns, as it influences the residence time of the dispersed phase, holdup, and the column's maximum volumetric capacity.25 In addition, droplet size and dispersed phase holdup are used to measure the interfacial area for mass transfer, thus influencing the mass transfer coefficients of dispersed and continuous phases. Therefore, the prediction of the droplet diameter as a function of operating conditions, column geometry, and physical properties of the liquid–liquid system is very important.37,38 Some studies have been done on the vertical column's drop behavior. Yadav et al. reviewed the literature on the droplet size of pulsed columns.28 Khawaja et al. investigated the impact of pulse intensity on Sauter mean diameter (SMD).15 Yi et al. reported that the mean drop size is reduced by increasing the pulsation intensity; however, the flow rate of continues and dispersed phase has a slight effect in this regard.39 A limited research has been carried out on the horizontal column's drop behavior.40–43 Khajenoori et al. examined the effect of operation variables on the drop behavior in horizontal column and found out that the mean drop size was mostly affected by pulsation intensity.40 Numerous researchers have proposed empirical correlations for drop size prediction in pulsed columns (see Table 1).
| Column type | Correlation | Authors |
|---|---|---|
| a HPSPC “horizontal pulsed sieve-plate column”; VPSPC “vertical pulsed sieve-plate column”; VPPC “vertical pulsed packed column”. | ||
| HPSPCa | 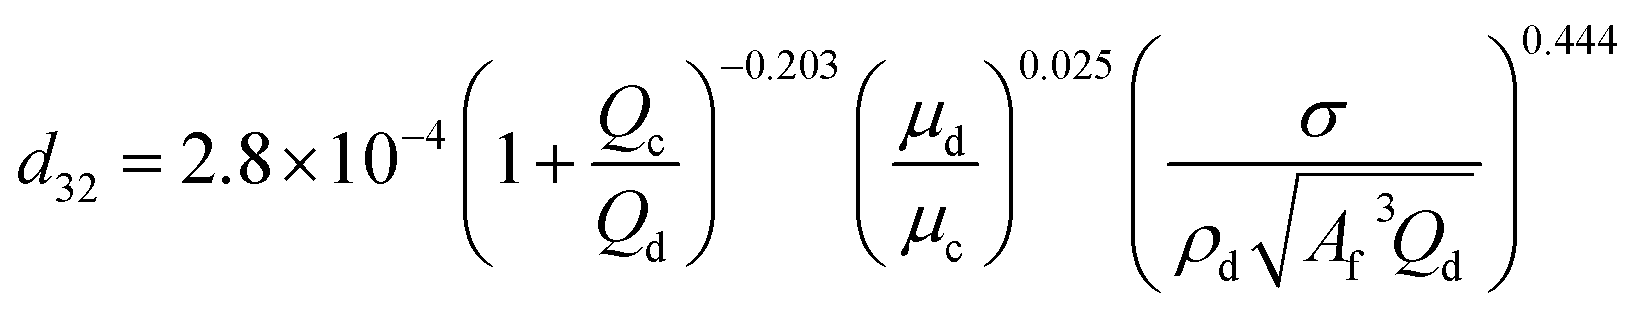 |
Khajenoori et al.40 |
| HPSPC | 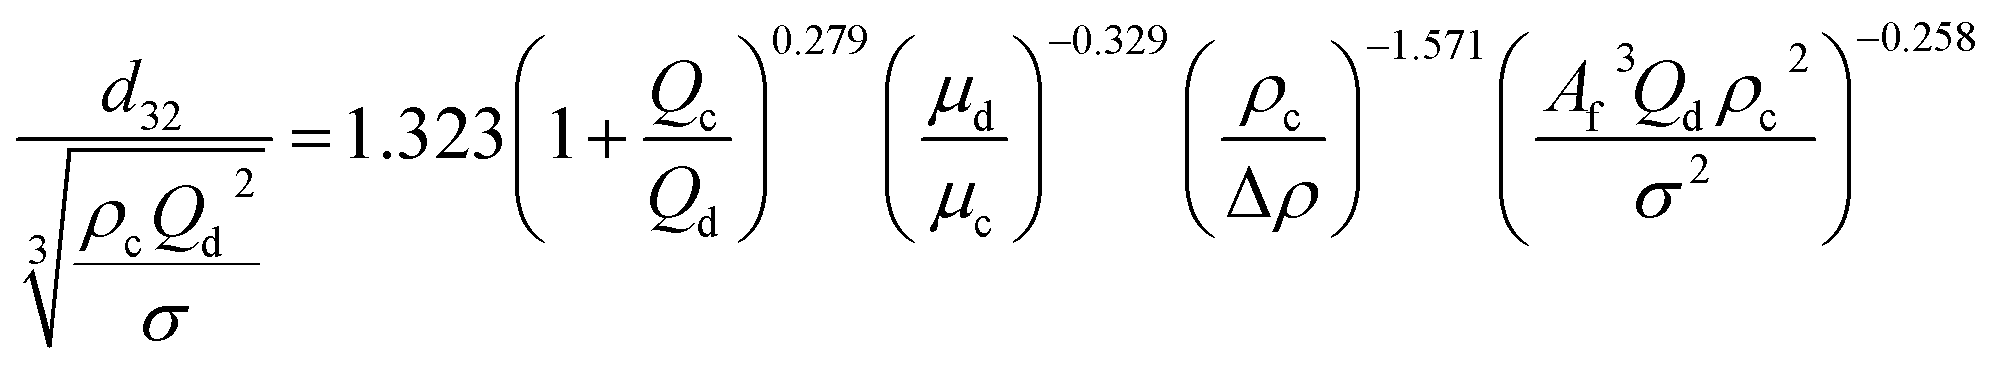 |
Panahinia et al.43 |
| VPSPC | 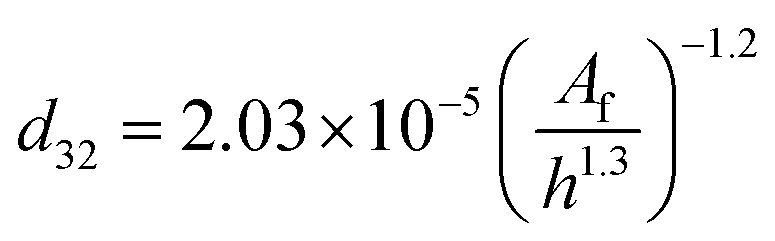 |
Miyauchi et al.44 |
| VPSPC | 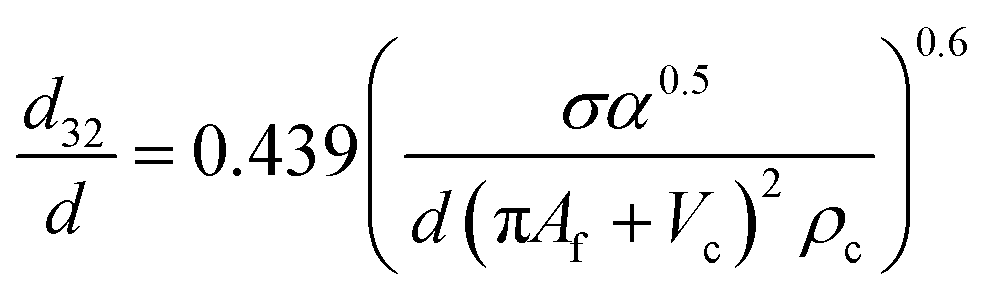 |
Míšek et al.45 |
| VPSPC | 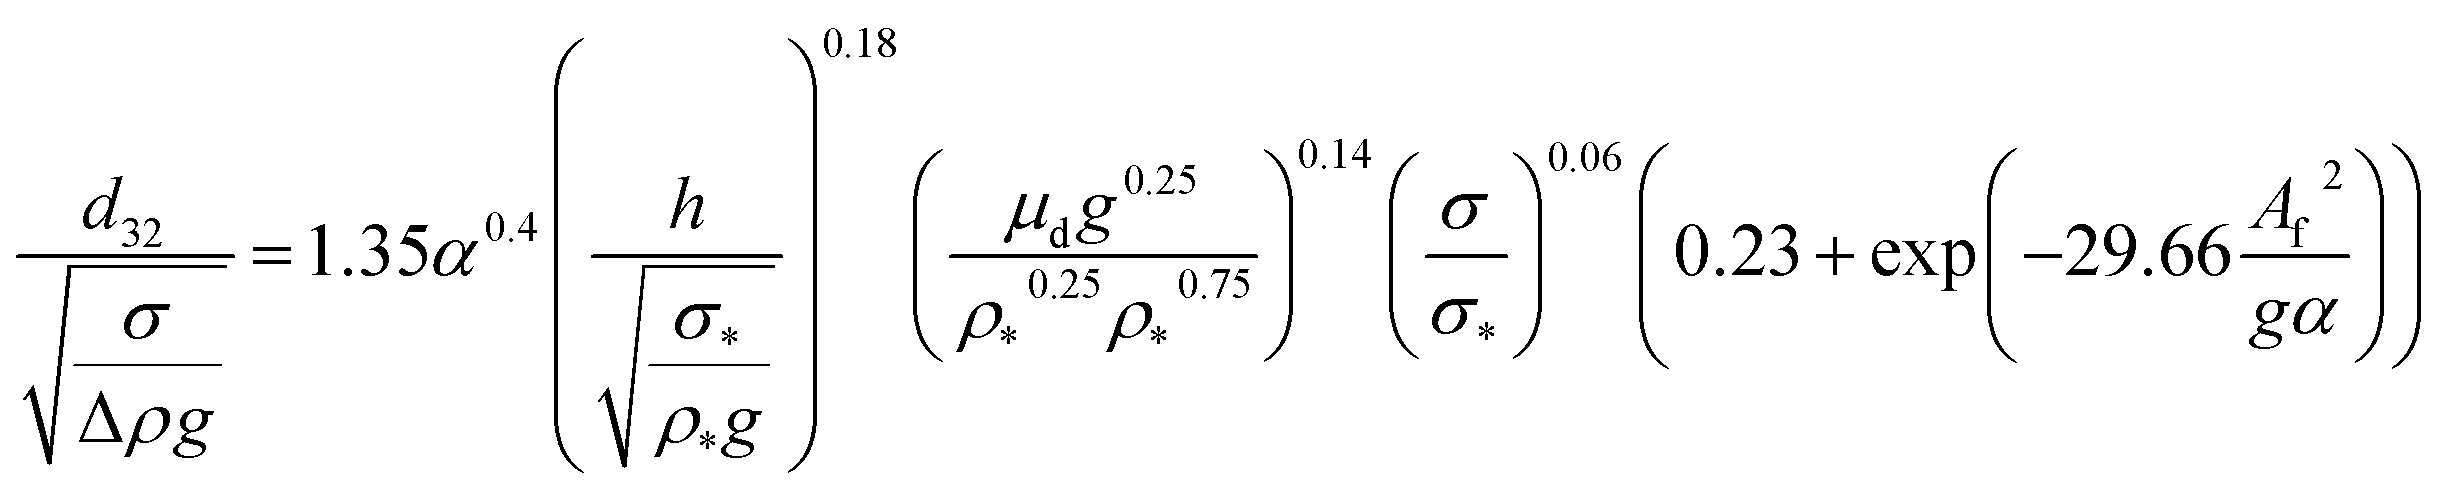 |
Moreira et al.46 |
| VPSPC | 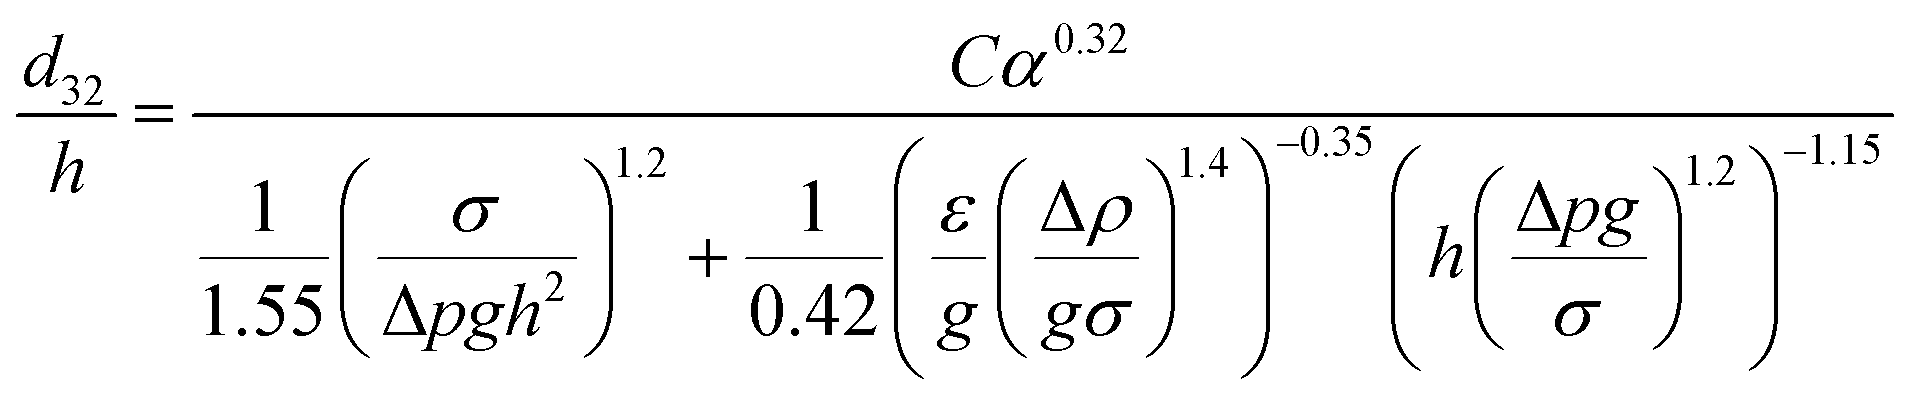 |
Kumar et al.47 |
| VPSPC | 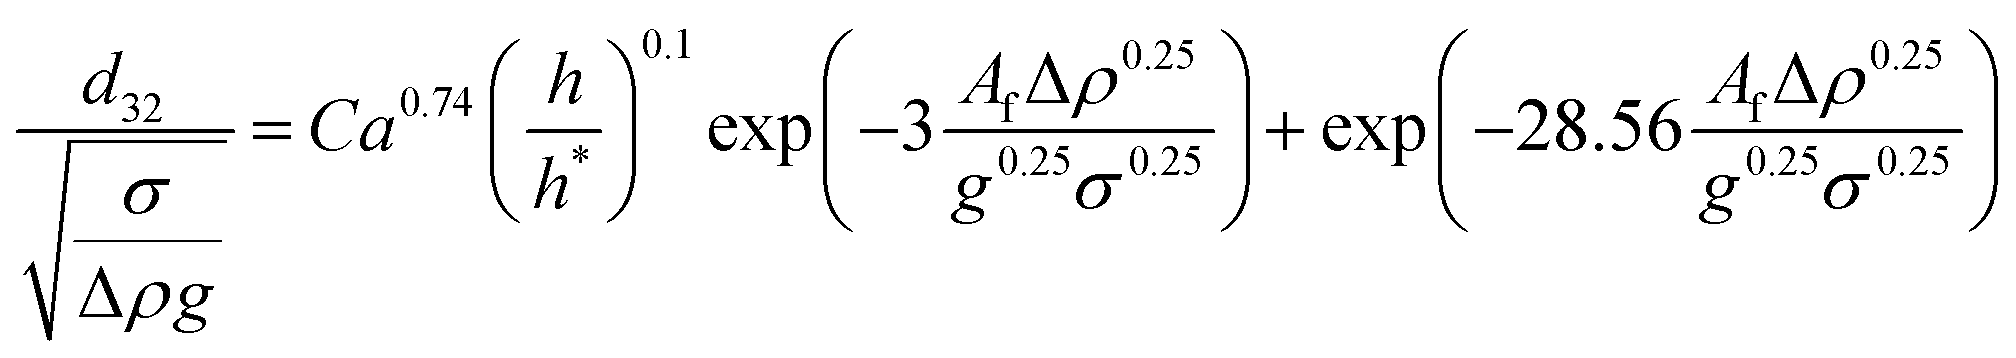 |
Kumar et al.48 |
| VPSPC | 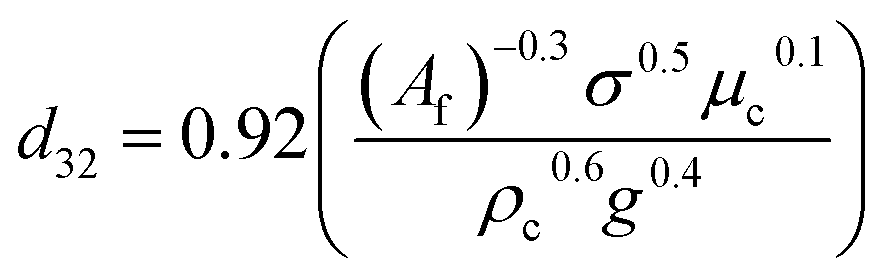 |
Kagan et al.49 |
| VPSPC | 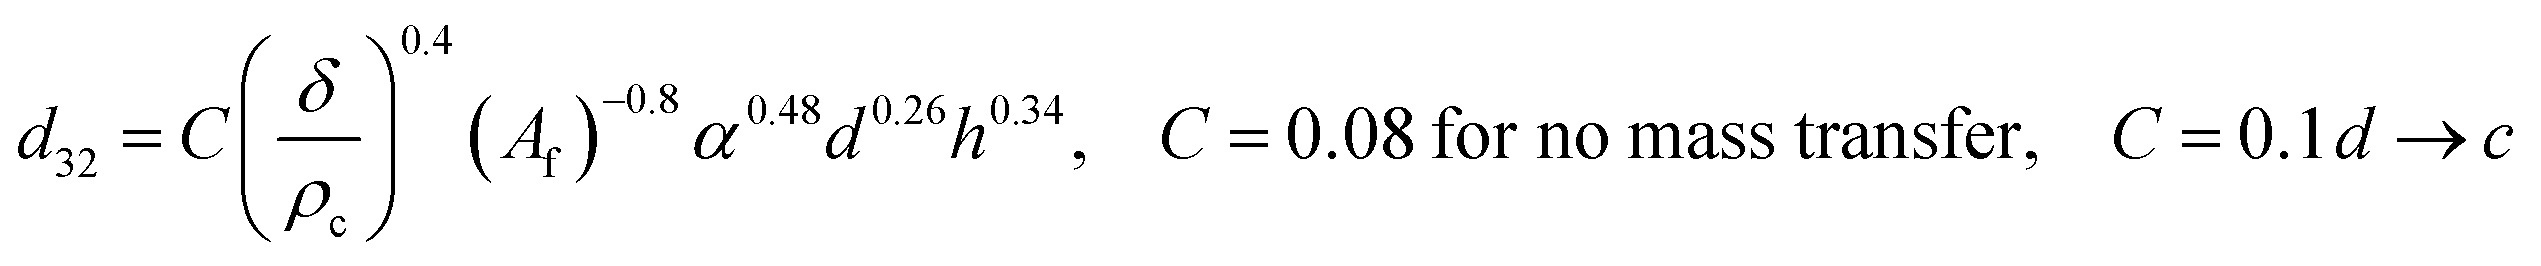 |
Sreenivasulu et al.50 |
| VPPC | 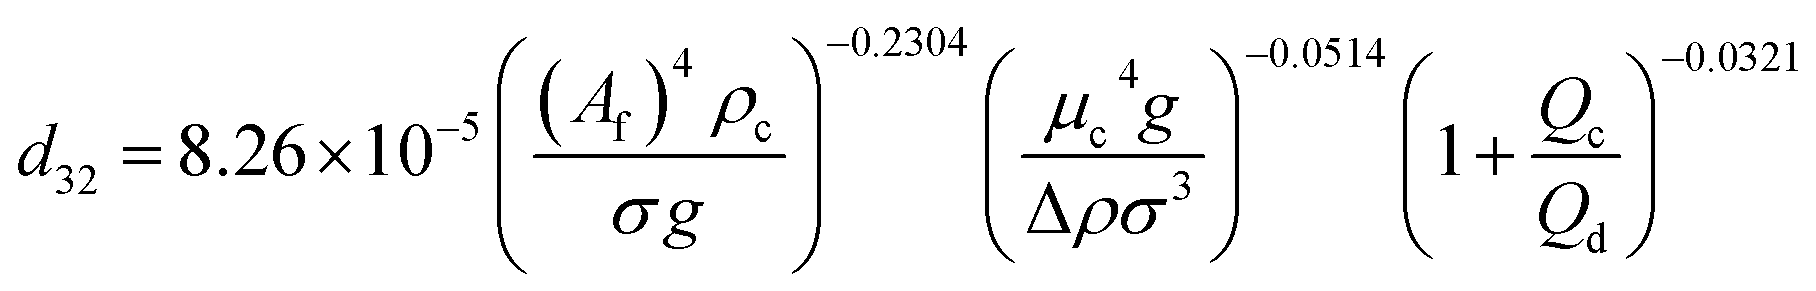 |
Samani et al.51 |
Droplet diameter behavior of LPSPCs was studied by Amani et al.12 Moreover, a new correlation using the dimensional analysis was developed to calculate SMD regarding the physical properties and operation parameters of chemical systems. However, they did not investigate the interaction of parameters with regard to drop size diameter. In order for studying the influence of parameters on the mean drop size, they changed only one parameter and kept the other parameters constant. The central composite design model can be used for evaluating the interaction of various influential parameters on drop size. Based on the studies done so far, The RSM method was investigated in types of extraction columns with different chemical systems.41,52–55 As an example, Khanramaki et al. studied by RSM-CCD the mean drop behaviors in a reactive extraction system with the presence of uranium (sulfate leach liquor – alamine, isodecanol and kerosene) in a horizontal pulsed column.41 Also, Torkaman et al. reported the drop behavior in an Oldshue–Rushton extraction column by RSM-CCD for toluene–water system in the presence of silica nanoparticles.55 Table 2 indicates some studies on the output of extraction columns using the RSM technique.
| System | Column | Variable | Response | Model | R2, adj-R2 | Authors |
|---|---|---|---|---|---|---|
| a dn: nozzle size, n.d: not defined. | ||||||
| Effluent of hydrodistillation of fennel–anisole–hexane | Rotary disc column (RDC) | N [rpm] | Efficiency (E) | Et = −23.01 + 0.7N − 0.28Qd − 7.57dn − 2.07 × 10⁻³NQd + 0.048Ndn + 0.01Qddn − 1.87 × 10⁻³N2 + 0.03Qd2 + 3.12dn2 | 0.964, 0.980 | Eyvazkhani et al.52 |
| Qd [cm3 min−1] | ||||||
| dna [mm] | ||||||
| Effluent of hydrodistillation of fennel–essential oil–hexane | Rotary disc column (RDC) | N [rpm] | Efficiency (E) | E = −0.62922 + 6.3148 × 10⁻³N + 0.010004Qd + 0.48684dn − 2.00758 × 10⁻³Ndn − 8.46013 × 10⁻⁶N2 − 1.255 × 10⁻⁴Qd2 | 0.975, 0.959 | Jafari Ozumchelouei et al.53 |
| Qd [cm3 min−1] | ||||||
| dna [mm] | ||||||
| TBP–nitric acid [0.05 M] | Pulsed disc and doughnut | A: duty cycle (%) | Dispersed phase hold up (φ) | φ = 23 − 2.13A + 9.16B + 6.83C + 2.65D − 1.75AB + 6.15BC + 1.17CD + 0.52AD + 1.25BD + 0.33BCD | n.d, 0.983 | Sinha et al.54 |
| B: Af [m s−1] | ||||||
| C: total throughput [m3 s−1] | ||||||
| D: O/A ratio | ||||||
| Toluene–water | Oldshue–Rushton | N [rpm] | Sauter mean drop diameter (d32) | d32 = 11.062 − 0.045Qd − 0.046Qc − 0.072N + 0.0007QdQc − 2.1 × 10⁻⁵QdN + 7.1 × 10⁻⁶QcN + 0.0008Qd2 + 0.0005Qc2 + 0.0001N2 | 0.961, 0.926 | Torkaman et al.55 |
| Qc [m3 s−1] | ||||||
| Qd [m3 s−1] | ||||||
| Sulfate leach liquor – kerosene | Horizontal pulsed column | Af [cm s−1] | Sauter mean drop diameter (d32) | n.d. | 0.999, 0.977 | Khanramaki et al.41 |
| Qc [L h−1] | Efficiency (E) | |||||
| Qd [L h−1] | ||||||
For the first time, this work examines the effect of operation parameters, interfacial tension, and interaction of parameters on drop size diameter using the central composite design (CCD) model. The CCD is widely used for response surface models of second-order with finite factors numbers (f). For this purpose, three or five levels are used to anticipate response variables and three-dimensional plots. It is actually a combination of three different points, including factorial points, central points and axial points. Factorial points (2f experiments) are vertices of an n-dimensional cube derived from a full or fractional design with factor levels coded as −1, + 1. The experimental domain's central points (c experiments) are located in the center of cube. The center point usually replicates three to six times in the experiments to determine experimental error. Axial points (2f experiments) are located on each face of the cube with respect to the central point at a distance α from the design center. These points are coded as −α, +α.56 Alpha (α) value can be defined as the calculated distance of each individual axial point from the center in the CCD.57 If alpha (α) is less than 1, which indicates that the axial point must be a cube and if it is greater than 1, then it is outside the cube. Therefore, in CCD, for building a second-order polynomial for the response variables in RSM, we need 2f + 2f + c experiments.
To our knowledge, the interactive effect of parameters on drop size diameter has not been examined in LPSPCs. The CCD model evaluates the interaction of different influential parameters on drop size in these columns. In this work, to ensure the statistical significance of SMD, approximately 1000 drops were analyzed for each experiment. Two new correlations were developed in terms of interfacial tension and operating parameters, and their accuracy was confirmed by the analysis of the variance (ANOVA).
There are little researches concerning the hydrodynamic behavior of LPSPC. Considering the important role of the drop diameter in the scale-up and sizing of extraction pulsed columns, no experimental and analytical examination is accessible for an LPSPC. Considering the application of LPSPC in industrial, this study concerns the impact of operating parameters and physical properties on the mean drop size in LPSPC. Finally, new correlations are presented for the calculation of drop size in each section of the extraction column using two methods named dimensional analysis and RSM-CCD. Since the chemical systems used in this study consist of a wide range of interfacial tensions from 1.75 to 35.40 mN m−1, it is expected that the proposed models for other chemical systems with this range of interfacial tensions will be suitable.
2. Experimental
2.1. Liquid–liquid system
In the present research, three liquid–liquid systems of butanol–water (1), butyl acetate–water (2), and toluene–water (3) with a wide range of interfacial tension from 1.75 to 35.40 mN m−1 are studied. These chemicals are endorsed for LLE investigations by the European Federation Chemical Engineering (EFCE).45 The interfacial tension gradients influence the breakage and coalescence rate of droplets and the increased mobility of the interface exerts pressure on the continuous phase film between the drops rapidly, thereby increasing the rate of the droplets' coalescence.43 Therefore interfacial tension plays important roles in determining the drop size. The chemical systems used in this research systems supplied by Merck Company. Technical grade solvents of toluene, butanol and butyl acetate with at least 99.5 wt% purity are used as the dispersed phase. All experiments are performed under flooding conditions at the temperature of 20 °C. A Krüss tensiometer was used to measure the interfacial tension. The picometer method and the DVI-Prime viscometer were applied to calculate the density and viscosity of the aqueous and organic phases, respectively. Table 3 reports the mentioned systems' physical features.12| System 1 | System 2 | System 3 | |
|---|---|---|---|
| Butanol–water | Butyl acetate–water | Toluene–water | |
| σ [mN m−1] | 1.75 | 13.50 | 35.40 |
| ρc [kg m−3] | 985.6 | 997.6 | 998.0 |
| ρd [kg m−3] | 846.0 | 880.0 | 864.0 |
| μc [mPa s−1] | 1.429 | 1.027 | 0.963 |
| μd [mPa s−1] | 3.360 | 0.734 | 0.586 |
2.2. Description of equipment
Fig. 1 displays the pilot LPSPC used for the experiments. The Pyrex glass column consisted of two active parts of horizontal and vertical sections.12 The horizontal part (internal diameter of 6 cm and length of 146 cm) contained 24 pairs of sieve plate. In this section, half-perforated plates with a distance of 1 cm between each plate are arranged in pairs. The distance of each pair in the horizontal segment is 5 cm. The situation of two half-perforated plates in each pair is such that one of the plates is perforated at the top and the other is at the bottom, which makes the better blending of aqueous and organic phases. Additionally, this kind of design helps to more breakage of the droplets. More breakage of droplets causes the production of smaller drops and their movement's speed in the column decreases, which can increase the holdup. Thus, the interfacial area and intensity of mass transfer increase in the column.12,58 | ||
| Fig. 1 LPSPC schematic diagram. | ||
The vertical part's dimensions are similar to those of the horizontal part (with 29 individual sieve-plates). The column's characteristics are given in Table 4. The setup consists of the vertical and horizontal sections as active parts of the column, four tanks, two dosing pumps, lower settler, upper settler, one pulsating air system (one compressor, one regulator, and two solenoid valves) and two rotameters. The two phases are moved in counter-current direction in the column. The organic and aqueous phases enter from the below and top of the column, respectively. The column's outlets and inlets are connected to four tanks. The solenoid valve, mounted at the outlet of continuous phase with the help of an optical sensor on the column's top, controls the interface position of two phases on the top of the column (upper settler). By overflow, the organic process leaves the top of the column. Using compressed air regularly imposed into the air leg connected to the lower settler of the column, the contents of the column are pulsed at the considered amplitude and frequency. In other words, in this column, the pulse is supplied by a compressed air line with the pressure of 1–8 bar. This column controls the frequency by opening and closing the solenoid valves in the compressed air path. In a certain period of time, the air pressure pushes the fluid into the column, and in a certain period of time, in the absence of air pressure, the fluid is pushed back. All experiments are performed at ambient temperature.
| The column parts | Vertical section | Horizontal section |
|---|---|---|
| a Space between two individual plates in a pair.b Space between two pairs in a cell. | ||
| Length of the column's active part [cm] | 146 | 146 |
| Internal diameter of the column's active part [cm] | 6 | 6 |
| Plate thickness [mm] | 1 | 1 |
| Hole diameter [mm] | 2 | 2 |
| Spacing between two plates [cm] | 5 | 1a, 5b |
| Free area fraction [%] | 22 | 11 |
2.3. Experiments
Before preparing the feed, the solutions of the aqueous phase saturated with the organic phase and the organic phase saturated with the aqueous phase due to prevent their mutual solubility during the experiments must be prepared. For this purpose, the two-phase mixed with each other, and then the mixture was shaken well. Afterward, it was kept in closed tanks for several hours to balance. Next, the two phases were easily separated from each other. In the second step, the feed tanks were filled with pre-prepared saturated phases. Then the passage of the phases through the rotameter and the nozzle was carefully aerated to minimize the error in the measurement of the phase flow rates and also keep the initial flow adjusted by the rotameter constant during the test. Next, the rotameter was calibrated. In the third step, after washing the column with tap water, the column was filled with saturated distilled water to the approximate point of phase separation. The saturated distilled water means the aqueous phase saturated with the organic phase that separated from each other after reaching equilibrium. Finally, the flow rate of outlet and inlet continuous phases was adjusted. In the fourth step, the pulse system was set up by adjusting the frequency through the pulse maker, and adjusting the amplitude by opening and closing the air compressor outlet valves. Then the dispersed phase valve was opened to disperse the droplets into the continuous phase. The steady-state condition was achieved after approximately 60–90 min (depending on the characteristics of the used liquid–liquid system as well as the phase flow rates). During this period, the column was photographed at 2nd, 7th, 13th, 19th, and 25th stages of the vertical section and at the 2nd, 6th, 10th, 15th, and 20th stages of the horizontal section for measuring the diameter of drops. Finally, the column was washed and refilled with fresh material for the next test to minimize errors in the experiments.122.4. Procedure
The RSM-CCD method was used to determine the factors' effect in five levels on the drop size. First, the two phases were saturated with another, and then the drop size was determined using photographic method (Nikon D5000 digital camera) at steady-state conditions. In the pulse columns, by the rise of dispersed phase through the column, the distribution of drop size produced by the dispersed phase changes due to the breaking and coalescence of the droplets. Usually, the drop size decreases as the pulsation intensity enhances. In the extraction columns, the drop size distributions are not uniform, so SMD (d32) is employed as the characteristic diameter of the average distribution of drop size as follow:
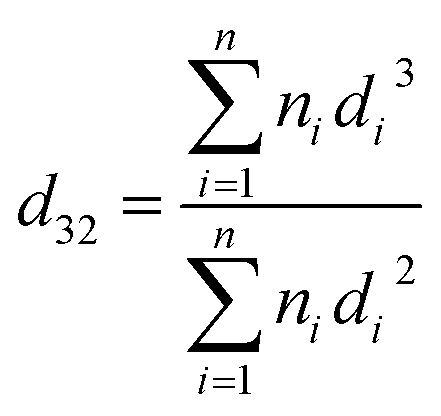 | (1) |
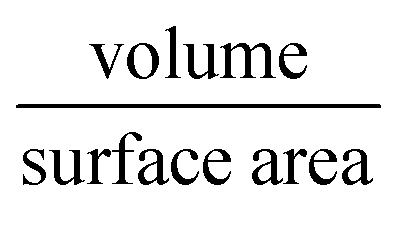 ratio as a particle of interest. The method of calculating the mean diameter across an assortment of various size particles (for fuel oil drops) by considering both volume and surface area was presented by Sauter in 1926.59,60 Kowalczuk and Drzymala presented the physical meaning of SMD. They demonstrated SMD reflected the size of identical spherical particles of which the total surface energy was equal to the total surface energy of poly-sized spherical particles while both systems had the same total volume and total area.61
The flow rate of each phase, frequency and pulse amplitude was set to the desired values.6 The recorded photographs were analyzed by Auto CAD software to determine SMD. In fact, the diameter of the drops in the recorded photographs was measured according to the distance between two plates as a base. Then according to the ratio of the distance between two plates in the column (actual) and the photo, a coordinate grid was defined in which able to easily measure the diameter of drops. It is worth mentioning that the drops can only be measured in two dimensions using photographic techniques.12 For this purpose, nearly 1000 drops were checked for each experiment. The drops are usually spherical; however, they may have ellipsoidal shapes too. The diameter of ellipsoidal drops is calculated as follows:
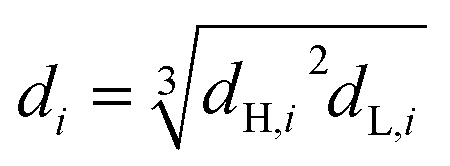 | (2) |
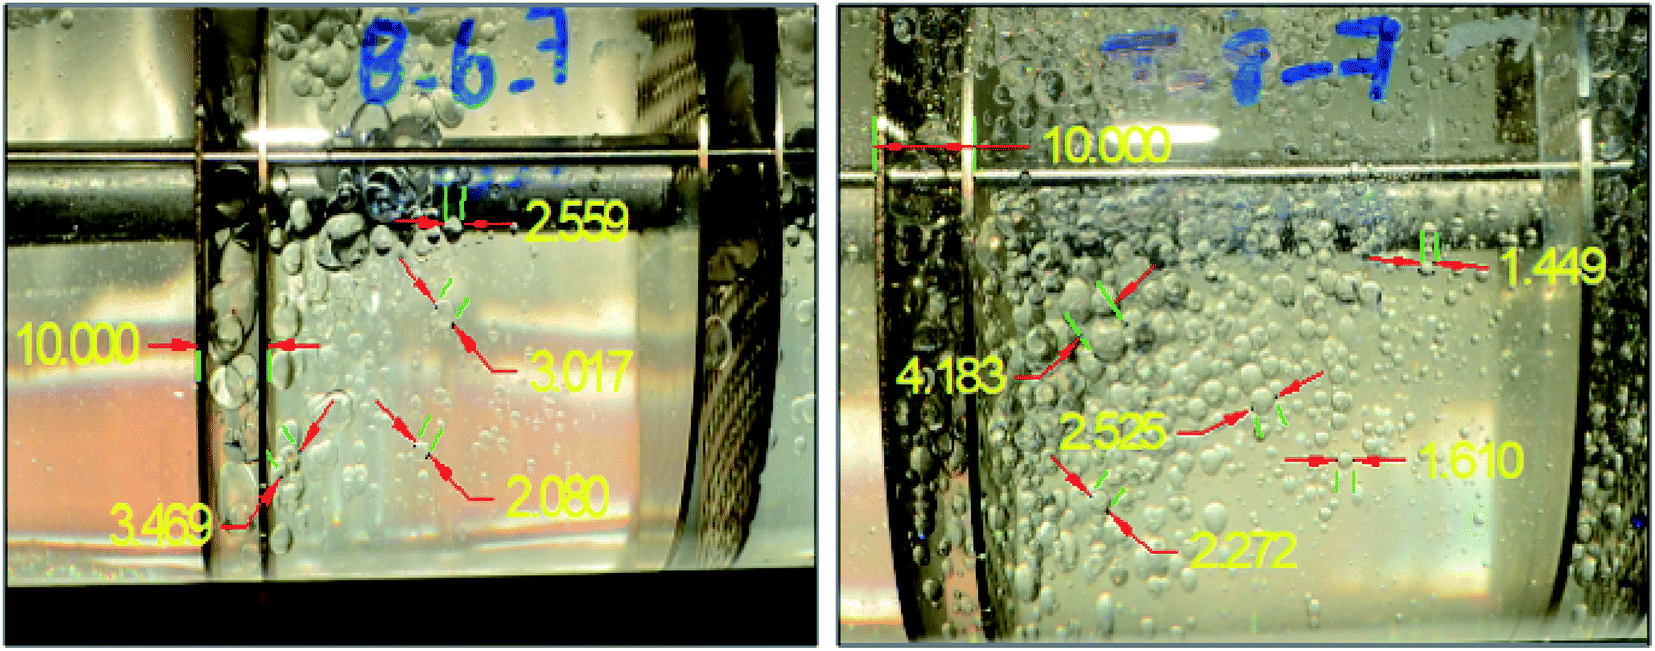 | ||
| Fig. 2 Examples of drops of dispersed phase in the horizontal section. | ||
The average absolute relative error (AARE) is adopted to determine the fitted parameters:
 | (3) |
The critical variables include the pulsation intensity, interfacial tension, dispersed, and continuous phase velocities that affected SMD. According to the findings of Amani et al., there are several factors such as the velocity of continuous and dispersed phases, pulsation intensity, and interfacial tension, which may affect the size of the drops.12 Further optimization was then carried out by the RSM-CCD method. The design characteristics (factors and levels) are reported in Table 5.
| Factors | Units | Level | Coded low | Coded high | Mean | Standard deviation | Relative standard deviation | ||
|---|---|---|---|---|---|---|---|---|---|
| Low | High | ||||||||
| σ | X1 | mN m−1 | 1.75 | 36.00 | −1 ↔ 1.75 | +1 ↔ 36.00 | 17.28 | 14.28 | 0.83 |
| Af | X2 | cm s−1 | 0.60 | 1.30 | −1 ↔ 0.60 | +1 ↔ 1.30 | 0.90 | 0.16 | 0.18 |
| Vc | X3 | mm s−1 | 0.41 | 1.08 | −1 ↔ 0.41 | +1 ↔ 1.08 | 0.63 | 0.24 | 0.38 |
| Vd | X4 | mm s−1 | 0.08 | 0.97 | −1 ↔ 0.08 | +1 ↔ 0.97 | 0.44 | 0.19 | 0.43 |
RSM is one of the appropriate methods for data processing, evaluation, modeling of operational variables, and investigation of their interaction. It describes the curvature dependency of an ordinary response to the variables required for illustrating a non-linear variation behavior. This methodology includes mathematical and statistical methods derived from the empirical models obtained by relating experimental data to setup and using a second-order polynomial model equation.62 One of the aims of RSM is optimization throught (1) diagnosis and expression of the problem, (2) selection of response variable, (3) selection of effective parameters and their ranges, (4) selection of an experiment design including the number of experiments, repetitions, blocks, and the order of the experiments, (5) performance of experiments, (6) data analysis to provide an empirical relationship by a convenient polynomial model, (7) the model's fitness evaluation to experimental data, and (8) optimization of the studied variables:63
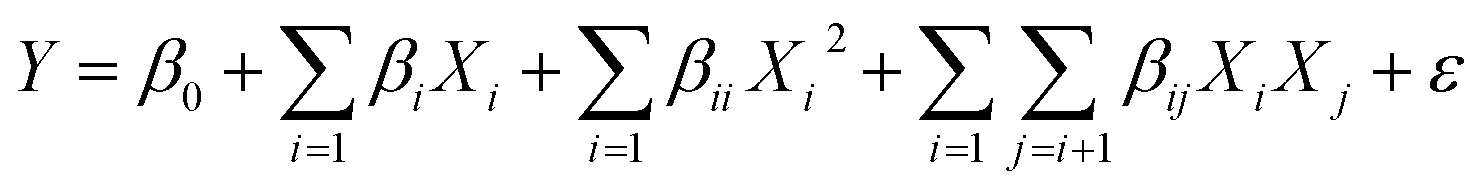 | (4) |
| Response | Name | Units | Observations | Minimum | Maximum | Mean | Standard deviation | Relative standard deviation |
|---|---|---|---|---|---|---|---|---|
| R1 | d32 (vertical) | mm | 58 | 0.80 | 2.60 | 1.76 | 0.64 | 0.36 |
| R2 | d32 (horizontal) | mm | 59 | 0.60 | 1.70 | 1.10 | 0.26 | 0.24 |
ANOVA is a reliable method for evaluating the model's quality. In each experiment, accuracy of the results attracts the most attention. Accordingly, it is very important to examine the types of errors in an experiment. There are three types of errors that can influence the test results: (1) gross errors: to solve this type of error, the test must be repeated. Technical defects of the device are an example of this type of error. (2) Systematic errors: because of these types of errors, the results are always obtained larger or smaller than the expected amounts. These errors can be critical; for example, if a color change is not detected in the titration test, the endpoint is misread and may cause a positive error. (3) Accidental errors: these errors can be observed graphically in the form of points around the expected value of experimental results. Sometimes, this can cause a positive error, and sometimes, a negative error. So, it must be compared with the correct amount of data to identify the data of an experiment. A correct result lacks systematic errors. In addition to accuracy, the data of an experiment must be examined for precision too.63
The basic idea of ANOVA is to contrast the variation due to a variable's change due to a change caused by the inherent accidental errors resulting from the response calculations. Therefore, one can consider the regression importance for evaluating the sources of experimental variance. In ANOVA, the variety of data collections is appraised through a dispersed study. The deviation square is calculated as follows:
| di2 = (yij − ȳ)2 | (5) |
| SStot = SSreg + SSres | (6) |
By repeating the central point in the experiments, it is possible to evaluate the pure error of replications. After that, the residuals sum of the squares is obtained with the pure error sum of the squares (SSpe) and the lack of fit sum of the squares (SSlof):64,65
| SSres = SSpe + SSlof | (7) |
The sum of the squares for all variation sources are displayed in Table 7, where m shows the number of levels, n is total observations, ȳ is the total mean, ȳi is the mean accomplish in a similar set of the experimental conditions, ŷi is the value of estimated for the level i by the model, and yij is the repetitions carried out in every single level. Moreover, the degree of freedom (df) for each variation source is shown in Table 7, in which p represents the number of model parameters.66,67
| Variation source | Regression | Residuals | Lack of fit | Pure error | Total |
|---|---|---|---|---|---|
| Sum of the squares | 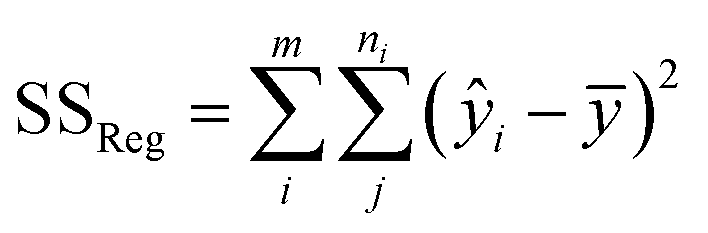 |
 |
 |
 |
 |
| Degree of freedom | p–1 | n–p | m–p | n–m | n–1 |
One of the other key parameters in ANOVA is the mean of squares (MS) obtained by dividing the sum of squares on the degree of freedom. The mean of squares is used to calculate the index F. The ANOVA method uses the F-test to examine the mean equality. The F-test is based on the ratio of the mean of squares. In other words, it is the ratio of two variances. The variance is an index for measuring dispersion, which indicates how much the data is spread relative to the mean. A larger value of variance demonstrates a greater dispersion.
The importance of each of these above effects is expressed by the parameter P in ANOVA. Based on this parameter, one can conclude whether the main and square effects and the effects related to the interaction are important or not. If the value of P is less than 0.05, the effect can be considered important with 95% probability. For P-value > 0.05, none of the linear and square terms, and the rest of the interaction terms is significant.62,67
3. Results and discussions
3.1. RSM
The effect of different variables including interfacial tension, dispersed, and continuous phase velocities, and pulsation intensity on the drop size was analyzed. The RSM containing the face-center centric approach was applied to find the useful variables involved in the system. This method suggested the quadratic models based on the coefficients of empirical data presented in eqn (4) for horizontal and vertical sections (Table 8).| Response/d32 (mm) | Correlation | Equation |
|---|---|---|
| d32 for horizontal section | d32 = 2.4448 + 0.0327X1 − 3.5472X2 − 0.1802X3 + 0.4312X4 − 0.0159X1X2 + 0.0009X3 + 0.0161X1X4 + 0.5348X2X3 − 0.6169X2X4 + 0.5418X3X4 − 0.0001X12 + 1.6196X22 − 0.2484X32 − 0.2065X42 | (8) |
| d32 for vertical section | d32 = 0.5308 + 0.1169X1 + 0.0709X2 + 0.5073X3 + 0.6951X4 − 0.0236X1X2 − 0.0022X1X3 − 0.0127X1X4 − 0.2479X2X3 − 0.4094X4 − 0.7147X3X4 − 0.0009X12 − 0.0944X22 + 0.0595X32 + 0.5362X42 | (9) |
Equations of actual factors are utilized for predicting the responses of each factor at given levels. The levels must be mentioned in original units. These equations are not appropriate for determining the relative impact of the factors because the coefficients are scaled to accommodate each factor's units and the intercept is not at the center of the design space. The ANOVA results and their statistical specifications for horizontal and vertical sections are reported in Table 9.
| Source | Sum of squares | Horizontal section | Sum of squares | Vertical section | ||||||||
|---|---|---|---|---|---|---|---|---|---|---|---|---|
| df | Mean square | Standard error | F-Value | P-Value | df | Mean square | Standard error | F-Value | P-Value | |||
| Model | 3.7600 | 14 | 0.2683 | 0.0231 | 138.10 | <0.0001 | 23.4100 | 14 | 1.6721 | 0.0133 | 2732.69 | <0.0001 |
| X1: σ | 0.1911 | 1 | 0.1911 | 0.0384 | 98.34 | <0.0001 | 0.8679 | 1 | 0.8679 | 0.0220 | 1418.51 | <0.0001 |
| X2: Af | 0.0206 | 1 | 0.0206 | 0.0745 | 10.61 | 0.0022 | 0.0307 | 1 | 0.0307 | 0.0429 | 50.20 | <0.0001 |
| X3: Vc | 0.0861 | 1 | 0.0861 | 0.0129 | 44.31 | <0.0001 | 0.0042 | 1 | 0.0042 | 0.0073 | 6.85 | 0.0122 |
| X4:Vd | 0.0733 | 1 | 0.0733 | 0.0243 | 37.73 | <0.0001 | 0.0092 | 1 | 0.0092 | 0.0136 | 15.10 | 0.0003 |
| X1X2: σ × Af | 0.0139 | 1 | 0.0139 | 0.0356 | 7.17 | 0.0104 | 0.0180 | 1 | 0.018 | 0.0274 | 29.42 | <0.0001 |
| X1X3: σ × Vc | 0.0001 | 1 | 0.0001 | 0.0286 | 0.037 | 0.8491 | 0.0009 | 1 | 0.0009 | 0.0161 | 1.5200 | 0.2239 |
| X1X4: σ × Vd | 0.0041 | 1 | 0.0041 | 0.0838 | 2.120 | 0.1528 | 0.0046 | 1 | 0.0046 | 0.0470 | 7.5700 | 0.0086 |
| X2X3: Af × Vc | 0.0022 | 1 | 0.0022 | 0.0580 | 1.150 | 0.2901 | 0.0002 | 1 | 0.0002 | 0.0326 | 0.2817 | 0.5983 |
| X2X4: Af × Vd | 0.0009 | 1 | 0.0009 | 0.1417 | 0.457 | 0.5026 | 0.0000 | 1 | 0.0000 | 0.0795 | 0.0441 | 0.8347 |
| X3X4: Vc × Vd | 0.0190 | 1 | 0.0190 | 0.0255 | 9.790 | 0.0031 | 0.0409 | 1 | 0.0409 | 0.0143 | 66.86 | <0.0001 |
| X12: σ2 | 0.0046 | 1 | 0.0046 | 0.0225 | 2.350 | 0.1326 | 0.2026 | 1 | 0.2026 | 0.0158 | 331.13 | <0.0001 |
| X22: Af2 | 0.0463 | 1 | 0.0463 | 0.0406 | 23.84 | <0.0001 | 0.0000 | 1 | 0.0000 | 0.0244 | 0.0197 | 0.8891 |
| X32: Vc2 | 0.0061 | 1 | 0.0061 | 0.0155 | 3.13 | 0.0836 | 0.0000 | 1 | 0.0000 | 0.0087 | 0.0277 | 0.8685 |
| X42: Vd2 | 0.0031 | 1 | 0.0031 | 0.0320 | 1.61 | 0.2113 | 0.0188 | 1 | 0.0188 | 0.0180 | 30.75 | <0.0001 |
| Residual | 0.0855 | 44 | 0.0019 | — | — | — | 0.0263 | 43 | 0.0006 | — | — | — |
| Lack of fit | 0.0753 | 38 | 0.0020 | — | 1.17 | 0.4646 | 0.0251 | 37 | 0.0007 | — | 3.51 | 0.0597 |
| Pure error | 0.0102 | 6 | 0.0017 | — | — | — | 0.0012 | 6 | 0.0002 | — | — | — |
| Cor total | 3.8400 | 58 | 0.0662 | — | — | — | 23.4300 | 57 | 0.4111 | — | — | — |
Table 9 shows the quality of the regression evaluated by ANOVA. Based on the P- and F-values, the significant model terms are σ, Af, Vc, Vd, σ × Af, Vc × Vd, and Af2 for the horizontal section, and σ, Af, Vc, Vd, σ × Af, σ × Vd, Vc × Vd, σ2, and Vd2 for the vertical section. Another important parameter is the lack of fit used to determine the degree of data mismatch with the proposed model. If the P-value for this test is less than the confidence level of 0.05, there is no conformity between the model and the data; in other words, there is a lack of fit. In the models obtained with total terms, lack of fit P-value for both of the horizontal and vertical sections is not significant (0.4646 and 0.0597, respectively). In addition, Table 10 presents lack of fit tests results for horizontal and vertical sections. As can be seen, based on the amount of lack of fit, the quadratic model is more appropriate.
| Source | Sum of squares | Horizontal section | Sum of squares | Vertical section | ||||||
|---|---|---|---|---|---|---|---|---|---|---|
| df | Mean square | F-Value | Lack of fit p-value | df | Mean square | F-Value | Lack of fit p-value | |||
| Linear | 0.2164 | 48 | 0.0045 | 2.6600 | 0.1096 | 1.2400 | 47 | 0.0264 | 135.97 | < 0.0001 |
| 2FI (two factor interaction) | 0.1434 | 42 | 0.0034 | 2.0100 | 0.1930 | 0.2746 | 41 | 0.0067 | 34.5500 | 0.0001 |
| Quadratic | 0.0753 | 38 | 0.0020 | 1.1700 | 0.4646 | 0.0251 | 37 | 0.0007 | 3.5100 | 0.0597 |
Table 11 shows T-test results for the horizontal and vertical sections. The T-test is one of the main concepts in statistical fields. This test is used to determine whether there is a significant difference between the means of the two groups (actual data of SMD and model data of SMD).67 In this research, paired-samples T-test is utilized.
| Name | Paired differences | t | df | Significant (2-tailed) | ||||||
|---|---|---|---|---|---|---|---|---|---|---|
| Mean | Standard deviation | Standard error mean | 95% confidence interval of the difference | |||||||
| Lower | Upper | |||||||||
| Horizontal section: pair 1 actual-model | 0.0003 | 0.0376 | 0.0049 | −0.0095 | 0.1009 | 0.5800 | 58 | 0.9540 | ||
| Vertical section: pair 1 actual-model | −0.0005 | 0.2139 | 0.0028 | −0.0061 | 0.0051 | −0.1840 | 57 | 0.8550 | ||
As shown in Table 11, the significant value is obtained as 0.9540 and 0.8550 for the horizontal and vertical sections, respectively. Since the significant values are greater than 0.05, there is no statistically significant difference between the actual and model data. Therefore, the proposed RSM model is suitable for experimental data predictions.
3.2. Fit statistics
One of the coefficients indicating the proportionality of the data with the model is the coefficient of determination (R2). R2 values of 0.9980 and 0.9780 for the vertical and horizontal sections, respectively demonstrate the data fits the models very well. The high values of R2 illustrate a good agreement between the calculated results and actual values shown in Fig. 3–5. For very suitable model data, R2 values should be at least 0.8.63 The adjusted R2 value exhibits the overlap and adaptation of the modeled and empirical data, which is obtained by removing and reducing some factors in the initial model. As some of the factors are removed, the overlap value becomes weaker. The adjusted R2 values of 0.9980 and 0.9710 obtained for vertical and horizontal sections, respectively, imply that the selected variables are suitable for the models. The predicted R2 determines that the regression model is able to make predictions very well. This can be used to detect cases where the model provides a good fit for the available data; however, it is not as good at making predictions. The software determines the predicted R2 by deleting one of the data points from the database, estimating the regression model, appraising the model's ability to predict the missing observation, and repeating this procedure for all data points. A good prediction of the proposed models was confirmed by the predicted R2 values of 0.9976 and 0.9490 for the vertical and horizontal sections, respectively. The adequate precisions were 138.1490 and 46.0450 for the vertical and horizontal sections, respectively. The adequate precision of higher than four demonstrates that the noise ratio of the model is in the desired point.56 Table 12 presents a summary of fit statistics for the horizontal and vertical sections.| Source | Standard deviation | Horizontal section | Standard deviation | Vertical section | ||||
|---|---|---|---|---|---|---|---|---|
| R2 | Adjusted R2 | Predicted R2 | R2 | Adjusted R2 | Predicted R2 | |||
| Linear | 0.0648 | 0.9410 | 0.9367 | 0.9221 | 0.1530 | 0.9471 | 0.9431 | 0.9343 |
| 2FI (two factor interaction) | 0.0566 | 0.9600 | 0.9517 | 0.9196 | 0.0766 | 0.9882 | 0.9857 | 0.9786 |
| Quadratic | 0.0441 | 0.9780 | 0.9710 | 0.9490 | 0.0247 | 0.9980 | 0.9980 | 0.9976 |
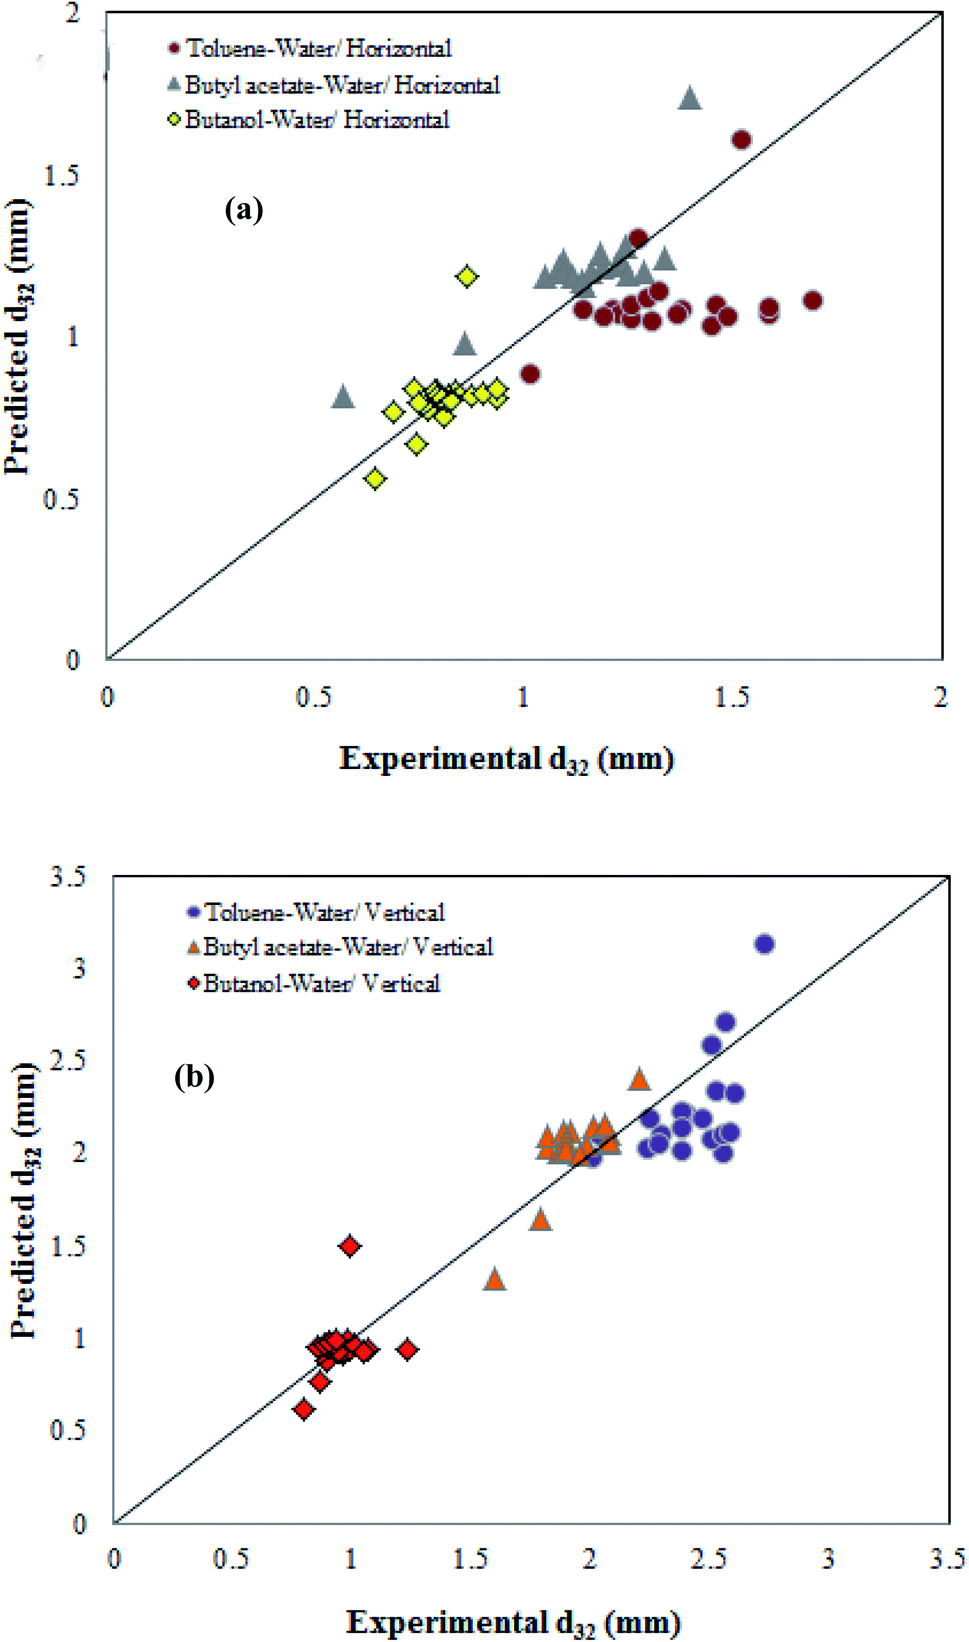
Fig. 3 compares the predicted and actual values of SMD for the vertical and horizontal sections in Fig. 3. As shown, the actual and calculated results are very close to each other in the range of experimental conditions. In general, the residuals were normally distributed and placed on a straight line. Therefore, they are suitable models for the experimental data, and can be used to analyze and predict the Suter mean drop diameter.
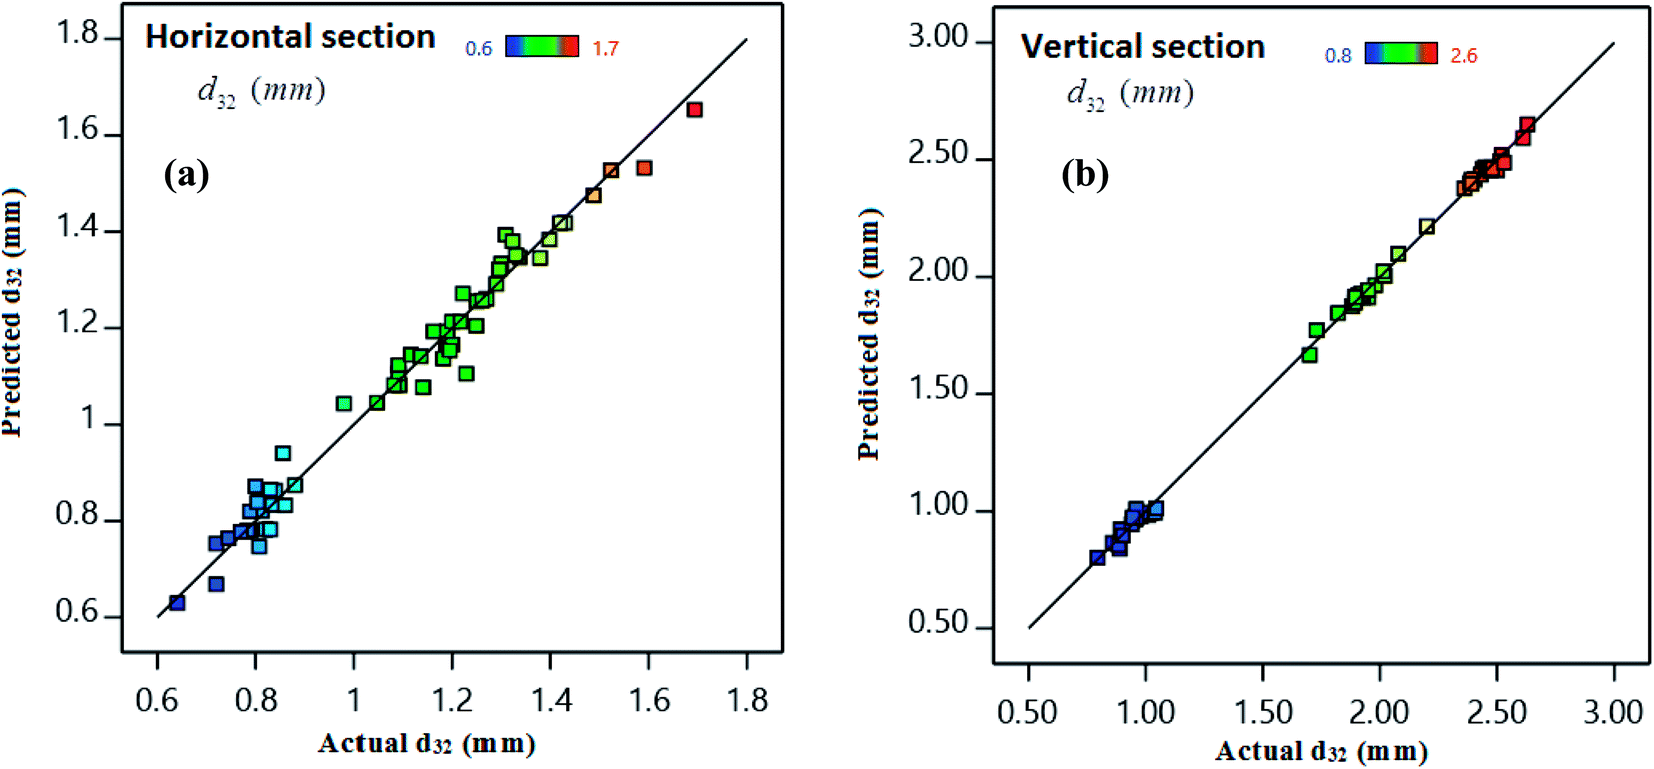 | ||
| Fig. 3 Actual (d32) versus predicted values (d32) for (a) horizontal and (b) vertical sections. | ||
The residuals from the least-squares are a meaningful criterion for consideration of the models' adequacy. The hypothesis of constant variance at distinct levels has been taken into account in Fig. 4. Fig. 4 shows a random distribution of points in the X-axis between −3.5880 and +3.5880 for both horizontal and vertical sections. This result illustrates the models' consistency and a constant variance within the response values.
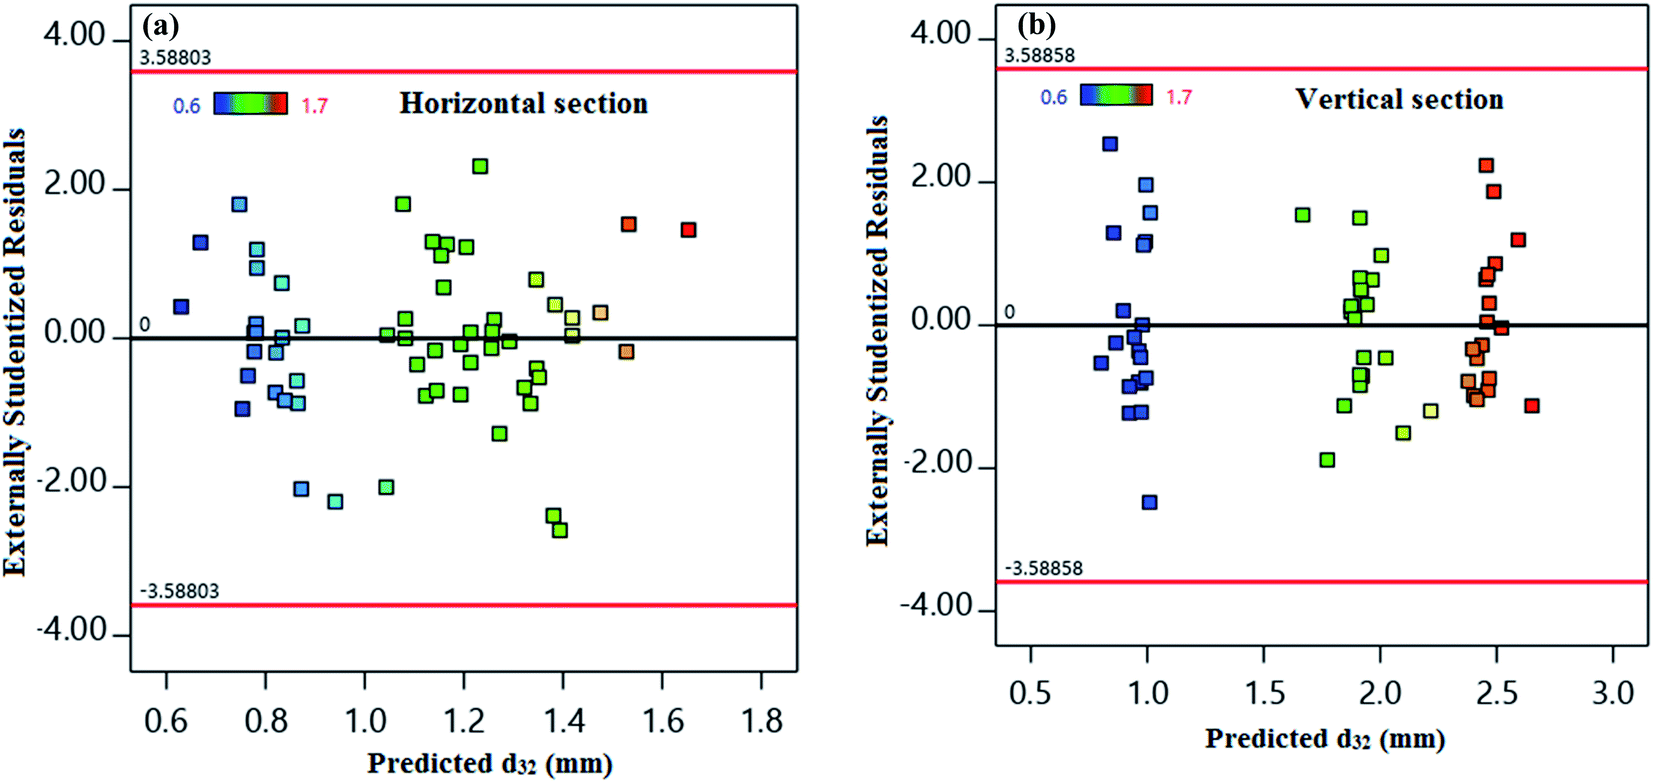 | ||
| Fig. 4 Predicted values of d32 versus externally studentized residuals for (a) horizontal and (b) vertical sections. | ||
The normal probability diagram is one of the extra tools to investigate the adequacy of the models, which is shown in Fig. 5. The results showed that the points are located on a straight line, confirming the normally distributed errors with a constant mean.
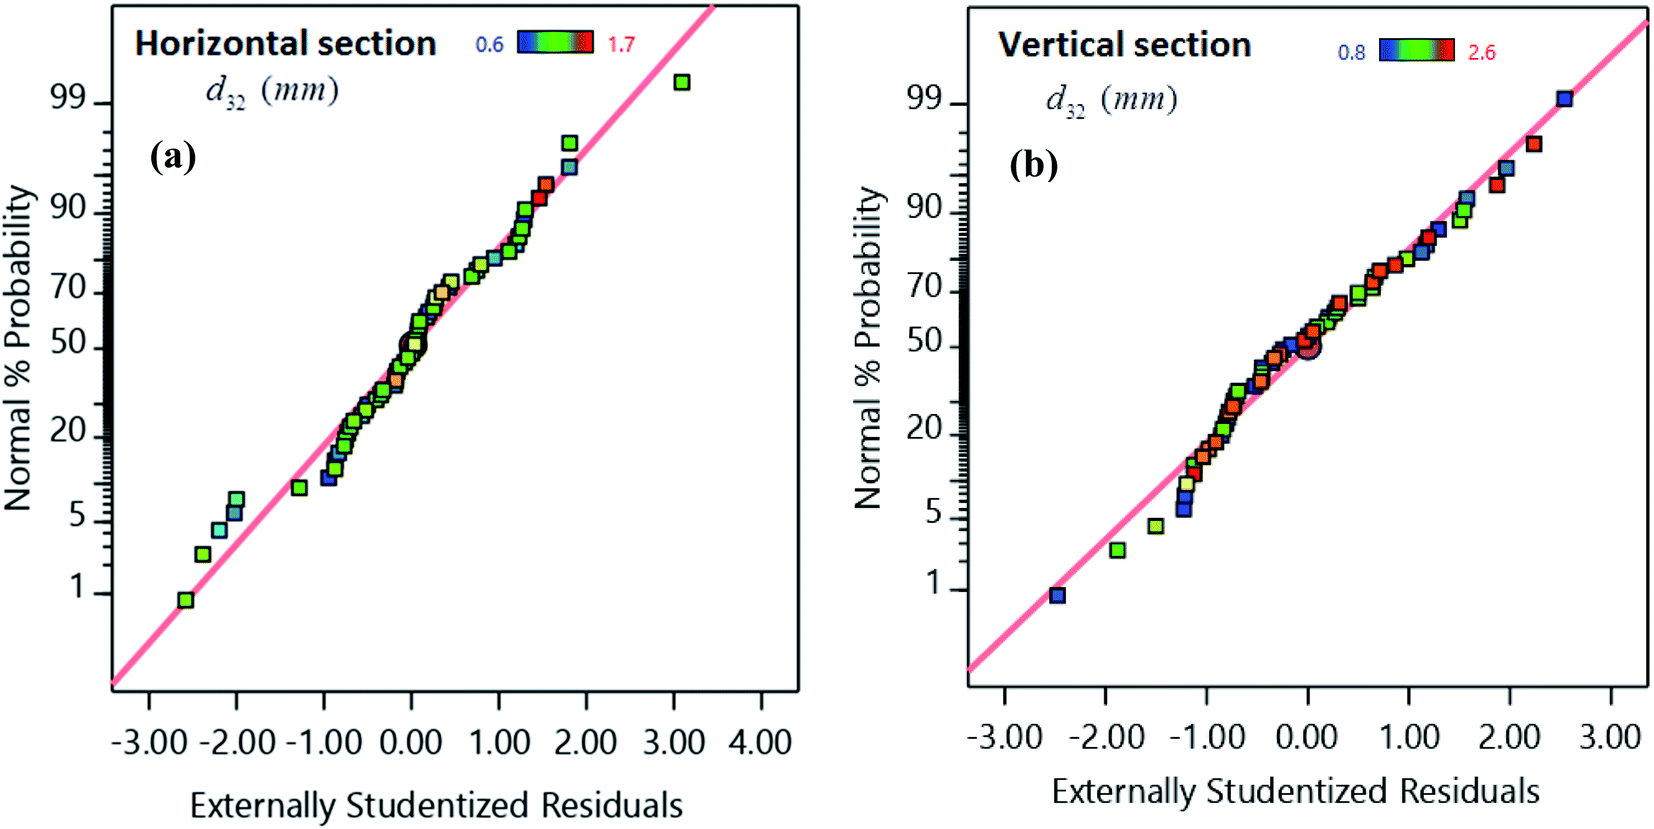 | ||
| Fig. 5 Externally studentized residuals versus normal probability for (a) horizontal and (b) vertical sections. | ||
3.3. Impact of model parameters on SMD
We used 3-D response surfaces for demonstrating the maximum impact of the two model parameters on SMD under the constant conditions for other parameters. Fig. 6 displays the influence of interfacial tension and pulsation intensity on SMD. Based on Fig. 6, increasing the pulsation intensity may decrease the drop size within both parts of the column, because by increasing the pulsation intensity, the breakage rate of droplets overcomes their coalescence rate reduction, so the mean droplet size decreases at higher pulsation intensity.6 Additionally, droplets formed by high interfacial tension systems are larger in size than droplets produced by lower interfacial tension systems. In other words, in the systems with lower interfacial tension (butanol/water), droplet coalescence is less than in the systems with higher interfacial tension (toluene/water), which decreases the droplet size. Consequently, with a decrease in drop diameters, there will be an increment in the interfacial area that will lead to an increase in mass transfer.58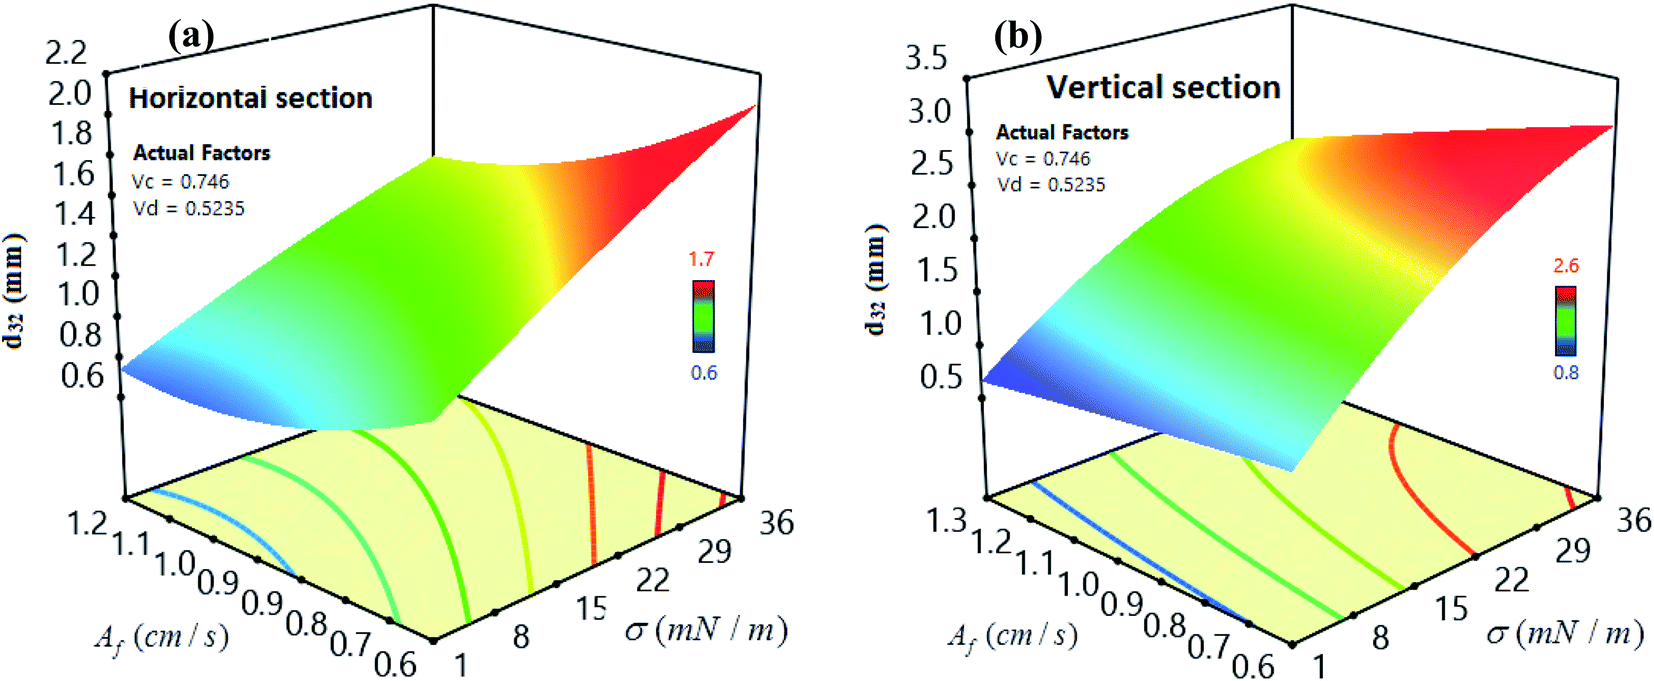 | ||
| Fig. 6 Impact of interfacial tension and pulsation intensity on SMD for (a) horizontal and (b) vertical sections. | ||
Fig. 7 indicates the effects of the velocities of the continuous and dispersed phases on SMD. As illustrated, a higher Vd value enhances the number of the dispersed phase drops to a greater extent together with the formation of more massive drops. In addition, the increase in Vc value enhances the drag forces between the bulk of the continuous phase and the dispersed phase drops.12,58
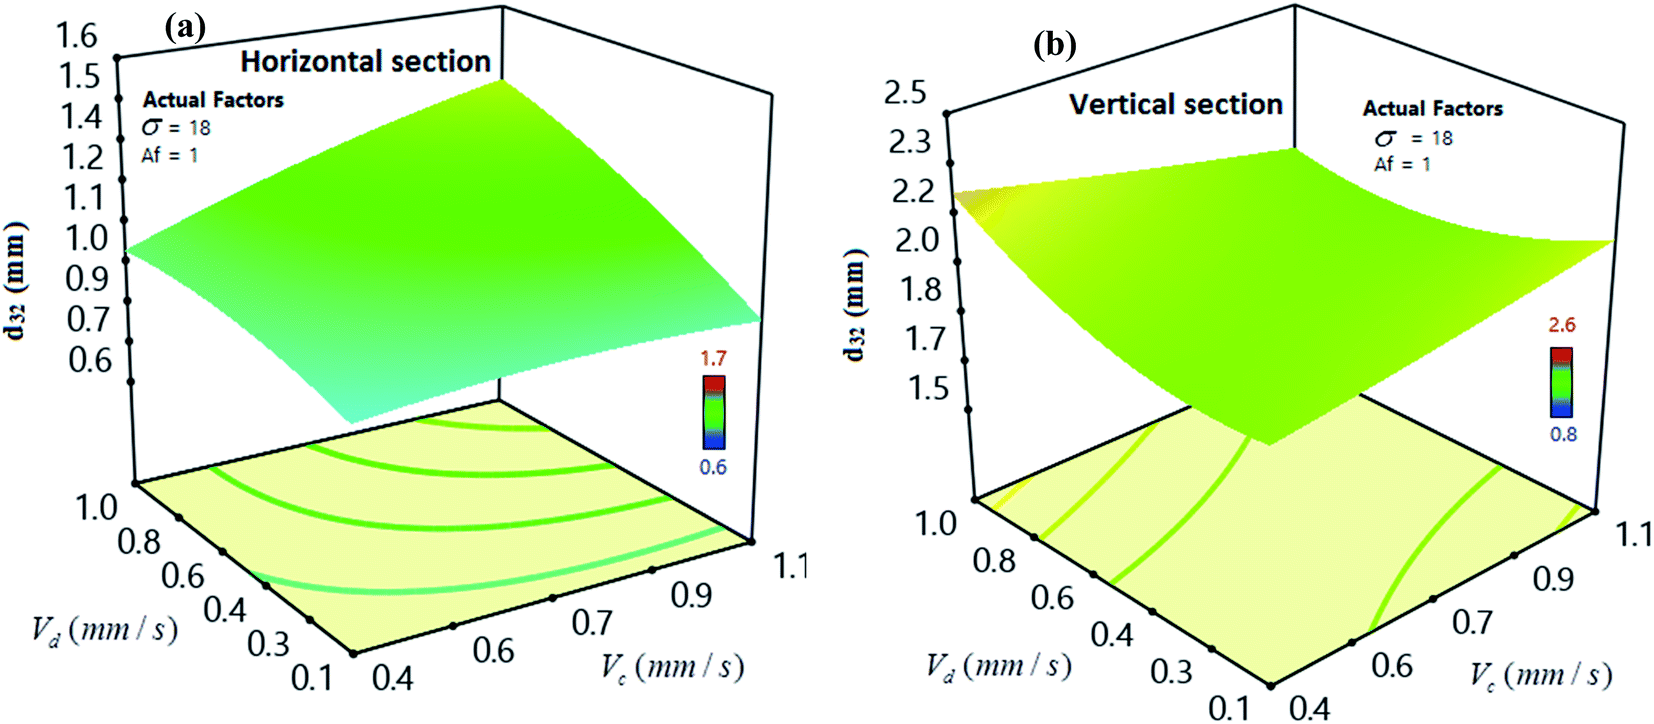 | ||
| Fig. 7 Impact of the velocity of continuous phase and velocity of dispersed phase on SMD for (a) horizontal (b) vertical sections. | ||
3.4. Optimization
The interfacial area accessible for the mass transfer is directly impacted by the drop size distribution, and small droplets leading to an increment in interfacial area.58 Consequently, droplet size plays a very important role in optimizing the operation of the pulsed extraction columns. Therefore, the aim of this study is to minimize the diameter of the droplets. The optimization based on the RSM method provided various responses of variables to achieve the best SMD. Numerical optimization can be used to determine a desirable value for each input parameter and response. The present research provided the input data variables to specify ranged values, since the response had been designed to get a minimum value. Under this situation, the minimum SMD is obtained at both parts of the column. The optimum SMD was obtained 0.64 and 0.79 mm for the vertical and horizontal sections, respectively. As expected, the optimization results are in satisfactory agreement with the experimental results. According to experimental results, in different chemical systems, lower interfacial tension and higher pulsation intensity lead to smaller droplets. As shown in Table 13, the optimal points were gained at the interfacial tension, pulsation intensity, and velocities of the dispersed and continuous phases of 1.84 [mN m−1], 1.23 cm s−1, 0.48 [mm s−1], and 0.44 [mm s−1], respectively.| Parameter and response | Constrain | Low | High | Importance | Optimum condition |
|---|---|---|---|---|---|
| σ [mN m−1] | In range | 1.75 | 36.00 | 3 | 1.84 |
| Af [cm s−1] | In range | 0.60 | 1.30 | 3 | 1.23 |
| Vc [mm s−1] | In range | 0.41 | 1.08 | 3 | 0.44 |
| Vd [mm s−1] | In range | 0.08 | 0.97 | 3 | 0.48 |
| d32 [mm] (horizontal) | Minimize | 0.79 | 2.63 | 5 | 0.79 |
| d32 [mm] (vertical) | Minimize | 0.64 | 1.69 | 5 | 0.64 |
3.5. Deviation plots
Fig. 8 illustrates a perturbation plot and compares the influence of operational variables at the reference points. As can be observed for the horizontal section, SMD increases with increasing the interfacial tension and velocity of the continuous phase, and decreases with increasing the pulsation intensity and velocity of the dispersed phase. Regarding the vertical section, SMD increases by increasing the interfacial tension and velocity of the dispersed phase and decreases by raising the pulsation intensity. Furthermore, by increasing the velocity of continuous phase, SMD remains unaffected in the vertical section.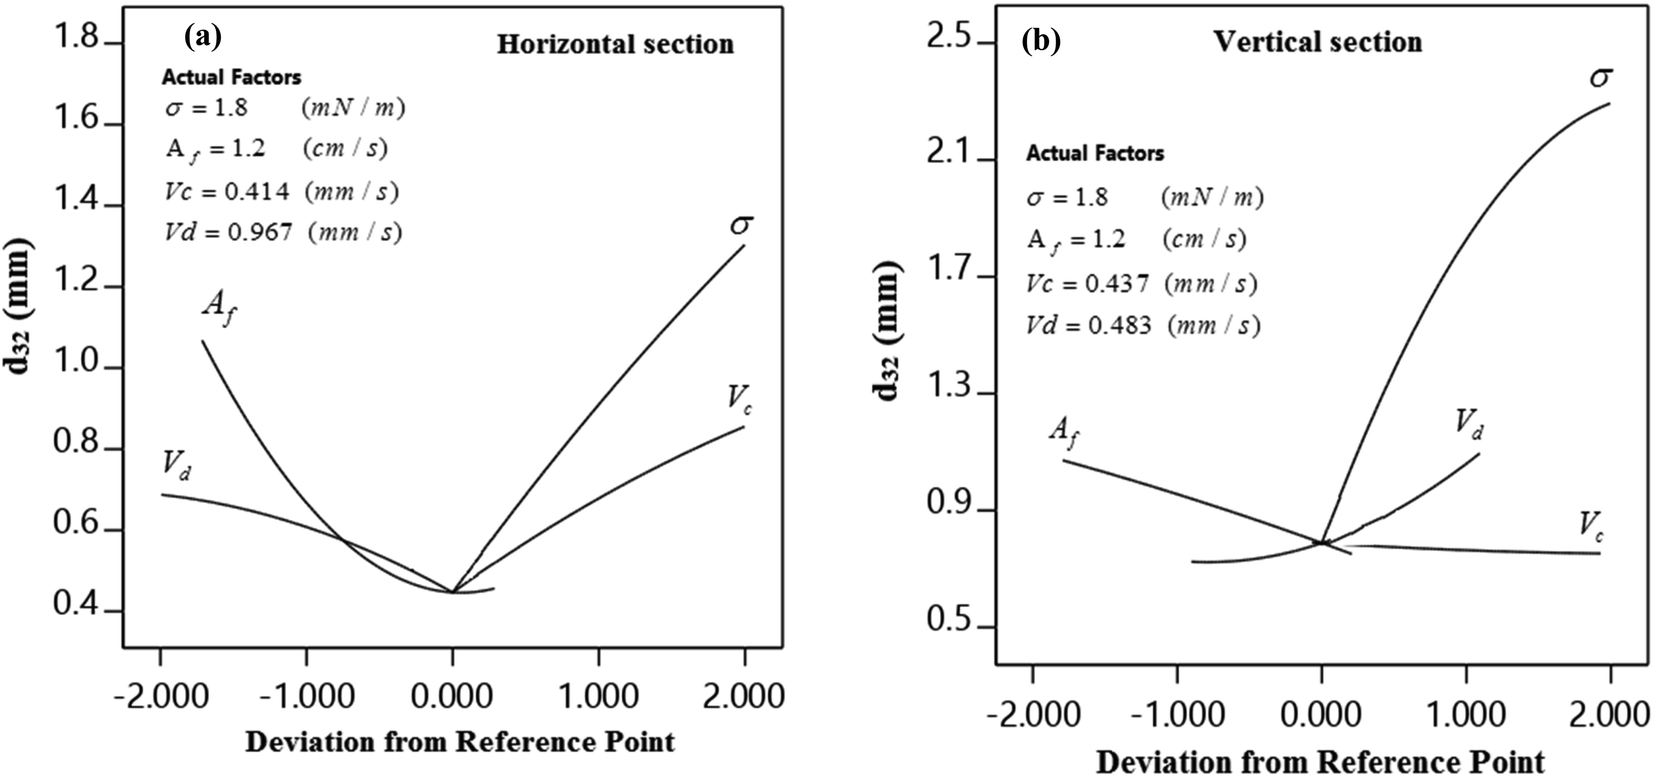 | ||
| Fig. 8 Deviation curves for SMD for (a) horizontal and (b) vertical sections. | ||
3.6. Comparison of our experimental data with those reported by others
The results of this study are compared with some of the correlations in the literature for calculation of the mean drop size.40,42,43,49,50 Fig. 9 compares our experimental data with those published in the literature.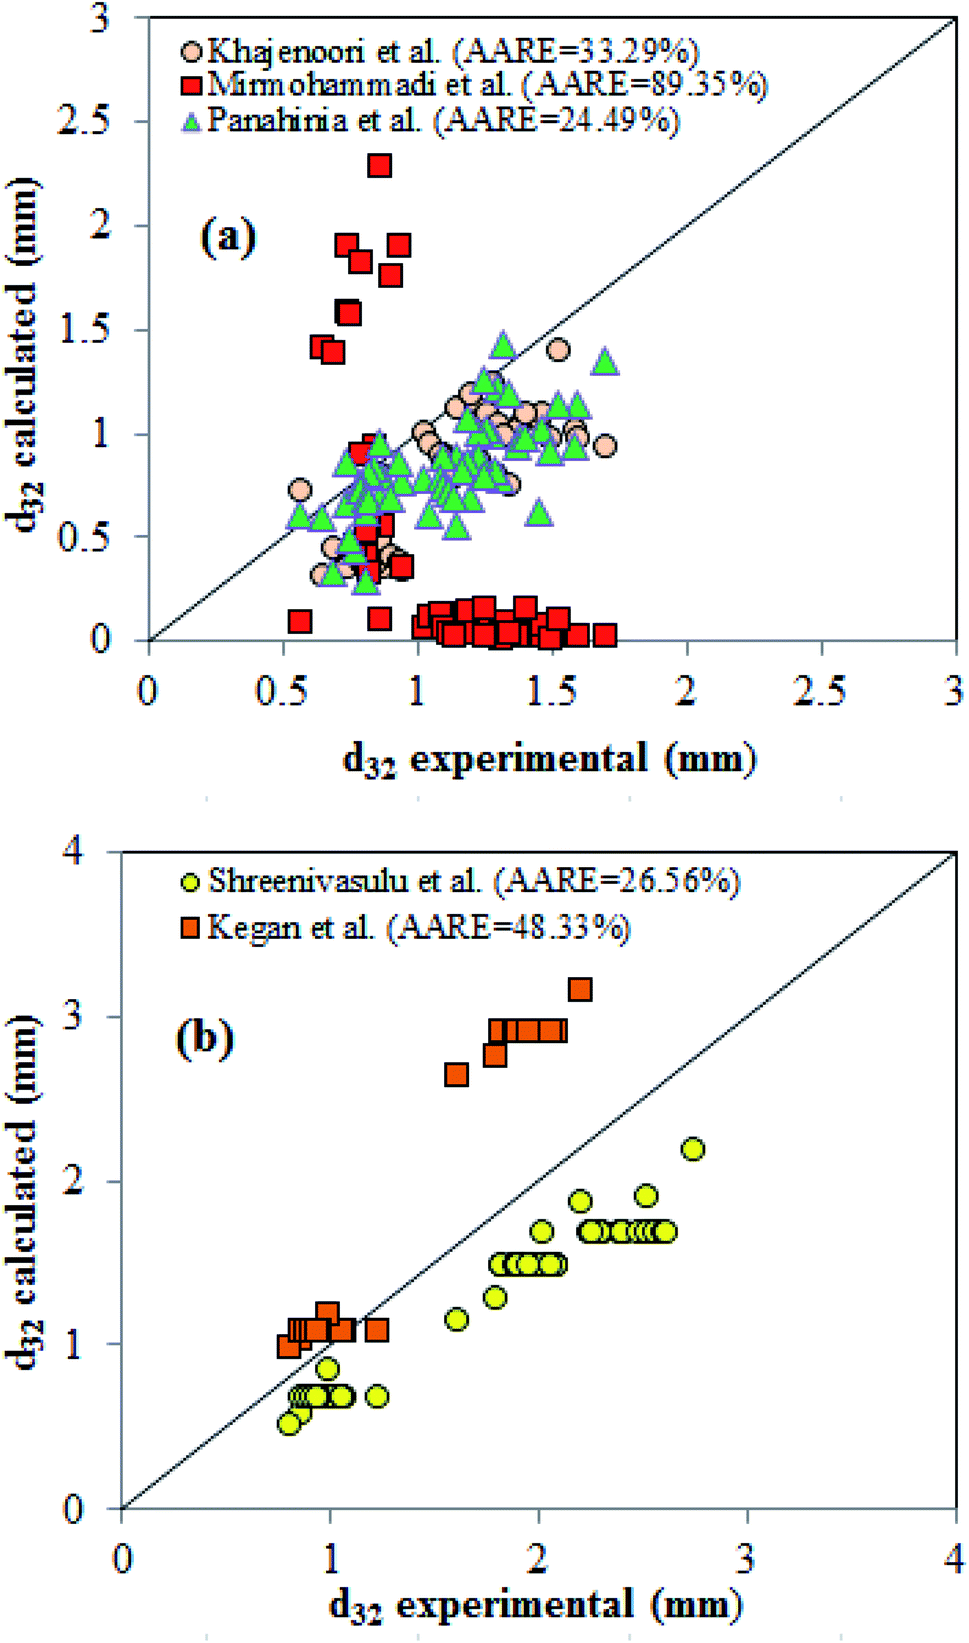 | ||
| Fig. 9 Comparison of drop size correlations in a pulsed column with the experimental results for (a) horizontal; (b) vertical sections. | ||
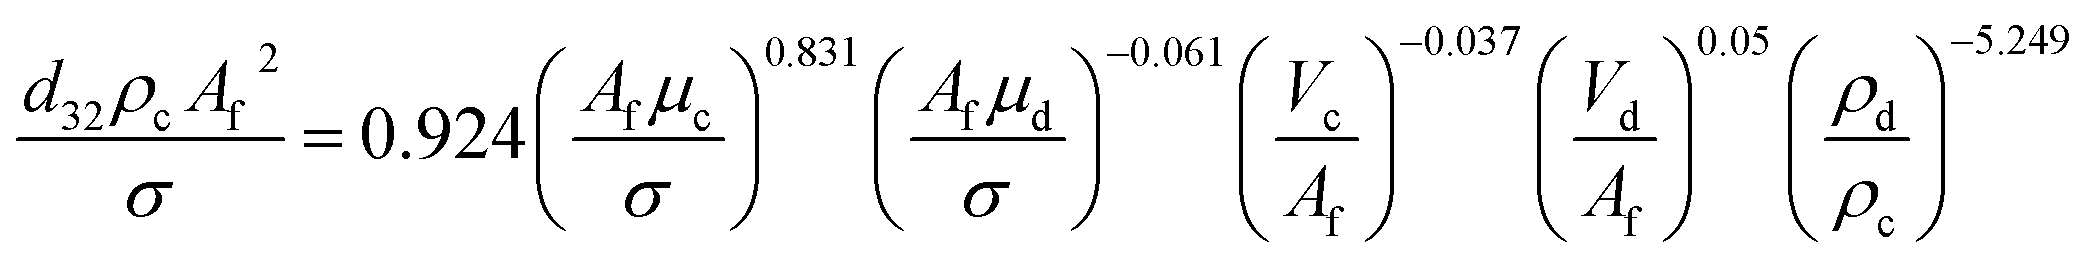
The reported values of AARE clearly show that none of the proposed correlations are able to accurately predict the experimental results in LPSPC. As shown in Fig. 3, the RSM model predicted values and the actual results are near to each other, indicating the appropriate efficiency of the proposed model. Furthermore, new correlations are proposed to predict SMD as a function of physical properties liquid systems and operational parameters by dimensional analysis method as follows. For horizontal section:
 | (8) |
For vertical section:
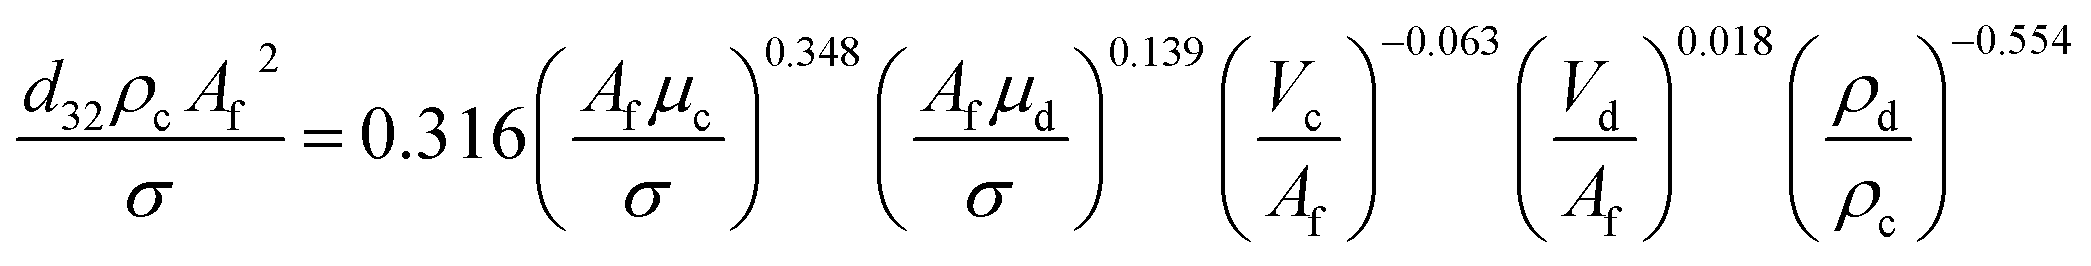 | (9) |
These correlations had AARE values of 11.89% and 9.33%, respectively. A comparison of experimental data of SMD with those calculated by eqn (10) and (11) are presented in Fig. 10 for the horizontal and vertical sections. Fig. 10 shows a good agreement between the experimental and calculated data.
 | ||
| Fig. 10 Comparison of experimental data of SMD with those calculated by eqn (10) and (11) for (a) horizontal; (b) vertical sections. | ||
4. Conclusion
We examined the drop behavior in the present work in a pilot plant pulse-sieve plate horizontal-column. The influence of the four parameters of interfacial tension, velocity of continuous and dispersed phases, and pulsation intensity were investigated using RSM according to the CCD approach. The optimum SMD was obtained as 0.64 and 0.79 mm for the vertical and horizontal sections, respectively at the interfacial tension of 1.84 [mN m−1], pulsation intensity of 1.23 [cm s−1], continuous phase velocity of 0.44 [mm s−1], and dispersed phase velocity of 0.48 mm s−1. The RSM suggested two quadratic models in terms of independent variables for the vertical and horizontal sections. The value of R2 for the considered models was 99.87 and 97.77% for the vertical and horizontal sections, respectively, showing a good consistency between the predicted and actual results. In addition, the suitability of each distribution was investigated using R2, adjusted R2, and predicted R2 to evaluate the adequacy of the modeled and experimental data.Abbreviations
| Af | Pulsation intensity [m s−1] |
| ANOVA | Analysis of the variance |
| CCD | Central composite design |
| d | Drop diameter, m |
| d32 | Sauter mean drop diameter [m] |
| dH | Major axes of the drop [m] |
| dL | Minor axes of the drop [m] |
| g | Acceleration due to gravity [m s−2] |
| h | Plate spacing [m] |
| H | Column length [m] |
| ni | Number of drops of mean diameter di (—) |
| Qc | Volumetric flow rate of continuous phase [L h−1] |
| Qd | Volumetric flow rate of dispersed phase [L h−1] |
| RSM | Response surface methodology |
| SS | Sum of squares |
| Vc | Continuous phase velocity [m s−1] |
| Vd | Dispersed phase velocity [m s−1] |
Greek symbols
| μ | Viscosity [N s m−2] |
| ρ | Density [kg m−3] |
| Δρ | Density difference between two phases [kg m−3] |
| α | Constant parameter of probability of density function |
| σ | Interfacial tension between two phases [N m−1] |
Subscript
| c | Continuous phase |
| d | Dispersed phase |
Conflicts of interest
There are no conflicts to declare.References
- S. Khooshechin, A. Moosavian, J. Safdari and M. M. H. Mallah, RSC Adv., 2017, 7(87), 55326–55335, 10.1039/c7ra07999k.
- S. Saha, R. Mistri and B. C. Ray, J. Chromatogr., 2009, 1216(15), 3059–3063, DOI:10.1016/j.chroma.2009.01.069.
- S. B. Kharade, R. K. Chougale, U. B. Baracheb, K. R. Sanadi, K. C. Rathod, Sh. H. Gaikwad, Y. Ch. Ling, M. A. Anuse and G. S. Kamble, Spectrochim. Acta, Part A, 2022, 267, 120502, DOI:10.1016/j.saa.2021.120502.
- G. S. Kamble, S. S. Joshi, A. N. Kokare, S. B. Zanje, S. S. Kolekar, A. V. Ghule, Sh. H. Gaikwad and M. A. Anuse, Sep. Sci. Technol., 2017, 52(14), 2238–3351, DOI:10.1080/01496395.2016.1255229.
- B. T. Khogare, G. S. Kamble, A. N. Kokare, S. B. Zanje, V. J. Suryavanshi, M. A. Anuse, P. B. Piste and B. N. Kokare, J. Environ. Chem. Eng., 2016, 4(3), 3075–3083, DOI:10.1016/j.jece.2016.06.001.
- M. Hosseinzadeh, A. Ghaemi and M. Shirvani, Sep. Purif. Technol., 2018, 201, 205–2013, DOI:10.1016/j.seppur.2018.03.020.
- L. E. Noronha, G. S. Kamble, S. S. Kolekar and M. A. Anuse, Indian J. Chem. Technol., 2013, 20(4), 252–258 CAS.
- G. S. Kamble, A. A. Ghare, S. S. Kolekar, S. H. Han and M. A. Anuse, Spectrochim. Acta, Part A, 2011, 84(1), 117–124, DOI:10.1016/j.saa.2011.09.015.
- G. S. Kamble, A. P. Gaikwad, B. N. Kokare, S. S. Kolekar, S. H. Han and M. A. Anuse, Ind. Eng. Chem. Res., 2011, 50(19), 11270–11279, DOI:10.1021/ie200812w.
- G. S. Kamble, S. S. Kolekar, S. H. Han and M. A. Anuse, Talanta, 2010, 81(3), 1088–1095, DOI:10.1016/j.talanta.2010.02.002.
- B. N. Kokare, G. S. Kamble, K. R. Sanadi, R. S. Kamble and M. A. Anuse, Mater. Focus, 2018, 7(1), 83–88, DOI:10.1166/mat.2018.1480.
- P. Amani, J. Safdari, M. Esmaieli and M. H. Mallah, Sep. Sci. Technol., 2017, 52(17), 2742–2755, DOI:10.1080/01496395.2017.1374974.
- A. Hemmati, M. Torab-Mostaedi and M. Asadollahzadeh, Chem. Eng. Res. Des., 2014, 93, 747–754, DOI:10.1016/j.cherd.2014.07.011.
- Y. A. Ibrahim, A. F. F. Asfour, M. H. Abdel-Megid and A. A. Zatout, Sep. Sci. Technol., 1994, 29(3), 415–427, DOI:10.1080/01496399408002492.
- S. Y. Khawaja, M. R. Usman, S. Khan, W. Afzal and N. A. Akhtar, Sep. Sci. Technol., 2013, 48(1), 175–182, DOI:10.1080/01496395.2012.681334.
- B. Tan, M. Lan, L. Li, Y. Wang and T. Qi, AIChE J., 2020, 66(8), e16279 CrossRef CAS.
- V. Sinha and T. Vincent, Sep. Sci. Technol., 2020, 1–25, DOI:10.1080/01496395.2020.1847146.
- A. Hemmati and A. Ghaemi, Heat Mass Transfer, 2021, 1395–1410 CrossRef CAS.
- X. Yu, H. Zhou, Q. Zheng, Sh. Jing, W. Lan and Sh. Li, Solvent Extr. Ion Exch., 2020, 38(5), 522–535, DOI:10.1080/07366299.2020.1765507.
- D. M. Ruthven, Encyclopedia of Separation Technology, Wiley, 1997 Search PubMed.
- W. Stanley, and E. Walas, Chemical Process Equipment-Selection and Design, Butterman-Heinemam Series, 1990 Search PubMed.
- W. J. D. Van Dijck, U.S. Pat., 2 011 186, 1935 Search PubMed.
- M. L. F. Gameiro, R. M. Machado, M. R. C. Ismael, M. T. A. Reis and J. M. Carvalho, J. Hazard. Mater., 2010, 183(1–3), 165–175, DOI:10.1016/j.jhazmat.2010.07.006.
- S. Mohanty, Rev. Chem. Eng., 2000, 16(3), 199–248, DOI:10.1515/REVCE.2000.16.3.199.
- L. Smoot, B. Mar and A. Babb, Ind. Eng. Chem., 1959, 51(9), 1005–1010, DOI:10.1021/ie51396a030.
- H. Schmidt, Sep. Purif. Technol., 1983, 18(14–15), 1595–1616, DOI:10.1080/01496398308056117.
- M. Slater and J. Godfrey, Liquid-Liquid Extraction Equipment, Wiley, UK, 1994 Search PubMed.
- R. L. Yadav and A. W. Patwardhan, Chem. Eng. J., 2008, 138(1–3), 389–415, DOI:10.1016/j.cej.2007.06.015.
- A. A. Hussain, T. B. Liang and M. J. Slater, Chem. Eng. Res. Des., 1988, 66, 541–554 CAS.
- D. Logsdail and J. Thornton, Chem. Eng. Trans., 1957, 35, 331–342 Search PubMed.
- A. J. Melnyk, S. Vijayan and D. R. Woods, Can. J. Chem. Eng., 1992, 70(3), 417–425, DOI:10.1002/cjce.5450700302.
- J. Prochazka and M. M. Hafez, Collect. Czech. Chem. Commun., 1972, 37, 3725–3734, DOI:10.1135/cccc19723725.
- V. M. Vdovenko and S. M. Kulikov, Radiokhimiya, 1966, 8(5), 525–533 CAS.
- E. Mohammadi, J. Towfighi, J. Safdari and M. H. Mallah, Int. J. Ind. Chem., 2019, 10(1), 1–15, DOI:10.1007/s40090-018-0167-y.
- S. Akhgar, J. Safdari, J. Towfighi and P. Amani, RSC Adv., 2017, 7(4), 2288–2300, 10.1039/C6RA26396H.
- V. Rafiei, J. Safdari, S. Moradi and M. H. Mallah, Sep. Sci. Technol., 2018, 53(17), 2756–2768, DOI:10.1080/01496395.2018.1472613.
- P. Amani, M. Amani and R. Hasanvandian, Korean J. Chem. Eng., 2017, 34(5), 1456–1465, DOI:10.1007/s11814-017-0042-0.
- P. Amani, J. Safdari, A. Gharib, H. Badakhshan and M. H. Mallah, Prog. Nucl. Energy, 2017, 98, 71–84, DOI:10.1016/j.pnucene.2017.02.010.
- H. Yi, Y. Wang, K. H. Smith, W. Y. Fei and G. W. Stevens, Ind. Eng. Chem., 2017, 56(4), 999–1007, DOI:10.1021/acs.iecr.6b03324.
- M. Khajenoori, A. Haghighi-Asl, J. Safdari and M. H. Mallah, Chem. Eng. Process., 2015, 92, 25–32, DOI:10.1016/j.cep.2015.03.021.
- F. Khanramaki, R. Torkaman, A. S. Shirani and J. Safdari, Iran. J. Chem. Chem. Eng., 2020, 39(5), 293–305 CAS.
- S. L. Mirmohammadi, M. H. Mallah, R. Torkaman and J. Safdari, Prog. Nucl. Energy, 2019, 117, 103082, DOI:10.1016/j.pnucene.2019.103082.
- F. Panahinia, M. Ghannadi-Maragheh, J. Safdari, P. Amani and M. H. Mallah, RSC Adv., 2017, 7(15), 8908–8921, 10.1039/C6RA27723C.
- T. Miyauchi and H. Oya, AIChE J., 1965, 11(3), 395–402, DOI:10.1002/aic.690110307.
- T. Míšek, Collect. Czech. Chem. Commun., 1964, 29(9), 1755–1766, DOI:10.1135/cccc19641755.
- E. Moreira, L. M. Pimenta, L. L. Carneiro, R. C. L. Faria, M. B. Mansur and C. P. Ribeiro, Chem. Eng. Commun., 2005, 192(8), 1017–1035, DOI:10.1080/009864490522542.
- A. Kumar and S. Hartland, Ind. Eng. Chem., 1996, 35(8), 2682–2695, DOI:10.1021/ie950674w.
- A. Kumar and S. Hartland, Empirical prediction of operating variables in Handbook of Solvent Extraction, ed. T. C. Lo, M. H. I. Baird and C. Hanson, John Wiley and Sons, New York, 1994, pp. 625–735 Search PubMed.
- S. Kagan, B. Veisbein, V. G. Trukhano and L. A. Muzychen, Int. J. Chem. Eng., 1973, 13, 217–220 Search PubMed.
- K. Sreenivasulu, D. Venkatanarasaiah and Y. B. G. Varma, Bioprocess Eng., 1997, 17(3), 189–195, DOI:10.1007/s004490050374.
- M. G. Samani, J. Safdari, A. H. Asl and M. Torab-Mostaedi, Chem. Eng. Technol., 2014, 37(7), 1155–1162, DOI:10.1002/ceat.201300837.
- R. Eyvazkhani, H. Bahmanyar, S. M. Mirdehghan Ashkezari and I. Najafipour, Chem. Eng. Commun., 2021, 208(7), 993–1004, DOI:10.1080/00986445.2020.1734577.
- E. Jafari Ozumchelouei, H. Bahmanyar and S. Mansoori, Sep. Sci. Technol., 2019, 54(15), 2440–2449, DOI:10.1080/01496395.2018.1549570.
- V. Sinha, D. Datta and T. Vincenta, Braz. J. Chem. Eng., 2020, 37(1), 271–281, DOI:10.1007/s43153-020-00022-0.
- R. Torkaman, M. Asadollahzadeh and M. Torab-Mostaedi, Sep. Purif. Technol., 2017, 197, 302–313, DOI:10.1016/j.seppur.2017.12.035.
- P. Sahoo and T. Barman, Mechatronics and Manufacturing Engineering, 2012, 159–226, DOI:10.1533/9780857095893.159.
- A. Asghar, A. A. Abdul Raman and W. M. A. W. Wan, Sci. World J., 2014, 1–14, DOI:10.1155/2014/869120.
- F. Ardestani, A. Ghaemi, J. Safdari and A. Hemmati, Prog. Nucl. Energy, 2021, 139, 103885, DOI:10.1016/j.pnucene.2021.103885.
- J. Sauter, Die Grössenbestimmung der in Gemischnebeln von Verbrennungskraftmaschinen vorhandenen BrennstoffteilchenVDI-Verlag G.M.B.H, Berlin SW 19, Heft 279 (in German), 1926 Search PubMed.
- D. Wang and L. S. Fan, in Fluidized bed technologies for near-zero emission combustion and gasification, ed. F. Scala, 2013, pp. 42–76, DOI:10.1533/9780857098801.1.42.
- P. B. Kowalczuk and J. Drzymala, Part. Sci. Technol., 2016, 34(6), 645–647, DOI:10.1080/02726351.2015.1099582.
- F. Ardestani, M. Haji Hosseini, M. Taghizadeh, M. R. Pourjavid and M. Rezaee, J. Braz. Chem. Soc., 2016, 27(7), 1279–1289, DOI:10.5935/0103-5053.20160026.
- M. Mourabet, A. El Rhilassi, H. El Boujaady, M. Bennani-Ziatni and A. Taitai, Arabian J. Chem., 2017, 10, S3292–S3302, DOI:10.1016/j.arabjc.2013.12.028.
- H. Pashaei, A. Ghaemi, M. Nasiri and B. Karami, ACS Omega, 2020, 5(15), 8432–8448, DOI:10.1021/acsomega.9b03363.
- R. F. Teófilo and M. Ferreira, Quim. Nova, 2006, 29(2), 338–350, DOI:10.1590/S0100-40422006000200026.
- D. Baş and I. H. Boyacı, J. Food Eng., 2007, 78(3), 836–845, DOI:10.1016/j.jfoodeng.2005.11.024.
- T. Ölmez, J. Hazard. Mater., 2009, 162(2–3), 1371–1378, DOI:10.1016/j.jhazmat.2008.06.017.
| This journal is © The Royal Society of Chemistry 2022 |