 Open Access Article
High-performance quasi-solid-state flexible supercapacitors based on a flower-like NiCo metal–organic framework†
Yongquan Du‡
a,
Ruibin Liang‡a,
Junxi Wua,
Yingyi Yea,
Shaoyong Chena,
Jian Yuan a,
Jianwen Chen
 c and
Peng Xiao
 *ab
*ab
aSchool of Physics and Optoelectronic Engineering, Foshan University, Foshan 528000, China. E-mail: xiaopeng@fosu.edu.cn
bGuangdong–Hong Kong–Macao Joint Laboratory for Intelligent Micro–Nano Optoelectronic Technology, Foshan 528000, China
cSchool of Electronic and Information Engineering, Foshan University, Foshan 528000, China
First published on 16th February 2022
Abstract
NiCo metal–organic framework (MOF) electrodes were prepared by a simple hydrothermal method. The flower-like NiCo MOF electrode exhibited an exciting potential window of 1.2 V and an excellent specific capacitance of 927.1 F g−1 at 1 A g−1. The flower-like NiCo MOF//activated carbon (AC) device delivered a high energy density of 28.5 W hkg−1 at a power density of 400.5 W kg−1 and good cycle stability (95.4% after 5000 cycles at 10 A g−1). Based on the flower-like NiCo MOF electrode, the asymmetric quasi-solid-state flexible supercapacitor (AFSC) was prepared and exhibited good capacitance retention after bending (79% after 100 bends and 64.4% after 200 bends). Furthermore, two AFSCs in series successfully lit up ten parallel red LED lights, showing great application potential in flexible and wearable energy storage devices.
1. Introduction
As the energy crisis continues to intensify, green and efficient energy storage devices have attracted more and more attention. Among many energy devices, supercapacitors have become the subject of much attention due to the advantages of high power density, fast charge and discharge, and long cycle life.1,2 As the key part of supercapacitors, electrode materials play an important role in the performance of supercapacitors.3,4 The electrode materials can be divided into two types: carbon materials and pseudocapacitive materials.5,6 Carbon materials only involve physical adsorption and desorption during the charging and discharging process, which is helpful for high stability and long cycle life.7,8 For pseudocapacitive materials, reversible redox reactions will happen during the charging and discharging process, which is helpful for high specific capacitance.9,10 Increasing the specific surface area and pseudocapacitance are beneficial to improve the specific capacitance.11–13 The specific capacitance is one of the key factors affecting the energy density of supercapacitors.14,15 In addition, the assembly process of the supercapacitors also has a great impact on the energy density.16,17 Especially for flexible supercapacitors, high stable electrochemical performance needs to be ensured by good mechanical performance.18,19 Therefore, the assembly process of supercapacitors plays an important role in obtaining high energy density.Metal–organic frameworks (MOFs) are a new type of material composed of metal ions and organic ligands,20,21 which have the advantages of both redox sites and a large theoretical specific surface area (46![[thin space (1/6-em)]](https://www.rsc.org/images/entities/char_2009.gif) 000 m2 g−1).22 However, the most of MOFs with inherent low conductivity limit the application in supercapacitors.23–25 In order to improve conductivity of MOFs, the preparation of different structures and combinations of MOFs becomes one of the current research directions.26–28 Many studies have showed that MOFs with a unique structure exhibit a large specific surface area, reducing the diffusion distance of electrolyte ions, thus achieving an increase in conductivity.29,30 For example, NiCo MOF with polycrystalline structure prepared by Ye et al.31 exhibited a high specific capacity of 833 C g−1 at 0.5 A g−1 and maintained 714 C g−1 at 20 A g−1. The uniform substitution of Co2+ for Ni2+ in MOFs increased the free holes, resulting in good conductivity and polycrystalline structure buffered the volume change during charge–discharge process, resulting in excellent capacitance retention rate. The accordion-like Ni MOF had specific surface area of 117.42 m2 g−1 and average pore size of 5 nm, which was conducive to enhancing the diffusion of ions and electrolytes and improved electrochemical performance.32 Xu et al.33 used a room temperature solution phase method to synthesize low-crystalline Ni/Co MOF with extraordinary charge storage capabilities. This can be attributed to its disordered structure and small nanosheet feature size (<100 nm) to increase the specific surface area. Significantly, the structure and size of nanosheet are very important for improving conductivity of MOFs. This is because the special nanosheet structure can reduces the ion diffusion distance and increases the specific surface area by reducing the size of the material particles to the nanoscale.32,34,35 Therefore, it is very necessary to study to control the size and structure of the nanosheets of MOFs.
000 m2 g−1).22 However, the most of MOFs with inherent low conductivity limit the application in supercapacitors.23–25 In order to improve conductivity of MOFs, the preparation of different structures and combinations of MOFs becomes one of the current research directions.26–28 Many studies have showed that MOFs with a unique structure exhibit a large specific surface area, reducing the diffusion distance of electrolyte ions, thus achieving an increase in conductivity.29,30 For example, NiCo MOF with polycrystalline structure prepared by Ye et al.31 exhibited a high specific capacity of 833 C g−1 at 0.5 A g−1 and maintained 714 C g−1 at 20 A g−1. The uniform substitution of Co2+ for Ni2+ in MOFs increased the free holes, resulting in good conductivity and polycrystalline structure buffered the volume change during charge–discharge process, resulting in excellent capacitance retention rate. The accordion-like Ni MOF had specific surface area of 117.42 m2 g−1 and average pore size of 5 nm, which was conducive to enhancing the diffusion of ions and electrolytes and improved electrochemical performance.32 Xu et al.33 used a room temperature solution phase method to synthesize low-crystalline Ni/Co MOF with extraordinary charge storage capabilities. This can be attributed to its disordered structure and small nanosheet feature size (<100 nm) to increase the specific surface area. Significantly, the structure and size of nanosheet are very important for improving conductivity of MOFs. This is because the special nanosheet structure can reduces the ion diffusion distance and increases the specific surface area by reducing the size of the material particles to the nanoscale.32,34,35 Therefore, it is very necessary to study to control the size and structure of the nanosheets of MOFs.
Herein, we used a simple hydrothermal method to synthesize NiCo MOF-x (x = 0, 2, 4), where x represented the volume of 0.8 M NaOH. In particular, NiCo MOF-2 exhibited a large potential window of 1.2 V and a specific capacitance of 927.1 F g−1 at 1 A g−1. With NiCo MOF-2 as the positive electrode and activated carbon (AC) as the negative electrode, the assembled aqueous device delivered a superior energy density of 28.5 W h kg−1 at a power density of 400.5 W kg−1 and amazing cycle stability (95.4% capacitance retention after 5000 cycles). Furthermore, the asymmetric flexible quasi-solid-state supercapacitor (AFSC) was assembled and demonstrated the energy density of 20.4 W h kg−1 at the power density of 901.5 W kg−1. Finally, two AFSCs in series successfully lit up ten parallel red LED lights and exhibited surprising capacitance retention rate after bending (79% after 100 bends and 64.4% after 200 bends), showing the huge potential in flexible electronics.
2. Experiment section
2.1 Chemicals
Cobalt chloride hexahydrate (MW = 237.93, CoCl2·6H2O), nickel chloride hexahydrate (MW = 237.7, NiCl2·6H2O), polyvinyl alcohol (PVA, MW = 44), dimethylformamide (DMF, MW = 73.09, HCON(CH3)2) and activated carbon (AC) were purchased from Macklin. Terephthalic acid (PTA, MW = 166.13, C8H6O4), sodium hydroxide (MW = 40.01, NaOH) were purchased from Jiuding Chemical. NaOH solution was prepared with deionized water, and other solutions were prepared with DMF.2.2 Preparation of NiCo MOF samples
NiCo MOF samples were prepared by a simple hydrothermal method. Firstly, 30 mL of DMF was added to a 100 mL beaker, and then 0.332 g of PTA was added and sonicated for 30 min. Secondly, 0.156 g NiCl2·6H2O and 0.157 g CoCl2·6H2O were added, and stirred at room temperature for 30 min. During the stirring process, the NaOH solution was added and ultrasonicated for 30 min. Then, the mixed solution was poured into a 100 mL high-temperature reaction kettle at 100 °C for 10 h. NiCo MOF samples were washed with DMF and alcohol for two times after cooling down naturally. Finally, NiCo MOF samples were put into a vacuum box and dried at 60 °C for 12 h. The addition of 0.8 M NaOH solution was 0 mL, 2 mL and 4 mL and they were represented by NiCo MOF-x (x = 0, 2, 4).2.3 Preparation of NiCo MOF-x electrode and AC electrode
NiCo MOF-x electrode were prepared by slurry coating technology. Firstly, NiCo MOF-x powder, acetylene black and polyvinylidene fluoride (PVDF) with a weight ratio of 8![[thin space (1/6-em)]](https://www.rsc.org/images/entities/char_2009.gif) :
:![[thin space (1/6-em)]](https://www.rsc.org/images/entities/char_2009.gif) 1
1![[thin space (1/6-em)]](https://www.rsc.org/images/entities/char_2009.gif) :
:![[thin space (1/6-em)]](https://www.rsc.org/images/entities/char_2009.gif) 1 were formed a suspension in DMF solvent. Then, the slurries were coated on Ni foam with an area of 1 × 1 cm2. Finally, two pieces of Ni foam with slurry in the middle were pressed under a pressure of 8 MPa. The weight loading of NiCo MOF-x on the Ni foam was about 4 mg.
1 were formed a suspension in DMF solvent. Then, the slurries were coated on Ni foam with an area of 1 × 1 cm2. Finally, two pieces of Ni foam with slurry in the middle were pressed under a pressure of 8 MPa. The weight loading of NiCo MOF-x on the Ni foam was about 4 mg.
The preparation process of AC electrode was the same as NiCo MOF-x electrode.
2.4 Preparation of KOH/PVA gel electrolyte
Firstly, 3 g PVA was added to 30 mL deionized water. Then the solution was stirred at 85 °C until clear. After that, 10 mL 3 M KOH solution was added to the above solution, stirring evenly to obtain KOH/PVA gel electrolyte.2.5 Preparation of asymmetric supercapacitor
2.6 Characterization
X-ray diffraction (XRD, Smartlab 9 kW) patterns of NiCo MOF samples are obtained in the Bragg's angle (2θ) range from 10° to 50° with monochromatic Cu Kα radiation. X-ray photoelectron spectroscopy (XPS, Nexsa) measurements are performed to analyze the surface species and their chemical states. A field emission scanning electron microscopy (FE-SEM, HITACHI SU8200) combined with energy dispersive X-ray spectroscopy (EDS) are used to analyze the morphology and element distribution of samples. The specific surface area of samples are investigated by the Brunauer–Emmett–Teller (BET) method (ASAP2020).2.7 Electrochemical measurement
The electrochemical performance test is carried out in the three-electrode system of the electrochemical workstation (CompactStat.h). The prepared electrode, platinum electrode and saturated calomel electrode are used as working electrode, auxiliary electrode and reference electrode, respectively. In 3 M KOH aqueous solution, cyclic voltammetry (CV), constant current charge and discharge (GCD) and electrochemical impedance spectroscopy (EIS) measurements are performed at room temperature, and the potential window of CV and GCD is −0.4–0.8 V and 0–0.45 V, respectively. The specific capactance is generally calculated by the eqn (1).36
 | (1) |
The preparation of supercapacitors firstly needs to ensure that the charges of the positive electrode and negative electrode are equal (Q+ = Q−). The optimal mass ratio between the positive electrode and negative electrode is obtained according to eqn (2) and (3).11,12
| Q = C × m × ΔV | (2) |
 | (3) |
The specific capacitance, energy density and power density of supercapacitors are generally calculated through the eqn (4)–(6).13,14,19,20
 | (4) |
 | (5) |
 | (6) |
3. Results and discussion
Fig. 1 is the preparation process of NiCo MOF-2 with a flower-like structure. First, Ni2+/Co2+ with mole ration of 1![[thin space (1/6-em)]](https://www.rsc.org/images/entities/char_2009.gif) :
:![[thin space (1/6-em)]](https://www.rsc.org/images/entities/char_2009.gif) 1 and 1 mM PTA were added to the DMF solution, sonicating for 30 min. Then 2 mL (0.8 M) NaOH solutions were added to the DMF solution, and stirred for 30 min. After that, the obtained blue mixed solution was put into a 100 mL reaction vessel and reacted at 100 °C for 10 hours. At last, the flower-like NiCo MOF-2 was obtained.
1 and 1 mM PTA were added to the DMF solution, sonicating for 30 min. Then 2 mL (0.8 M) NaOH solutions were added to the DMF solution, and stirred for 30 min. After that, the obtained blue mixed solution was put into a 100 mL reaction vessel and reacted at 100 °C for 10 hours. At last, the flower-like NiCo MOF-2 was obtained.
Fig. 2(a) is the XRD patterns of NiCo MOF samples obtained from different addition of NaOH. The similar XRD patterns of NiCo MOF-2 and NiCo MOF-4 indicated the addition of NaOH only changed the morphology, which had not caused a change in crystallinity. It could be seen that all the peaks of the NiCo MOF samples were well indexed to C8H6NiO5·H2O (PDF # 35-1677). This could be explained interpreted that Co2+ partially replaced Ni2+ in the metal–organic framework, retaining the crystal structure of C8H6NiO5·H2O.25,29,30
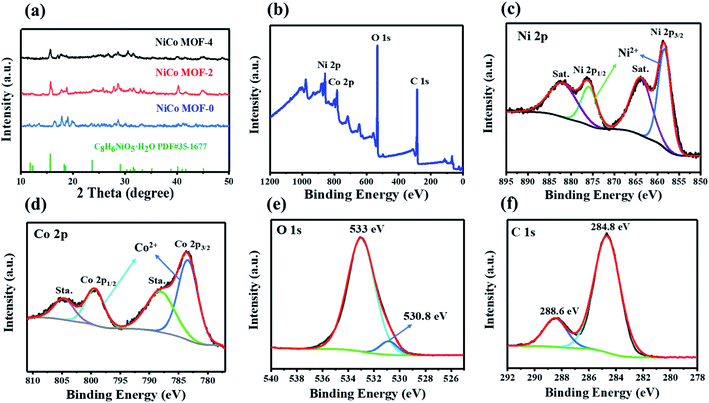 | ||
| Fig. 2 (a) XRD patterns of NiCo MOF-0, NiCo MOF-2 and NiCo MOF-4. (b) XPS spectra of NiCo MOF-2. High-resolution of XPS spectra for Ni 2p (c), Co 2p (d), O 1s (e) and C 1s (f). | ||
Fig. 2(b) is the XPS survey spectrum of NiCo MOF-2, including four elements of Ni, Co, O, and C. As shown in Fig. 2(c), the satellite peaks of Ni 2p3/2 and Ni 2p1/2 were located at 863.7 and 882.3 eV, respectively, and the main peaks of Ni 2p3/2 and Ni 2p1/2 were 858.4 and 876.1 eV, with a spin-energy separation of 17.7 eV. The above results indicated that the Ni element in NiCo MOF-2 existed in the form of Ni2+.37,38 As shown in Fig. 2(d), the satellite peaks of Co 2p3/2 and Co 2p1/2 were located at 788.1 eV and 804.6 eV, respectively, and the main peaks of Co 2p3/2 and Co 2p1/2 were 783.5 eV and 799.3 eV, with a spin–energy separation of 15.8 eV, indicating that the Co element in NiCo MOF-2 existed in the form of Co2+.33,39 As shown in Fig. 2(e), the O 1s spectrum was deconvoluted into two peaks at 530.8 and 533 eV, which were associated with the C–O and metal–oxygen bonds M–O–M, respectively.25,33 The C 1s spectrum (Fig. 2(f)) showed two peaks at 288.6 and 284.8 eV, which were associated with the O–C![[double bond, length as m-dash]](https://www.rsc.org/images/entities/char_e001.gif) O, C–C bonds of terephthalate, respectively.31,37 The XPS results further confirmed the presence of nickel–cobalt terephthalate framework in the NiCo MOF-2.32,37
O, C–C bonds of terephthalate, respectively.31,37 The XPS results further confirmed the presence of nickel–cobalt terephthalate framework in the NiCo MOF-2.32,37
Fig. 3(a–d) show the SEM images of NiCo MOF samples. With the addition of NaOH, both NiCo MOF-2 and NiCo MOF-4 were formed by numerous nanosheets with good crystallinity. This could be explained that the NaOH affected the formation of nanosheets. In addition, NiCo MOF-2 and NiCo MOF-4 exhibited flower-like and layered structures, respectively, and we speculated that different alkaline conditions may affect the stacking pattern of nanosheets (shown in Fig. S1†). Various levels of stress and defects may play an important role in this morphology change.33,35 The layered structure of NiCo MOF-4 was similar to the reported Ni MOF.32 The formation mechanism of the flower-like NiCo MOF-2 was still unclear, and further experimental and theoretical researches were needed. Fig. 3(e) is elemental mapping of NiCo MOF-2. The three elements of C, Co and Ni were well distributed in NiCo MOF-2, which also proved that Co2+ certain partially replaced Ni2+ in the metal–organic framework.
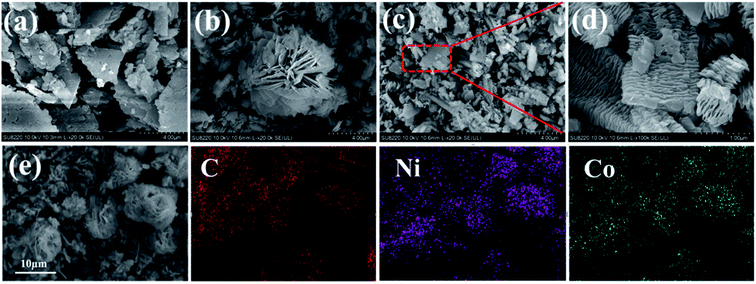 | ||
| Fig. 3 SEM images of (a) NiCo MOF-0, (b) NiCo MOF-2, (c and d) NiCo MOF-4, (e) elemental mapping of NiCo MOF-2. | ||
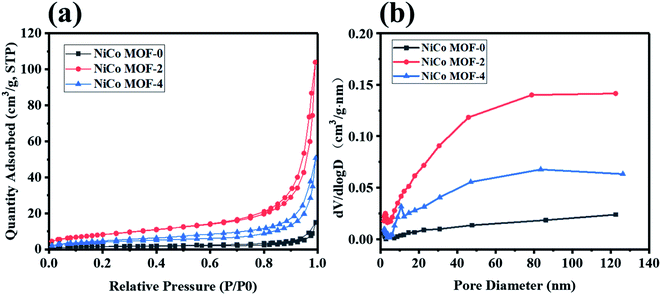
In Fig. 4(a and b) and Table 1, the specific surface area and pore size of NiCo MOF samples are characterized by BET measurement. The specific surface area of NiCo MOF-0, NiCo MOF-2 and NiCo MOF-4 were 5.83, 30.47 and 14.69 m2 g−1, respectively. According to the Barrett–Joyner–Halenda (BJH) method, the average pore size of NiCo MOF-0, NiCo MOF-2 and NiCo MOF-4 were 26.55, 20, 23.89 nm, respectively. Obviously, the NiCo MOF-2 had the highest specific surface area. High specific surface area and stable pore size are beneficial to increase the number of redox sites and enhance ion transport efficiency in electrochemical reactions.23,38,39
| Samples | Specific surface area (m2 g−1) | Average pore size (nm) |
|---|---|---|
| NiCo MOF-0 | 5.83 | 26.55 |
| NiCo MOF-2 | 30.47 | 20 |
| NiCo MOF-4 | 14.69 | 23.89 |
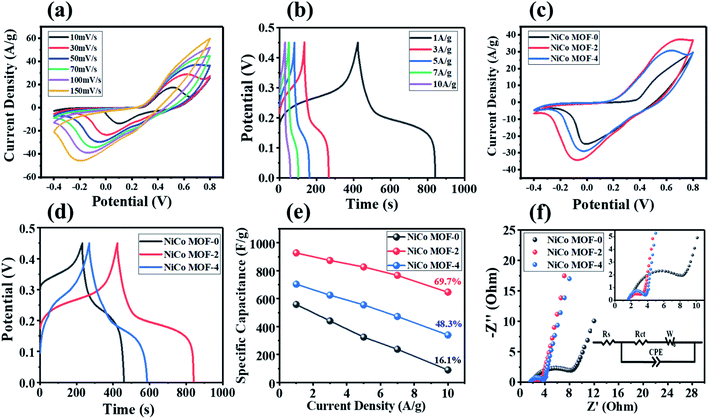
In order to evaluate the electrochemical performance of NiCo MOFs, we conducted electrochemical tests in 3 M KOH aqueous electrolyte (shown in Fig. S2†). As shown in Fig. 5(a), the CV curves of NiCo MOF-2 were tested at different scan rates in the potential window of 1.2 V. NiCo MOF-2 had obvious redox peaks and exhibited good pseudo-capacitance behavior at the scan rate from 10 mV s−1 to 150 mV s−1. This could be ascribed to the faradaic reaction between Ni2+/Ni3+, Co2+/Co3+ and OH−.40 With the increase of the scanning rate, the shape of the CV curve of NiCo MOF-2 remained basically unchanged, showing good magnification performance.27 What's more, the positions of the oxidation peak and the reduction peak moved slightly to the positive and negative potential, which was mainly related to the internal resistance of the electrode materials.41
In Fig. 5(b), the specific capacitance of NiCo MOF-2 was 927.1, 873.3, 820.8, 769.5, 646.6 F g−1 at current densities of 1, 3, 5, 7 and 10 A g−1. As shown in Table 2, the specific capacitance of NiCo MOF-2 in our work was higher than that reported in most of literature. In Fig. 5(c and d), NiCo MOF-2 had the longest discharge time and exhibited the largest specific capacitance. The flat charge–discharge potential plateau in Fig. 5(d) corresponding to the sharp redox peak in Fig. 5(c) further demonstrated the battery electrode characteristics of these NiCo MOF samples.37 Fig. 5(e) summarized the capacitance retention rate of three NiCo MOF samples at different current densities. When the current density reached at 10 A g−1, the capacitance retention rate of NiCo MOF-2, NiCo MOF-4 and NiCo MOF-0 were 69.7%, 48.3% and 16.1%, respectively. The high specific capacitance of NiCo MOF-2 electrode could be ascribed to the following reasons: (i) the good crystal phase of NiCo MOF-2 provides a high density of active sites to achieve large capacitance.32,42 (ii) The ultrafine nanostructure further presents large specific surface area, which is conducive to the short ion diffusion path of the rapid redox reaction.33,43
| Electrode materials | Electrolyte | Current density | Specific capacitance | Ref. |
|---|---|---|---|---|
| Fe-based MOF/GA | 1 M TEA-BF4/PC | 20 A g−1 | 353 F g−1 | 26 |
| Accordion-like Ni-MOF | 3 M KOH | 1.4 A g−1 | 988 F g−1 | 32 |
| NiCo-MOF/AB | 2 M KOH | 0.5 A g−1 | 916.1 F g−1 | 37 |
| Ni–CoP@C@CNT | 3 M KOH | 1 A g−1 | 708.1 F g−1 | 49 |
| Co-MOF/D | 3 M KOH | 2 A g−1 | 393.4 F g−1 | 51 |
| Co-MOF/E | 3 M KOH | 2 A g−1 | 654.4 F g−1 | 51 |
| Co-MOF/W | 3 M KOH | 2 A g−1 | 626.9 F g−1 | 51 |
| Ni-MOF | 2 M KOH | 1 A g−1 | 726 F g−1 | 54 |
| MWCNTs@Ni-MOF | 2 M KOH | 2 A g−1 | 890 F g−1 | 55 |
| Pillar Ni-MOF | 2 M KOH | 1 A g−1 | 552 F g−1 | 56 |
| Flower-like NiCo MOF | 3 M KOH | 1 A g−1 | 927.1 F g−1 | This work |
In Fig. 5(f), the intercept on the real axis and diameter of the semicircle of the EIS diagram represent the equivalent series resistance (Rs) and charge transfer resistance (Rct) of the electrode, respectively.22,28,31 According to fitting equivalent circuit analysis, the Rs of the NiCo MOF-0, NiCo MOF-2 and NiCo MOF-4 samples were 1.43, 1.61 and 1.75 Ω, respectively. The Rct of the NiCo MOF-0, NiCo MOF-2 and NiCo MOF-4 samples were 2.80, 1.41 and 1.70 Ω, respectively. The Rct of NiCo MOF-2 were the smallest, indicating that the efficiency of electron transfer was the highest. The slope of the straight line in the low frequency region represents the diffusion resistance of ions between the electrolyte and the electrode surface.28,35 It showed that the NiCo MOF-2 exhibited the smallest diffusion resistance. These results further proved that NiCo MOF-2 had the best electrochemical performance in the three NiCo MOF samples.
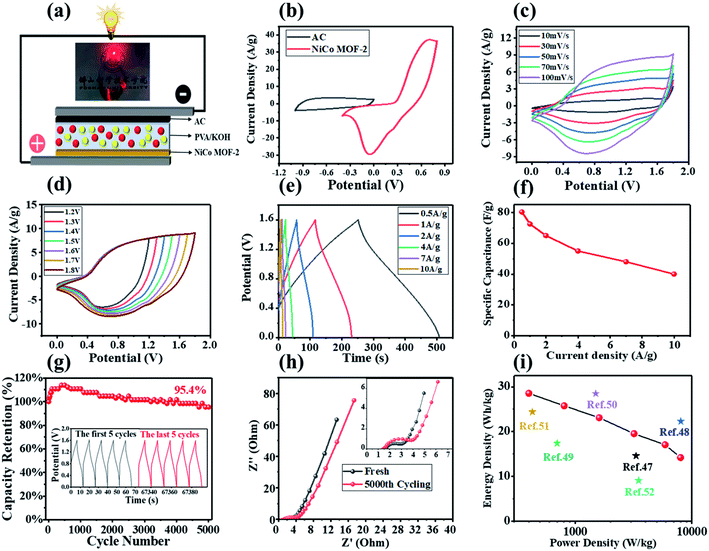
Considering the practical application of NiCo MOF-2 electrode material, we assembled an ASC device of NiCo MOF-2//AC, and successfully lit up a red LED light in Fig. 6(a). As shown in Fig. 6(b), the potential window of the NiCo MOF-2//AC hybrid device could be extended to 1.8 V, and the effective mass ratio of NiCo MOF-2 and AC was 1![[thin space (1/6-em)]](https://www.rsc.org/images/entities/char_2009.gif) :
:![[thin space (1/6-em)]](https://www.rsc.org/images/entities/char_2009.gif) 4 according to the eqn (3). The NiCo MOF-2//AC hybrid device was tested in a 3 M KOH aqueous electrolyte. The shape of the CV curves from 10 to 100 mV s−1 remained unchanging, showing good capacitance behavior in Fig. 6(c).20 In addition, the NiCo MOF-2//AC hybrid device showed typical hybrid capacitance behavior, which was derived from the pseudocapacitance of the NiCo MOF-2 electrode and the double-layer capacitance of the AC electrode, respectively.44 In the potential range from 1.2 to 1.8 V, CV curves were used to further study the potential window of the NiCo MOF-2//AC hybrid device at a scan rate of 100 mV s−1. As shown in Fig. 6(d), no polarization phenomenon was observed in the CV curve, indicating the satisfactory capacitive behave.45,46
4 according to the eqn (3). The NiCo MOF-2//AC hybrid device was tested in a 3 M KOH aqueous electrolyte. The shape of the CV curves from 10 to 100 mV s−1 remained unchanging, showing good capacitance behavior in Fig. 6(c).20 In addition, the NiCo MOF-2//AC hybrid device showed typical hybrid capacitance behavior, which was derived from the pseudocapacitance of the NiCo MOF-2 electrode and the double-layer capacitance of the AC electrode, respectively.44 In the potential range from 1.2 to 1.8 V, CV curves were used to further study the potential window of the NiCo MOF-2//AC hybrid device at a scan rate of 100 mV s−1. As shown in Fig. 6(d), no polarization phenomenon was observed in the CV curve, indicating the satisfactory capacitive behave.45,46
As shown in Fig. 6(e), the NiCo MOF-2//AC hybrid device had symmetric GCD curve at current densities of 0.5, 1, 2, 4, 7, 10 A g−1, indicating its good cycle stability.20 In Fig. 6(f), the specific capacitance of the NiCo MOF-2//AC hybrid device was 80.3 F g−1 at 0.5 A g−1, and 40 F g−1 was remained at 10 A g−1. The NiCo MOF-2//AC hybrid device had a capacitance retention rate of 95.4% after 5000 GCD tests (Fig. 6(g)). It was obvious that the specific capacitance first increased and then decreased during the GCD tests. The increase could be ascribed to the complete activation of the electrode and the decrease could be explained by the loss of electrode due to the continuous redox reaction in the GCD test.37,47 As shown in Fig. 6(h), the Rs changed from 1.53 Ω to 1.43 Ω, and Rct slightly increased after 5000 GCD tests, indicating that the NiCo MOF-2//AC hybrid device met the requirements of high-performance supercapacitors.48 As shown in Fig. 6(i), the maximum energy density of the NiCo MOF-2//AC hybrid device was 28.5 W h kg−1 at a power density of 400.5 W kg−1. Even at a power density of 7998.7 W kg−1, the energy density remained at 14.2 W h kg−1, which were advantageous over many previously reported ASCs, such as Ni–CoP@C@CNT//AC (17.4 W h kg−1 at 699.1 W kg−1),49 CoNi-MOF//AC (28.5 W h kg−1 at 1500 W kg−1),50 Co-MOF//AC (24.4 W h kg−1 at 429 W kg−1),51 MOF-derived hierarchical porous carbon film (9.1 W h kg−1 at 3500 W kg−1 ),52 NiCo-LDH/Zn2SnO4//AC (27.3 W h kg−1 at 248.3 W kg−1).53
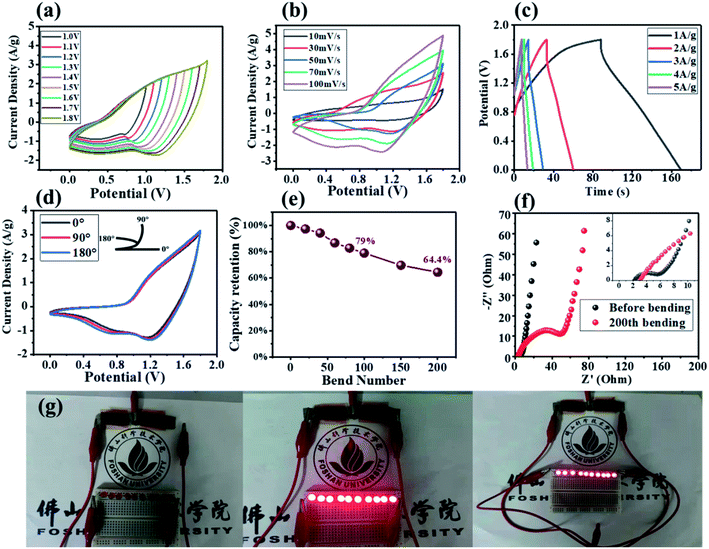
With the development of flexible electronic, flexible energy storage devices had attracted more and more attention, so we also assembled AFSCs and tested their electrochemical performance. As shown in Fig. 7(a), no polarization was observed in the CV curve from 1.0 to 1.8 V, showing the satisfactory capacitance behavior.54,55 In Fig. 7(b), the shape of the CV curve slightly changes at the scan rate from 10 to 100 mV s−1, and it exhibited a typical hybrid capacitance behavior.56 In Fig. 7(c), the AFSC had a maximum specific capacitance of 45.3 F g−1 at 1 A g−1, and its maximum energy density was 20.4 W h kg−1 at the power density is 901.5 W kg−1. In Fig. 7(d), the AFSC had almost no change in the shape of the CV curves bent at 90° and 180°, showing excellent electrochemical performance under different bending conditions.57,58 In order to further test the performance of the AFSC, we tested the capacitance retention of the AFSC after 200 repeated bends. As shown in Fig. 7(e), the retention rate of the AFSC was 79% after 100 repeated bending, showing a good capacitance retention rate. Besides, the capacitance retention remained 64.4% after 200 repeated bending, which could be attributed to the increase in electronic interface transfer resistance of the AFSC after repeated bending.18,59 In Fig. 7(f), the Rct after bending was much larger than the Rct before bending, indicating the ion diffusion resistance of the AFSC became larger after bending, which was consistent with the capacitance decrease after repeated bending.60 Furthermore, two series connected AFSCs lit up 10 parallel red LED lights. The above results illustrated that the AFSC had good electrochemical performance under bending and practical value.
4. Conclusion
In summary, we reported a facile hydrothermal method to synthesize flower-like NiCo MOF. The results of XRD and XPS indicated that there were a high crystallinity nickel and cobalt terephthalate framework in NiCo MOF-2. The SEM images showed that the concentration of NaOH had a great influence on the formation and stacking pattern of the nanosheets in NiCo MOF samples. Among NiCo MOF samples, NiCo MOF-2 exhibited extraordinary specific capacitance (927.1 F g−1 at 1 A g−1) and the specific capacitance retention reached 69.6% at the current density range of 1.0 to 10 A g−1. This may be attributed to the flower-like structure with a large specific surface area and great electrical conductivity, which was confirmed by BET measurement. With NiCo MOF-2 as the positive electrode and AC as the negative electrode, the NiCo MOF-2//AC hybrid device exhibited maximum energy density of 28.5 W h kg−1 at a power density of 400.5 W kg−1 and an excellent cyclic stability, which retained 95.4% of the capacitance after 5000 GCD cycles. Furthermore, the AFSC delivered an impressive energy density of 20.4 W h kg−1 at the power density of 901.5 W kg−1, and an excellent electrochemical performance under bending (79% after 100 bends and 64.4% after 200 bends). Finally, its energy storage ability for practical application had also been examined by successfully powering ten commercial red LED powerfully. These results indicated that the rapidly synthesized NiCo MOF had great potential as an electrode material for flexible supercapacitors.Conflicts of interest
There are no conflicts to declare.Acknowledgements
This work was supported by Research Fund of Guangdong–Hong Kong–Macao Joint Laboratory for Intelligent Micro–Nano Optoelectronic Technology (No. 2020B1212030010), Guangdong Provincial Key Laboratory of Semiconductor Micro Display (2020B121202003), Youth project of Guangdong Foshan joint fund of Guangdong Natural Science Foundation (Grant No. 2020A1515110601, 2019A1515110002).References
- M. Inagaki, H. Konno and O. Tanaike, J. Power Sources, 2010, 195, 7880–7903 CrossRef CAS.
- L. L. Zhang and X. S. Zhao, Chem. Soc. Rev., 2009, 38, 2520–2531 RSC.
- Z. Wang, Z. Zhu, J. Qiu and S. Yang, J. Mater. Chem. C, 2014, 2, 1331 RSC.
- U. M. Patil, K. V. Gurav, V. J. Fulari, C. D. Lokhande and O. S. Joo, J. Power Sources, 2009, 188, 338–342 CrossRef CAS.
- Y. Du, P. Xiao, J. Yuan and J. Chen, Coatings, 2020, 10, 892 CrossRef CAS.
- H. Zheng, T. Zhai, M. Yu, S. Xie, C. Liang, W. Zhao and X. Lu, J. Mater. Chem. C, 2013, 1, 225–229 RSC.
- P. Yang and W. Mai, Nano Energy, 2014, 8, 274–290 CrossRef CAS.
- Y. Shao, H. Wang, Q. Zhang and Y. Li, J. Mater. Chem. C, 2013, 1, 1245–1251 RSC.
- F. Saleki, A. Mohammadi, S. E. Moosavifard, A. Hafizi and M. R. Rahimpour, J. Colloid Interface Sci., 2019, 556, 83–91 CrossRef CAS PubMed.
- X. Zhang, X. Liu, R. Yan, J. Yang, Y. Liu and S. Dong, J. Mater. Chem. C, 2020, 8, 2008–2013 RSC.
- C. Zhu, T. Liu, F. Qian, T. Y. Han, E. B. Duoss, J. D. Kuntz and Y. Li, Nano Lett., 2016, 16, 3448–3456 CrossRef CAS PubMed.
- X. Shi, S. Zheng, Z. Wu and X. Bao, J. Energy Chem., 2018, 27, 25–42 CrossRef.
- C. C. Xiong, B. Li, X. Lin, H. Liu, Y. Xu, J. Mao, T. Li and Y. Ni, Composites, Part B, 2019, 165, 10–46 CrossRef CAS.
- T. Le, D. Aradilla, G. Bidan, F. Billon, M. Delaunay, J. M. Gérard and O. Sel, Electrochem. Commun., 2018, 93, 5–9 CrossRef CAS.
- Y. Ma, M. Wang, N. Kim, J. Suhr and H. Chae, J. Mater. Chem. A, 2015, 3, 21875–21881 RSC.
- C. Tan and H. Zhang, Chem. Soc. Rev., 2015, 44, 2713–2731 RSC.
- Y. Shao, J. Li, Y. Li, H. Wang, Q. Zhang and R. B. Kaner, Mater. Horiz., 2017, 4, 1145–1150 RSC.
- Y. Bai, R. Liu, E. Li, X. Li, Y. Liu and G. Yuan, J. Alloys Compd., 2019, 777, 524–530 CrossRef CAS.
- H. Jiang, T. Zhao, C. Li and J. Ma, J. Mater. Chem., 2011, 21, 3818–3823 RSC.
- Y. Peng, Y. Li, Y. Ban, H. Jin, W. Jiao, X. Liu and W. Yang, Science, 2014, 346, 1356–1359 CrossRef CAS PubMed.
- T. Rodenas, I. Luz, G. Prieto, B. Seoane, H. Miro, A. Corma and J. Gascon, Nat. Mater., 2015, 14, 48–55 CrossRef CAS PubMed.
- M. Eddaoudi, H. Li and O. M. Yaghi, J. Am. Chem. Soc., 2000, 122, 1391–1397 CrossRef CAS.
- M. Zhao, Y. Wang, Q. Ma, Y. Huang, X. Zhang, J. Ping, Z. Zhang, Q. Lu, Y. Yu, H. Xu, Y. Zhao and H. Zhang, Adv. Mater., 2015, 27, 7372–7378 CrossRef CAS PubMed.
- S. Zhao, Y. Wang, J. Dong, C. T. He, H. Yin, P. An and Z. Tang, Nat. Energy, 2016, 1, 1–10 Search PubMed.
- D. Zheng, H. Wen, X. Sun, X. Guan, J. Zhang, W. Tian, H. Feng, H. Wang and Y. Yao, Chem.–Eur. J., 2020, 26, 17149–17155 CrossRef CAS PubMed.
- L. Liu, Y. Yan, Z. Cai, S. Lin and X. Hu, Adv. Mater. Interfaces, 2015, 5, 1701548 CrossRef.
- Q. Wang, L. Shao, Z. Ma, J. Xu, Y. Li and C. Wang, Electrochim. Acta, 2018, 281, 582–593 CrossRef CAS.
- Y. Jiao, G. Chen, D. Chen, J. Pei and Y. Hu, J. Mater. Chem. A, 2017, 5, 23744–23752 RSC.
- Q. Wang, Q. Wang, B. Xu, F. Gao, F. Gao and C. Zhao, Electrochim. Acta, 2018, 281, 69–77 CrossRef CAS.
- L. Shao, Q. Wang, Z. Ma, Z. Ji, X. Wang, D. Song, Y. Liu and N. Wang, J. Power Sources, 2018, 379, 350–361 CrossRef CAS.
- C. Ye, Q. Qin, J. Liu, W. Mao, J. Yan, Y. Wang, J. Cui, Q. Zhang, L. Yang and Y. Wu, J. Mater. Chem. A, 2019, 7, 4998–5008 RSC.
- Y. Yan, P. Gu, S. Zheng, M. Zheng, H. Pang and H. Xue, J. Mater. Chem. A, 2016, 4, 19078–19085 RSC.
- F. Xu, N. Chen, Z. Fan and G. Du, Appl. Surf. Sci., 2020, 528, 146920 CrossRef CAS.
- X. Cao, Y. Shi, W. Shi, X. Rui, Q. Yan, J. Kong and H. Zhang, Small, 2013, 9, 3433–3438 CrossRef CAS PubMed.
- S. Sheng, W. Liu, K. Zhu, K. Cheng, K. Ye, G. Wang, D. Cao and J. Yan, J. Colloid Interface Sci., 2019, 536, 235–244 CrossRef CAS PubMed.
- Q. Zhang, Y. Wang, B. Zhang, K. Zhao, P. He and B. Huang, Carbon, 2018, 127, 449–458 CrossRef CAS.
- Y. Liu, Y. Wang, H. Wang, P. Zhao, H. Hou and L. Guo, Appl. Surf. Sci., 2019, 492, 455–463 CrossRef CAS.
- W. Zhao, Y. Zheng, L. Cui, D. Jia, D. Wei, R. Zheng, C. Barrow, W. Yang and J. Liu, Chem. Eng. J., 2019, 371, 461–469 CrossRef CAS.
- W. Chu, Y. Hou, J. Liu, X. Bai, Y. F. Gao and Z. Cao, Electrochim. Acta, 2020, 364, 137063 CrossRef CAS.
- C. Guan, X. Liu, W. Ren, X. Li, C. Cheng and J. Wang, Adv. Energy Mater., 2017, 7, 1602391 CrossRef.
- Q. Li, C. Lu, C. Chen, L. Xie, Y. Liu, Y. Li, Q. Kong and H. Wang, Energy Storage Mater., 2017, 8, 59–67 CrossRef.
- J. Pu, F. Cui, S. Chu, T. Wang, E. Sheng and Z. Wang, ACS Sustainable Chem. Eng., 2013, 2, 809–815 CrossRef.
- S. G. Mohamed, I. Hussain and J. J. Shim, Nanoscale, 2018, 10, 6620–6628 RSC.
- G. Sun, L. Ma, J. Ran, X. Shen and H. Tong, J. Mater. Chem. A, 2016, 4, 9542–9554 RSC.
- M. Li, W. Yang, J. Li, M. Feng, W. Li, H. Li and Y. Yu, Nanoscale, 2018, 10, 2218–2225 RSC.
- G. Liu, B. Wang, T. Liu, L. Wang, H. Luo, T. Gao, F. Wang, A. Liu and D. Wang, J. Mater. Chem. A, 2017, 6, 1822–1831 RSC.
- J. J. Zhou, X. Han, K. Tao, Q. Li, Y. L. Li, C. Chen and L. Han, Chem. Eng. J., 2018, 354, 875–884 CrossRef CAS.
- T. Van Ngo, M. Moussa, T. T. Tung, C. Coghlan and D. Losic, Electrochim. Acta, 2020, 329, 135104 CrossRef CAS.
- J. Gu, L. Sun, Y. Zhang, Q. Zhang, X. Li, H. Si, C. Sun, Y. Gong and Y. Zhang, Chem. Eng. J., 2020, 385, 123454 CrossRef CAS.
- T. Deng, Y. Lu, W. Zhang, M. Sui, X. Shi, D. Wang and W. Zheng, Adv. Energy Mater., 2018, 8, 1702294 CrossRef.
- R. Ramachandran, C. Zhao, D. Luo, K. Wang and F. Wang, Electrochim. Acta, 2018, 267, 170–180 CrossRef CAS.
- Y. Liu, G. Li, Y. Guo, Y. Ying and X. Peng, ACS Appl. Mater. Interfaces, 2017, 9, 14043–14050 CrossRef CAS PubMed.
- X. Ge, C. Gu, Z. Yao, J. Sun, X. Wang and J. Tu, Chem. Eng. J., 2018, 338, 211–217 CrossRef CAS.
- L. Kang, S. X. Sun, L. B. Kong, J. W. Lang and Y. C. Luo, Chin. Chem. Lett., 2014, 25, 957–961 CrossRef CAS.
- Q. Wang, Q. Wang, B. Xu, F. Gao, F. Gao and C. Zhao, Electrochim. Acta, 2018, 281, 69–77 CrossRef CAS.
- C. Qu, Y. Jiao, B. Zhao, D. Chen, R. Zou, K. S. Walton and M. Liu, Nano Energy, 2016, 26, 66–73 CrossRef CAS.
- R. Liang, Y. Du, P. Xiao, J. Cheng, S. Yuan, Y. Chen and J. Chen, Nanomaterials, 2021, 11, 1248 CrossRef CAS PubMed.
- D. W. Kim, S. M. Jung and H. Y. Jung, J. Mater. Chem. A, 2020, 8, 532–542 RSC.
- J. Zhang, J. Sun, T. A. Shifa, D. Wang, X. Wu and Y. Cui, Chem. Eng. J., 2019, 372, 1047–1055 CrossRef CAS.
- T. Guan, L. Shen and N. Bao, Ind. Eng. Chem. Res., 2019, 58, 17338–17345 CrossRef CAS.
Footnotes |
| † Electronic supplementary information (ESI) available. See DOI: 10.1039/d1ra08785a |
| ‡ These authors contributed equally to this work. |
| This journal is © The Royal Society of Chemistry 2022 |


