 Open Access Article
Dynamic experiment on the treatment of acidic chromium-containing wastewater by lignite loaded nano FeS†
Xuying Guo *ab,
Xinle Gaoa,
Saiou Fuc,
Guoliang Jiangc,
Yanrong Dongc and
Zhiyong Hu
 a
a
aCollege of Mining, Liaoning Technical University, Fuxin 123000, Liaoning, China. E-mail: guoxuying@lntu.edu.cn
bCollege of Science, Liaoning Technical University, Fuxin 123000, Liaoning, China
cCollege of Civil Engineering, Liaoning Technical University, Fuxin 123000, Liaoning, China
First published on 18th February 2022
Abstract
In terms of the problem of severe pollution to the ecological environment caused by the acidic chrome-containing wastewater produced in the tanning, electroplating, metallurgy, printing and dyeing and other industries, based on the good adsorbability, reducibility and other properties of heavy metals such as Cr(VI) by lignite and nano FeS, the lignite-loaded nano FeS adsorbing material (nFeS-lignite) was prepared by ultrasonic precipitation method. NFeS-lignite and lignite were used as fillers to construct 1# and 2# dynamic columns to carry out the dynamic treatment experiment of acidic chrome-containing wastewater. And nFeS-lignite and lignite were characterized by XRD, SEM and EDS to explore the regularity, long-acting properties and removal mechanism of acidic chrome-containing wastewater treated by NFeS-lignite and lignite. The results indicate that: ① during 25 days of operation, the average removal percentages of Cr(VI) in the 1# and 2# dynamic columns are 71.6% and 53.1%. The average removal percentages of total chromium in 1# and 2# dynamic columns are 54.4% and 28.8%, and the average effluent pH of 1# and 2# dynamic columns is 5.3 and 7.3. ② According to XRD, SEM, EDS and FTIR analysis, the reducing groups in the structure of nFeS-lignite, such as –CH3, –CH2, C–O and Ar-OH, participate in the reaction and are oxidized to C![[double bond, length as m-dash]](https://www.rsc.org/images/entities/char_e001.gif) C, C
C, C![[double bond, length as m-dash]](https://www.rsc.org/images/entities/char_e001.gif) O and other groups. A large number of sediment crystals appeared on the particle surface, and new diffraction peaks such as FeOOH, Cr(OH)3 and Cr2S3 appeared at the same time, indicating that after Cr(VI) was reduced to Cr(III), it would be fixed on the surface of nFeS-lignite in the form of precipitation such as hydroxide and sulfide.
O and other groups. A large number of sediment crystals appeared on the particle surface, and new diffraction peaks such as FeOOH, Cr(OH)3 and Cr2S3 appeared at the same time, indicating that after Cr(VI) was reduced to Cr(III), it would be fixed on the surface of nFeS-lignite in the form of precipitation such as hydroxide and sulfide.
1 Introduction
Due to its unique physical and chemical properties, chromium is widely used in tanning, electroplating, metallurgy, printing and dyeing,1 and the wastewater and waste residue discharged from industrial production become the main source of acid chromium containing wastewater.2 Chromium mainly exists in two valence states of Cr(VI) and Cr(III),3 in which the toxicity of Cr(VI) is hundreds of times higher than that of Cr(III).4,5 Direct emission will cause serious harm to the environment and threaten human health through gradual accumulation in the food chain.6 At present, common treatment technologies for acid chromium containing wastewater include chemical precipitation,7 biological method,8 ion exchange method,9 adsorption method,10 etc. The adsorption method has the advantages of low cost, simple operation and wide application, so it has a good application prospect.11 Nazir et al.12,13 prepared porous composite materials for adsorption studies on malachite green (MG) and methyl orange (MO) in water for many times. The results show that the porous composite has good adsorption effect on MG and MO, and its adsorption capacity is better than other single-phase materials. Khan et al.14 synthesized graphene oxide and MOF based composite material and explored its adsorption effect on antibiotics. The results showed that the adsorption capacity of norfloxacin on the composite was 1114.82 mg g−1, and the removal rate was more than 93%.Nano FeS has good adsorption and reducibility, is environmentally friendly, cheap and easy to obtain, and has a good effect on removing Cr(VI) and other heavy metal pollutants. Liu et al.15 prepared nano FeS by homogeneous precipitation method. Through orthogonal test, the preparation conditions such as Na2S solution concentration, stirring speed, stabilizer dosage and Na2S solution drop acceleration were optimized. The unit removal of Cr(VI) by nano FeS prepared under the optimal conditions was as high as 683 mg g−1. After 15 minutes of reaction, the Cr(VI) removal rate could reach 92.48%. Yang et al.16 treated acidic cadmium containing wastewater with the prepared biological nano FeS. The research shows that increasing the reaction temperature can promote the removal of Cd2+ by biological nano FeS. At 25 °C, 99.93% of Cd2+ can be removed by reacting biological nano FeS with acidic cadmium containing wastewater for 15 minutes. However, nano FeS is easy to settle, oxidize and agglomerate in the preparation and test process. Therefore, it is necessary to choose a cheap and easy to obtain adsorption material with large specific surface area as the carrier.
Lignite reserves account for about 13% of China's total coal reserves.17 It has the characteristics of developed pore structure and high specific surface area. These characteristics make lignite have good adsorption, complexation and ion exchange capacity for heavy metals and other pollutants. Therefore, it is often used as an efficient and low-cost adsorption material in environmental treatment. Jellali et al.18 studied the removal capacity of lignite for Cd2+ and Cu2+ in water. The results show that the saturated adsorption capacity of lignite for Cd2+ and Cu2+ can reach 38.0 mg g−1 and 21.4 mg g−1. The removal rate of Cd2+ is particularly rapid. 78% of Cd2+ can be removed in one minute. Di et al.19 used lignite/maifan stone combined with SRB to prepare immobilized particles to treat chromium containing acid mine wastewater. The results show that the treatment effect of lignite immobilized SRB particles on chromium containing acid wastewater is better than maifan stone immobilized SRB particles, and the removal rates of Cr6+ and SO42− are 96.57% and 36.50% respectively. However, lignite has the characteristics of low removal per unit and slow removal efficiency, so loading modification of lignite with nano-materials with fast reaction rate becomes the focus of research.
Based on this, this study uses lignite as the supporting material and uses ultrasonic precipitation method to prepare lignite supported nano FeS new composite adsorption material (nFeS-lignite). NFeS-lignite can not only solve the agglomeration phenomenon of FeS in production and use, make full use of the advantages of large specific surface area of FeS, so that it can quickly react with Cr(VI), but also solve the shortcomings of low removal amount per lignite unit. Ensure that lignite and FeS play a maximum role in the treatment of acidic chromium-containing wastewater. The dynamic effects and pH changes of Cr(VI) and total chromium in acidic chromium containing wastewater treated by nFeS-lignite and lignite were studied. By constructing nFeS-lignite and lignite particle dynamic columns, the long-term treatment capacity of nFeS-lignite for acid chromium containing wastewater was explored. Combined with XRD, SEM EDS and FTIR analysis, the mechanism of lignite loaded nano FeS in the treatment of acid chromium containing wastewater is revealed, which provides a new idea for the treatment of acid chromium containing wastewater.
2 Materials and methods
2.1 Experimental materials
Lignite: selected from Dabeigou coal mine, Datong City, Shanxi Province. The main chemical composition is shown in Table 1. The lignite is crushed and screened. According to the preliminary test, lignite with particle size of 0.18–0.25 mm (60–80 mesh) is selected to prepare lignite loaded nano FeS.20 The main components of lignite are shown in Table 1.| Constituent | CaO | SiO2 | SO3 | Fe2O3 | MgO | Al2O3 | TiO2 | SrO | CdO | P2O5 | MnO |
| Mass fraction/% | 40.39 | 22.26 | 11.98 | 9.74 | 6.46 | 6.11 | 0.90 | 0.88 | 0.53 | 0.39 | 0.36 |
Acidic chromium-containing wastewater: laboratory simulation of acidic chromium-containing wastewater, using K2Cr2O7 equipped with Cr(VI) concentration of 100 mg L−1, pH = 4 acidic chromium-containing wastewater.
2.2 Experimental method
(1) 4 g of lignite was added to 200 mL of Na2S solution with a certain concentration, and stirred by magnetic stirrer for 8 h. At this point, the absorption of S2− by lignite reaches saturation. Stand for 3–5 min to make lignite particles settle at the bottom of the conical bottle. Slowly pour off the Na2S solution, leaving only the lignite particles at the bottom of the conical flask.
(2) Place the conical bottle containing lignite particles in the ultrasonic cleaning machine. 200 mL FeSO4 solution was prepared according to a certain FeS molar ratio. TDrops of FeSO4 solution were added to conical bottles at room temperature with a peristaltic pump at a flow rate of 0.44 mL s−1. Stirring was carried out with a mechanical agitator at a speed of 350 rpm and ultrasonic treatment was performed at a frequency of 40 kHz for 10 min.
(3) After the ultrasonic treatment, the suspension was centrifuged at 4000 rpm for 15 min. Wash it three times with deionized water. The samples were refrigerated at 4 °C and sealed for later use.
![[thin space (1/6-em)]](https://www.rsc.org/images/entities/char_2009.gif) :
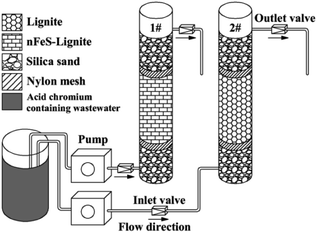
:![[thin space (1/6-em)]](https://www.rsc.org/images/entities/char_2009.gif) 1, and the 2# column is filled with lignite particle size of 0.18–0.25 mm with a filling height of 100 mm. The peristaltic pump is used to pass the acid chromium containing wastewater into the dynamic column in the form of “bottom-up”. In order to ensure the stability of inlet water flow and avoid material loss, 40 mm glass beads are filled at the upper and lower ends of the column, and a layer of nylon filter membrane is placed. The glass beads have been pickled and alkali washed with hydrochloric acid solution and sodium hydroxide solution in advance, and washed with deionized water to remove impurities and metal oxides on the surface of the glass beads. After the dynamic column is installed, deionized water is introduced into the column at a low flow rate to discharge the air in the column, so as to make the column reach stable saturation and avoid dominant flow. The hydraulic retention time of the dynamic column is 2.5 h and the pore velocity is 4 cm h−1. Darcy velocity of each column was calculated according to the porosity of the dynamic column, and then the corresponding inlet flow of the peristaltic pump was determined. The specific test parameters of the dynamic column are shown in Table 2. Collect water samples every 8 h, determine pH value and residual concentrations of Cr(VI) and total chromium, and calculate their removal rate η.
1, and the 2# column is filled with lignite particle size of 0.18–0.25 mm with a filling height of 100 mm. The peristaltic pump is used to pass the acid chromium containing wastewater into the dynamic column in the form of “bottom-up”. In order to ensure the stability of inlet water flow and avoid material loss, 40 mm glass beads are filled at the upper and lower ends of the column, and a layer of nylon filter membrane is placed. The glass beads have been pickled and alkali washed with hydrochloric acid solution and sodium hydroxide solution in advance, and washed with deionized water to remove impurities and metal oxides on the surface of the glass beads. After the dynamic column is installed, deionized water is introduced into the column at a low flow rate to discharge the air in the column, so as to make the column reach stable saturation and avoid dominant flow. The hydraulic retention time of the dynamic column is 2.5 h and the pore velocity is 4 cm h−1. Darcy velocity of each column was calculated according to the porosity of the dynamic column, and then the corresponding inlet flow of the peristaltic pump was determined. The specific test parameters of the dynamic column are shown in Table 2. Collect water samples every 8 h, determine pH value and residual concentrations of Cr(VI) and total chromium, and calculate their removal rate η.
 | (1) |
| Packing | The packing quality/(g) | Proportion | Void ratio | Darcy velocity/(cm h−1) | Peristaltic pump flow rate/(mL min−1) |
|---|---|---|---|---|---|
| nFeS-lignite | 107.93 | 1.4 | 0.39 | 1.55 | 0.32 |
| Lignite | 102.36 | 1.2 | 0.32 | 1.28 | 0.27 |
The micro morphology of acid chromium containing wastewater treated by lignite and nFeS-lignite was analyzed by Sigma 500 scanning electron microscope (SEM); the mineralogical composition of lignite and nFeS-lignite before and after the treatment of acid chromium containing wastewater was studied by Smart Lab 9X-ray (XRD).
3 Results and analysis
3.1 X-ray diffraction analysis
The X-ray diffraction pattern of lignite and nFeS-lignite before and after reaction is shown in Fig. 2.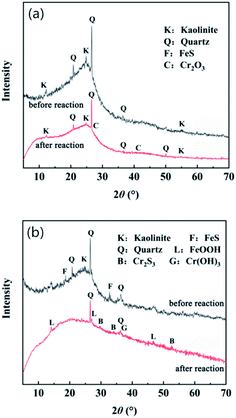 | ||
| Fig. 2 XRD diffraction of lignite before and after the reaction with nFeS-lignite. (a) Lignite. (b) nFeS-lignite. | ||
It can be seen from Fig. 2a that the characteristic peak intensities of kaolinite and quartz after lignite reaction are weakened compared with those before reaction, and the peak intensities at 2θ a new diffraction peak appears at the angle of 50.1°, which corresponds to the crystal plane diffraction of quartz (Minerals no .46-1045). This is because the lignite has been washed by acidic wastewater for a long time, the mineral components contained are gradually eroded by wastewater, and its structural properties change. The strength of the characteristic peak of minerals decreases with it, the acid resistance of quartz is strong, and new characteristic peaks are easy to appear after reaction. In addition, lignite reacted in 2θ new diffraction peaks appear at angles of 27.6° and 41.4°, corresponding to the crystal plane diffraction of Cr2O3 (ICSD Patterns No. 25-1437), indicating that after lignite reduces Cr(VI) to Cr(III), Cr(III) is fixed on its surface by the reaction of oxygen-containing functional groups with Cr(III) to form Cr2O3 precipitation. It can be seen from Fig. 2b that after the nFeS-lignite reaction, the characteristic peak intensity of kaolinite and quartz further weakened, the characteristic peak of kaolinite could not be distinguished, and the FeS characteristic peak disappeared at 2θ diffraction peaks appear at angles of 14.1°, 27.1° and 46.9°, corresponding to the crystal plane diffraction of FeOOH (ICSD Patterns no. 08-0098), at 2θ new diffraction peaks appear at angles of 29.7°, 34.2° and 53.4°, corresponding to the crystal plane diffraction of Cr2S3 (ICSD Patterns no. 11-0007) 2θ a new diffraction peak appears at the angle of 36.9°, corresponding to the crystal plane diffraction of Cr(OH)3 (ICSD Patterns no. 20-0312), indicating that the loaded nano FeS completely reacts with Cr(VI) in the dynamic test, and most of the generated Fe3+ is attached to the nFeS-lignite surface in the form of FeOOH precipitation, S2− is combined with Cr(III) to form Cr2S3 precipitation, and some Cr(III) will form Cr(OH)3 precipitation with the increase of solution pH.
3.2 SEM analysis
Fig. 3 is a SEM diagram of lignite before and after reaction with nFeS-lignite. Comparing Fig. 3a and b, it can be seen that after lignite reaction, the surface gullies increase, the erosion phenomenon is obvious, the mineral structure is damaged, and a large number of irregular lines and fine sediments appear. Combined with the XRD analysis results, it can be seen that the sediment crystal may be Cr2O3 precipitation attached to the lignite surface. Comparing Fig. 3c and d, it can be seen that a large number of well dispersed nano FeS crystals are loaded on the surface of nFeS-lignite before the reaction, but after the reaction, the nano FeS crystals loaded by nFeS-lignite disappear, the surface of lignite particles as a carrier collapses, forming many micro pores, and spherical agglomerated crystals appear on the surface and pores of nFeS-lignite particles, combined with the XRD analysis results, the spherical agglomerated crystals should be FeOOH, Cr2S3 and Cr(OH)3 precipitates formed after the reaction of nano FeS with Cr(VI) and Cr(III). | ||
| Fig. 3 SEM images of lignite and nFeS-lignite before and after reaction. (a) Lignite before reaction. (b) Lignite after reaction. (c) nFeS-lignite before reaction. (d) nFeS-lignite after reaction. | ||
3.3 X-ray energy chromatography
Table 3 and Fig. 4 show the element content and X-ray energy chromatogram (EDS) before and after the reaction of lignite with nFeS-lignite.| Type | Element proportion/% | ||||
|---|---|---|---|---|---|
| C | O | S | Cr | Fe | |
| Before lignite reaction | 75.85 | 20.23 | 2.58 | 0.00 | 1.34 |
| After lignite reaction | 73.12 | 20.57 | 3.41 | 1.01 | 1.89 |
| Before nFeS-lignite reaction | 28.58 | 15.96 | 17.80 | 0.00 | 37.66 |
| After nFeS-lignite reaction | 26.00 | 18.88 | 13.04 | 4.52 | 37.57 |
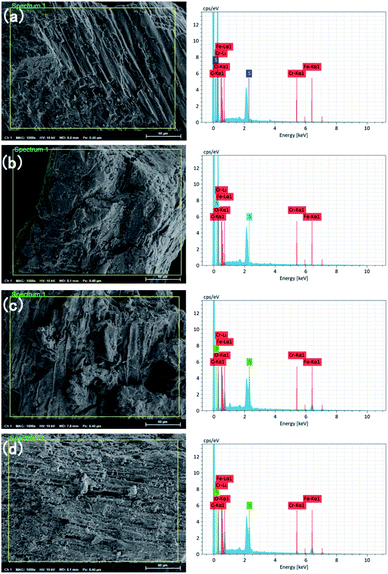 | ||
| Fig. 4 EDS images of lignite and nFeS-lignite before and after reaction. (a) Lignite before reaction. (b) Lignite after reaction. (c) nFeS-lignite before reaction. (d) nFeS-lignite after reaction. | ||
Compared with lignite, the mass percentage of S element in nFeS-lignite increased from 2.58% to 17.80%, and the mass percentage of iron element increased from 1.34% to 37.66%, indicating that nano FeS was successfully loaded on the surface of lignite. Compared with that before the reaction, chromium appeared after the reaction of lignite and nFeS-lignite, and the mass percentages were 1.01% and 4.52% respectively, which proved that lignite and nFeS-lignite had a certain fixation ability for chromium. After the nFeS-lignite reaction, the mass percentage of sulfur decreases slightly, and the proportion of iron changes little. It is confirmed that part of S2− will combine with H+ to form H2S and separate from the reaction system in the form of gas. The rest S2− will form Cr2S3 precipitation with Cr(III). Fe3+ generated after the reaction of Fe2+ with Cr(VI) will hydrolyze to form FeOOH precipitation, and these precipitates will re adhere to the surface of nFeS-lignite.
3.4 Fourier infrared spectroscopy
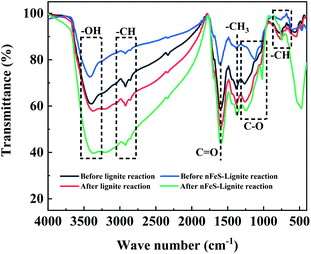
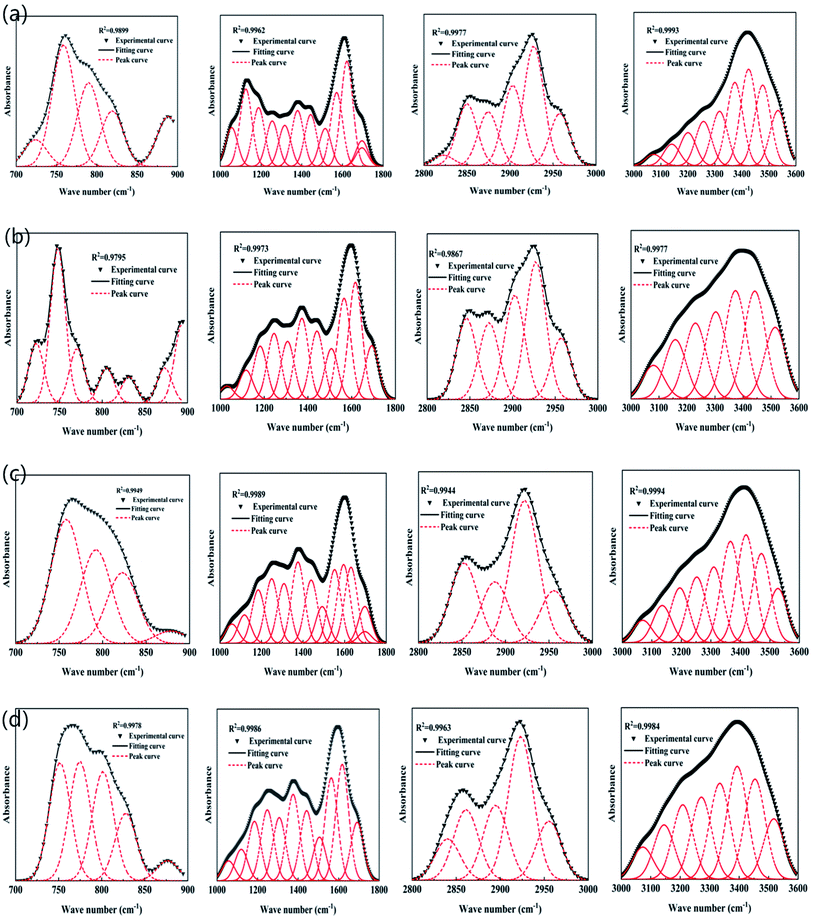
Fig. 5 is the Fourier transform infrared spectrum of lignite and nFeS-lignite before and after reaction.Through the FTIR test of the material, according to the wave number attribution of the functional group absorption band, the infrared spectrum curve can be divided into four parts: aromatic hydrocarbon (900–700 cm−1), oxygen-containing functional group (1800–1000 cm−1), fatty hydrocarbon (3000–28![[thin space (1/6-em)]](https://www.rsc.org/images/entities/char_2009.gif) 000 cm−1) and hydrogen bond (3600–3000 cm−1).21 In order to better understand the distribution of functional groups in the material, peak fitting of the infrared spectrum curve is carried out by using peakfit 4.12 software, so that the similarity R2 between the fitting curve generated by superposition after peak splitting and the experimental curve is at least more than 0.95. The fitting diagram is shown in Fig. 6.
000 cm−1) and hydrogen bond (3600–3000 cm−1).21 In order to better understand the distribution of functional groups in the material, peak fitting of the infrared spectrum curve is carried out by using peakfit 4.12 software, so that the similarity R2 between the fitting curve generated by superposition after peak splitting and the experimental curve is at least more than 0.95. The fitting diagram is shown in Fig. 6.
![[double bond, length as m-dash]](https://www.rsc.org/images/entities/char_e001.gif) C stretching vibration. It can be seen from the area percentage in Fig. 6b that the proportion of reducing functional groups such as(C–O phenols, ethers and C–O in aryl ethers), –CH3 and –CH2 (symmetric Ar-CH3 and asymmetric –CH3, –CH2) of nFeS-lignite and lignite decreased after the reaction, while the total proportion of C
C stretching vibration. It can be seen from the area percentage in Fig. 6b that the proportion of reducing functional groups such as(C–O phenols, ethers and C–O in aryl ethers), –CH3 and –CH2 (symmetric Ar-CH3 and asymmetric –CH3, –CH2) of nFeS-lignite and lignite decreased after the reaction, while the total proportion of C![[double bond, length as m-dash]](https://www.rsc.org/images/entities/char_e001.gif) C (aromatic C
C (aromatic C![[double bond, length as m-dash]](https://www.rsc.org/images/entities/char_e001.gif) C) and carboxyl (–COOH) increased, indicating that the reducing groups of the adsorbent participated in the reduction of Cr(VI) to Cr(III). The reaction itself is oxidized to form functional groups such as C
C) and carboxyl (–COOH) increased, indicating that the reducing groups of the adsorbent participated in the reduction of Cr(VI) to Cr(III). The reaction itself is oxidized to form functional groups such as C![[double bond, length as m-dash]](https://www.rsc.org/images/entities/char_e001.gif) C and C
C and C![[double bond, length as m-dash]](https://www.rsc.org/images/entities/char_e001.gif) O.22
O.223.5 Analysis of Cr(VI) removal effect
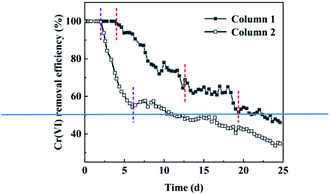
The dynamic change of Cr(VI) removal percentage in the dynamic test of nFeS-lignite treatment of acid chromium containing wastewater is shown in Fig. 7.According to the main functions and reaction modes of nFeS-lignite components in different periods, the change of Cr(VI) removal percentage of 1# column in 25 day column test cycle can be summarized into four stages. According to previous studies, the removal rate of Cr(VI) by FeS is fast, and the removal effect can reach more than 90%. So in the first stage of the reaction (0–4 days), the content of nano FeS loaded by nFeS-lignite is rich, which can quickly oxidize Cr(VI) in wastewater and achieve the effect of complete removal. In the second stage of the reaction (5–12 days), the Cr(VI) removal percentage decreased with the continuous consumption of nano FeS, and the decrease was more and more obvious. On the 12th day, the Cr(VI) removal percentage had decreased to 70.9%. Although lignite participated in the first two stages, the reaction was mainly nano FeS. The third stage of the reaction (13–19 days): the turning point in the removal rate of Cr(VI) indicates that nano FeS does not occupy a dominant position in the treatment of wastewater by nFeS-lignite. At this time, the reducing functional groups in lignite are mainly used to remove Cr(VI) from wastewater. The significant decrease in removal rate at the 17th to 19th day may be caused by the rapid decrease in the number of reducing functional groups in lignite. In the fourth stage of the reaction (20–25 days), although the removal percentage of Cr(VI) fluctuated, the overall downward trend was not obvious. At the end of the test on the 25th day, it decreased to 46.1%. At this time, the removal of Cr(VI) mainly depended on the adsorption of Cr(VI) by the adsorption site of lignite itself. After 25 days of operation, the average removal percentage of Cr(VI) by 1# dynamic column was 71.6%.
The change of Cr(VI) removal percentage of 2# column is relatively simple, which can be summarized into three stages: the first stage of reaction (0–2 days), the second stage of reaction (3–7 days) and the third stage of reaction (8–25 days). Cr(VI) removal percentage changed gradually with the consumption of reducing functional groups of lignite in the first two stages, and decreased steadily with the decrease of adsorption sites after the reaction entered the eighth day. At the same time, the change trend of Cr(VI) removal percentage of 2# column in the third stage of reaction is similar to that of 1# column, which again confirms that lignite adsorption is the main removal mechanism of 1# column after 20 days of reaction. After 25 days of operation, the 2# dynamic column had an average removal percentage of Cr(VI) of 54.4% (Table 4).
3.6 Analysis of total chromium removal effect
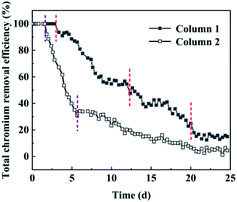
The total chromium removal percentage in the dynamic test of nFeS-lignite for the treatment of acid chromium containing wastewater is shown in Fig. 8.The change of total chromium removal percentage of 1# column in the 25 day column test cycle can also be summarized into four stages, but the time division is different: the first stage of reaction (0–3 days), the second stage of reaction (4–12 days), the third stage of reaction (13–20 days) and the fourth stage of reaction (21–25 days). The change of total chromium removal percentage of 2# column can be summarized into three stages: the first stage of reaction (0–2 days), the second stage of reaction (3–5 days) and the third stage of reaction (6–25 days). In the first two stages of 1# column reaction, Fe2+ produced by nano FeS ionization reacts with Cr(VI) to form Fe3+ and Cr(III), and S2− reacts with Cr(III) to form Cr2S3 precipitation. This process will cause the pH of the solution to rise. Therefore, Fe3+ hydrolyzes to form FeOOH and Fe(OH)3 precipitates, which play a certain role in adsorption and complexation of Cr(III). Cr(III) itself will also form Cr(OH)3 precipitates, so that the 1# column can maintain a high total chromium removal percentage. With the consumption of nano FeS, the removal mechanism of total chromium by 1# column is gradually similar to that of 2# column. Both rely on the oxygen-containing functional groups on the lignite surface to form –O–Cr–O structure with Cr(III), so as to fix and remove Cr(III).34,35 In the final reaction stage, 1# column and 2# column mainly dynamically remove chromium ions from wastewater through lignite adsorption sites. The total chromium removal percentage decreases steadily with the reduction of adsorption sites. At the end of the test on the 25th day, the total chromium removal percentages of the two dynamic columns are 15.1% and 4.56% respectively. At this time, the adsorption capacity of 2# column for chromium ions is close to the saturation value. After 25 days of operation, the average removal percentages of total chromium by 1# column and 2# column were 53.1% and 28.8% respectively (Table 5).
3.7 pH change analysis
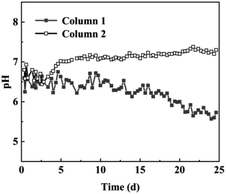
The pH change curve of the dynamic test of nFeS-lignite for the treatment of acid chromium containing wastewater is shown in Fig. 9.It can be seen from Fig. 9 that 1# column and 2# column have good effect on improving the pH of wastewater. Comparing the Cr(VI) and total chromium removal percentage curves in Fig. 7 and 8, it can be seen that the pH change of 1# column during 0–12 days of reaction is mainly affected by nano FeS reaction. The ionization process of nano FeS needs to consume H+, and the S2− produced by ionization can combine with H+ to form HS− or H2S, which is separated from the wastewater in the form of gas. Therefore, although the pH of the effluent of the 1# column fluctuates, it remains at about 6.6.36 After the 13th day of the reaction, lignite in nFeS-lignite became the main force for chromium removal, so the pH of effluent gradually decreased to 5.3 at the end of the test on the 25th day, because the kaolinite and other mineral components of lignite were affected during the preparation of nFeS-lignite, and the ability of adsorbent to adjust pH was weakened. In the early stage of the reaction, the 2# column mainly relies on the active groups of lignite to remove chromium ions. These acidic organic matter can not effectively improve the pH of wastewater when reacting with chromium,37 so that the pH of effluent from the 2# column fails to reach neutral during the reaction period of 0–5 days. With the continuous progress of the reaction, the alkaline mineral composition of lignite wrapped by organic matter gradually revealed, effectively neutralized the acidic wastewater, and the pH of 2# column effluent gradually increased to 7.3 at the end of the test on the 25th day.
4 Conclusion
(1) By constructing two groups of dynamic column experimental models of nFeS-lignite and lignite particles to treat acid chromium containing wastewater, the long-term treatment capacity of nFeS-lignite for acid chromium containing wastewater was explored. The test results show that after 25 days of operation of the dynamic column, 1# the average removal percentages of Cr(VI) and total chromium by the dynamic column are 71.6% and 53.1% respectively, the effluent pH is reduced from 6.6 to 5.3, 2# the average removal percentages of Cr(VI) and total chromium by the dynamic column are 54.4% and 28.8% respectively, and the effluent pH is increased from 6.6 to 7.3, indicating that the nano FeS loaded nFeS-lignite has a better remediation effect on acid chromium containing wastewater.(2) SEM, EDS and FTIR analysis showed that after the reaction of nFeS-lignite and lignite, the structure was eroded, the surface folds increased and a large number of sediment crystals appeared. Reducing groups such as –CH3, –CH2, C–O and Ar-OH participated in the reaction and were oxidized to C![[double bond, length as m-dash]](https://www.rsc.org/images/entities/char_e001.gif) O, C
O, C![[double bond, length as m-dash]](https://www.rsc.org/images/entities/char_e001.gif) O and other groups. New diffraction peaks such as FeOOH, Cr(OH)3 and Cr2S3 appeared in the XRD spectrum after nFeS-lignite reaction, indicating that after Cr(VI) was reduced to Cr(III), it would be fixed on the surface of nFeS-lignite in the form of precipitation such as hydroxide and sulfide.
O and other groups. New diffraction peaks such as FeOOH, Cr(OH)3 and Cr2S3 appeared in the XRD spectrum after nFeS-lignite reaction, indicating that after Cr(VI) was reduced to Cr(III), it would be fixed on the surface of nFeS-lignite in the form of precipitation such as hydroxide and sulfide.
Author contributions
Conceptualization: Xuying Guo and Saiou Fu; methodology, Xuying Guo; software, Xuying Guo and Xinle Gao; validation, Xuying Guo, and Yanrong Dong; formal analysis, Xuying Guo; investigation, Xuying Guo and Guoliang Jiang; resources, Xinle Gao and Zhiyong Hu; data curation, Xuying Guo and Xinle Gao; writing—original draft preparation, Xinle Gao; writing—review and editing, Guoliang Jiang and Yanrong Dong; visualization, Xuying Guo; supervision, Yanrong Dong and Saiou Fu; project administration, Guoliang Jiang and Saiou Fu; all authors have read and agreed to the published version of the manuscript.Conflicts of interest
There are no conflicts to declare.Acknowledgements
The project is funded by the National Natural Science Foundation of China (51304114), Department of Education of Liaoning Province (LJ2017FAL016, LJKZ0340).References
- C. Wang, Y. Jiang, J. Shang, B. Zhu and Y. Chen, Liaoning Chem. Ind., 2021, 50(6), 828–830 Search PubMed.
- B. Saha and C. Orvig, Coord. Chem. Rev., 2010, 254(23), 2959–2972 CrossRef CAS.
- S. Zink, R. Schoenberg and M. Staubwasser, Geochim. Cosmochim. Acta, 2010, 74, 5729–5745 CrossRef CAS.
- N. Kocberber and G. Donmez, Bioresour. Technol., 2007, 98(11), 2179–2183 CrossRef PubMed.
- N. Unceta, F. Séby, J. Malherbe and O. F. X. Donard, Anal. Bioanal. Chem., 2010, 397(3), 1097–1111 CrossRef CAS PubMed.
- P. Venkateswaran and K. Palanivelu, Hydrometallurgy, 2005, 78(12), 107–115 CrossRef CAS.
- J. L. P. Sheeja, Orient. J. Chem., 2016, 32(4), 2209–2213 CrossRef CAS.
- G. Kaur, S. J. Couperthwaite, B. W. Hatton-Jones and G. J. Millar, J. Water Process. Eng., 2018, 22, 46–58 CrossRef.
- M. Pratima, A. Ghosh, Y. Ramamurthy, B. D. Pandey and M. L. Torem, Russian Journal of Non-Ferrous Metals, 2018, 59(5), 533–542 CrossRef.
- B. Dinaol, A. Kenatu, T. Amare, K. Helmut and F. Jemal, Energy Ecol. Environ., 2020, 5(3), 184–195 CrossRef.
- F. Li, R. Li and J. Wen, Chemical Engineer, 2022, 36(1), 47–49 Search PubMed.
- M. A. Nazir, M. A. Bashir, T. Najam, M. S. Javed, S. Suleman, S. Hussain, O. P. Kumar, S. S. A. Shah and A. Rehman, Microchem. J., 2021, 164(8), 105973 CrossRef CAS.
- M. A. Nazir, N. A. Khan, C. Cheng, S. S. A. Shah and A. U. Rehman, Appl. Clay Sci., 2020, 190, 105564 CrossRef CAS.
- N. A. Khan, S. Shaheen, T. Najam, S. S. A. Shah, M. S. Javed, M. A. Nazir, E. Hussain, A. Shaheen, S. Hussain and M. Ashfaq, Toxin Rev., 2020, 2020, 1–13 Search PubMed.
- Y. Liu, W. Xiao, J. Wang, A. M. Zakaria, W. Tao and M. Jae-Min, J. Nanomater., 2016, 2016, 1–9 CAS.
- Y. Yang, Y. Xie and X. Li, J. Environ. Biol., 2015, 36(2), 393–398 CAS.
- Q. Zhao, Clean Coal Technol., 2018, 24(2), 9–14 CrossRef.
- S. Jellali, A. A. Azzaz, M. Jeguirim, H. Hamdi and A. Mlayah, Water, 2021, 13(2), 164 CrossRef CAS.
- J. Di, J. Liu, J. Guo and S. Fu, Journal of Water Resources and Water Engineering, 2020, 31(1), 29–32 Search PubMed.
- X. Guo, S. Fu, J. Di and Y. Dong, Coal Sci. Technol., 2020, 48(9), 152–159 Search PubMed.
- H. Xin, D. Wang, X. Qi, G. Qi and G. Dou, Fuel Process. Technol., 2014, 118, 287–295 CrossRef CAS.
- T. Zhao, W. Ge, F. Yue, Y. Wang, C. M. Pedersen, F. Zeng and Y. Qiao, Fuel Process. Technol., 2016, 152, 375–380 CrossRef CAS.
- C. Liang, W. Liang and W. Li, Coal Sci. Technol., 2020, 48(S1), 182–186 Search PubMed.
- C. Li, J. Wang, L. Dong, Y. Sun and X. Cao, Spectrosc. Spectral Anal., 2014, 34(11), 2961–2967 CAS.
- P. Hao, Y. Meng, F. Zeng, T. Yan and G. Xu, Spectrosc. Spectral Anal., 2020, 40(3), 787–792 CAS.
- J. Cheng, M. Huang and S. Cai, Complex Utilization of Valuable Minerals, 2022, 2022, 1–8 Search PubMed.
- X. Wu, W. Chen, H. Zhang, H. Zheng, Y. Lu and R. Zhang, Industrial Safety and Environmental Protection, 2018, 44(11), 67–71 Search PubMed.
- G. Weng, X. Li, D. Yang and Y. Li, J. Fuzhou Univ., 2003, 2003(1), 116–119 Search PubMed.
- J. Zhang, S. Li, Q. Wu, A. Wei, P. Ning and D. Zhang, Guangzhou Chem., 2016, 41(6), 46–49 Search PubMed.
- J. Di, H. Xu, W. Zhao, G. Jiang, J. Guo, J. Liu and X. Lin, Ind. Water Treat., 2019, 39(12), 33–36 Search PubMed.
- R. Wang and H. Xu, Water Treat. Technol., 2017, 43(11), 77–79 CAS.
- H. Fang, Chem. Eng., Equip., 2012, 2012(6), 191–196 Search PubMed.
- X. Pan, S. Wang, W. Tong and A. Chang, Environmental Pollution Control Technology and Equipment, 2003, 2003(12), 36–39 Search PubMed.
- J. Di, X. Lin and Y. Dong, Non-Met. Mines, 2019, 42(6), 86–89 Search PubMed.
- L. Kang, H. Yang, L. Wang, S. Chai, R. Zhang, J. Wu and X. Liu, J. Hazard. Mater., 2020, 398, 122834 CrossRef PubMed.
- H. Tian, J. Li, Z. Mu, L. Li and Z. Hao, Sep. Purif. Technol., 2009, 66(1), 84–89 CrossRef CAS.
- X. Gu, Humic Acid, 2021,(1), 24–28 Search PubMed.
Footnote |
| † Electronic supplementary information (ESI) available. See DOI: 10.1039/d1ra08892k |
| This journal is © The Royal Society of Chemistry 2022 |

