 Open Access Article
Chemical redox-induced chiroptical switching of supramolecular assemblies of viologens†
Yutaka Kuwahara *ab,
Mio Itoa,
Tatsumi Iwamotoa,
Makoto Takafuji
 ab,
Hirotaka Ihara
 ac,
Naoya Ryu
 d and
Tomoyasu Mani
 e
e
aDepartment of Applied Chemistry and Biochemistry, Kumamoto University, 2-39-1 Kurokami, Chuo-ku, Kumamoto 860-8555, Japan. E-mail: kuwahara@kumamoto-u.ac.jp
bInternational Research Organization for Advanced Science and Technology (IROAST), Kumamoto University, 2-39-1 Kurokami, Chuo-ku, Kumamoto 860-8555, Japan
cNational Institute of Technology, Okinawa College, 905 Henoko, Nago, Okinawa 905-2192, Japan
dMaterials Development Department, Kumamoto Industrial Research Institute, 3-11-38 Higashimachi, Higashi-ku Kumamoto 862-0901, Japan
eDepartment of Chemistry, University of Connecticut, 55 N. Eagleville Rd, Storrs, CT 06269-3060, USA
First published on 12th January 2022
Abstract
A chiral supramolecular assembly exhibiting redox-induced changes in its chiroptical properties was prepared using viologen-modified glutamide (G-V2+) derivatives. Achiral viologen moieties in the G-V2+ assembly were chirally orientated by glutamide groups, affording a unique orange-colored solution, with a visible absorption band at around 470 nm, having electronic circular dichroism (CD) signals (molar ellipticity [θ] = 0.58 × 10⁵ deg cm2 dmol−1: absorption dissymmetry factors (g) = 5.2 × 10⁻³ at 512 nm). The G-V2+ could be reduced to its cation radical (G-V+˙) but retains its chiral assembly. After chemical reduction, the color change from orange to blueish violet, indicating an absorption band at approximately 560 nm, and the sign change of the CD signal from positive to negative ([θ] = −0.36 × 10⁵ deg cm2 dmol−1; g = −2.9 × 10⁻³ at 580 nm) were observed in water. Subsequent oxidation re-introduces the G-V2+ chiroptical behavior before reduction.
Introduction
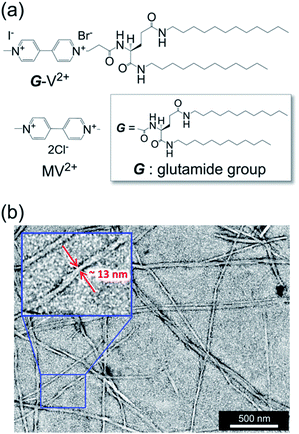
Chiroptical devices and systems processing signals denoting hierarchical information as multiple properties of light such as intensity, wavelength (color), and linear and circular polarizations are desirable as they are promising candidates in next-generation chiroptical-management technologies, such as holographic storage systems,1,2 displays,3 security systems,4 and other chiral photonic devices.5–7 Electron redox reactions as well as photoisomerizations8 are often employed to control the optical9–12 and chiroptical properties (e.g., optical rotations and intensities in electronic circular dichroism (CD) and circularly polarized luminescence (CPL) spectra)8,13–15 of such materials. Electron redox-induced color changes (termed “electrochromism”) are used in electro-responsive, light-management devices,11,16–19 such as smart windows, electronic paper, and displays. However, developing redox-induced electro-responsive chiroptical switching (ECSw) systems remains challenging. These systems can be informally categorized into four types depending on their color and chiroptical changes in the visible region (Table 1). Types I and III are predominant ECSw behaviors and do not change the signs of CD or CPL signals, while types II and IV change the signs but are less common (Table S1 and attached references13–15,20–23 in the ESI†). This may be because sign changes usually require significant structural reformation in terms of the chiral ordering of the other rotational direction. One attractive yet challenging method for preparing ECSw systems is the bottom-up development of organic systems for circularly polarized (CP) light management, mimicking (and inspired by) communication systems observed in nature.24–26 This strategy may yield reasonable and suitable systems based on appropriate organic chiral sources from nature, such as optically active skeletons of amino acids and sugars, α-helices of proteins,27 and helical strands of RNA and DNA.28 Therefore, combining such organic chiral sources and electro-responsive groups is promising to develop and improve the versatility of lightweight ECSw systems (Fig. 1). In this work, to diversify ECSw systems, we proposed and investigated a chiral supramolecular assembly system comprising a 4,4′-bipyridinium (viologen)-modified, artificial, lipid-type glutamide (G: Fig. 2a) derivative, G-V2+ (V2+: viologen), derived from L-glutamic acid. Notably, the system exhibited ECSw behaviors, providing color and sign changes through the self-assembly of G-V2+ molecules. Viologens, namely their V2+ forms, are well-studied29,30 as electro-responsive organic systems because of their good electrochromism induced by redox cycles. Moreover, few completely organic ECSw systems with viologen groups and chiral molecules have demonstrated type-I and -III ECSw behaviors.20,21 G derivatives reported during the 1980s31 effectively induced supramolecular gels from fibrillar assemblies of their photofunctional moieties with chiral orientations.32,33 Eventually, these chiral organizations could induce various chiroptical functions such as CPL generation,34 CPL color tunability,35 and room-temperature phosphorescence.36 Herein, we expected that V2+ moieties would exhibit chiral order within the fibrillar assemblies induced by G groups, as well as reversible changes in the color and chiroptical properties in response to redox stimuli.| Type | Color changea | Chiroptical changesb | ||
|---|---|---|---|---|
| Sign | Intensity | Spectral responsec | ||
| a Visible-region absorption.b Electronic circular dichroism (CD) or circularly polarized luminescence (CPL) spectroscopy.c Original (blue) and response (red) CD or CPL spectra in the visible region, λ: wavelength, θ: ellipticity, Int.: intensity of CPL.d No change.e Change. | ||||
| I | Nd | N | Ye |  |
| II | N | Y | Y/N |  |
| III | Y | N | Y/N |  |
| IV | Y | Y | Y |  |
| Electro-chromism | Y | No signal |  |
|
 | ||
| Fig. 1 Strategy for development of lightweight electro-responsive chiroptical switching (ECSw) systems combining organic chiral sources and electro-responsive groups. | ||
Results and discussion
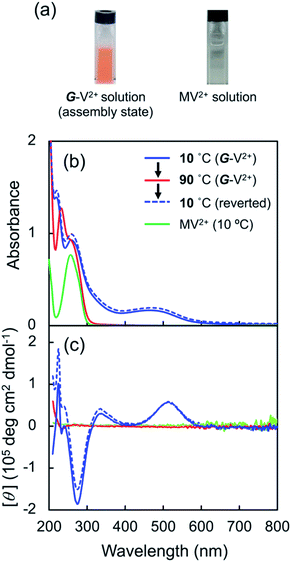
G-V2+ (Fig. 2a) was synthesized as per a previous report (details in ESI†).37,38 Macroscopic gel states were clearly observed for aqueous solutions of G-V2+ (>10 mM) below room temperature, similar to those observed for previously reported supramolecular gel systems of G derivatives in various solvents.32,33 Using transmission electron microscopy (TEM) (Fig. 2b), partially twisted fibril structures (minimum width: ∼10 nm) were observed in the 0.5 mM aqueous G-V2+ solution, although it was not in the macroscopic gel state. Thus, the G-V2+ molecules in water formed self-organized fibrillar assemblies similar to those of other G derivatives in various solvent systems,32,33 resulting in a web-like structure. The G-V2+ aqueous solution exhibited an unusual, orange color at 10 °C, while the aqueous solution of a reference molecule, methyl viologen (MV2+), was colorless at the same temperature (Fig. 3a). The UV-vis spectrum of the 0.2 mM aqueous G-V2+ solution at 10 °C exhibits a broad absorption band at ∼470 nm and a shoulder near 340 nm (solid red line, Fig. 3b), in addition to the bands below 250 nm attributed to the amide bonds of the G group and at 258 nm attributed to the π–π* transition of the aromatic groups on V2+ moieties, thus resembling the UV-vis spectrum of MV2+ (black line, Fig. 3b). These assignments are similar to previous findings.32,33,39 Three instances of the V2+ coloration in the visible region have been reported as formation of charge transfer (CT) complexes (1) with strong donor counter anion, (2) in less polar media, and (3) in solid state.29,40,41 However, no prior studies with a halogen anion (X−) in aqueous solutions have reported these bands until the visible region. Meanwhile, no CD signals were observed in the CD spectrum of a 0.2 mM aqueous solution of achiral MV2+ at 10 °C (green line, Fig. 3c). In contrast, for a 0.2 mM aqueous G-V2+ solution at 10 °C, CD signals were observed at wavelengths <250 nm (positive Cotton effect (+) with splits) and at 274 nm (negative Cotton effect (−): molar ellipticity [θ] = −1.9 × 10⁵ deg cm2 dmol−1), 512 (+: [θ] = 0.58 × 10⁵ deg cm2 dmol−1) and 336 nm (+) (Fig. 3c); these correspond to UV-vis absorption bands below 250 nm, those at 258 and 470 nm, and the shoulder at 340 nm (solid blue line, Fig. 3b), respectively. The negative and positive Cotton effects are generally derived from S- and R-rotationally ordered chirality, respectively.42,43 The apparent absorption dissymmetry factors (g)44 for the 274 and 512 nm signals of the G-V2+ assemblies were estimated as g274 = −2.7 × 10⁻³ and g512 = 5.2 × 10⁻³, respectively, although the exact molar extinction coefficient of the latter band could not be obtained. These induced CD signals of G-V2+ of the order 104 to 105 (deg cm2 dmol−1) are similar to those previously reported,32,33 and are stronger than those of small chiral molecules. This suggests that the V2+ groups within the G-V2+ supramolecular assemblies induced by the G groups are chirally ordered, with secondary chirality at 10 °C. The main electric transition dipole moment of the V2+ groups, associated with the 274 nm signal, indicates order with S-chiral rotation, but that with the 512 nm signal might assume order with an R-chiral rotation, similar to that of the amide (Am) groups (signals below 250 nm). The temperature dependence of the UV-vis and CD spectra is shown in Fig. 3b and c, respectively. In Fig. 3b, the absorption bands below 250 nm, and those at 258 nm slightly shift after heating from low (10 °C) to high (90 °C, red line) temperatures, whereas the shoulder at 340 nm and the visible-region band at 470 nm are not observed at 90 °C. The CD signals within the wide, UV-visible region (250–800 nm) that correlate with the V2+ groups are also not observed at 90 °C (Fig. 3c). Thus, the chiral orientation of V2+ groups within G-V2+ assemblies may be disrupted by the thermally induced transitions of aggregated states at lower temperatures to monomeric G groups at higher temperatures. This is suggested by the phase-transition temperature of G-V2+ (TG-V2+) (68 °C), which is assigned to the transition of the G lipid from the crystal to liquid–crystal phase.43,45 This was based on the endothermic peak of the thermogram obtained for the aqueous G-V2+ solution using differential scanning calorimetry (Fig. S1†). Subsequent cooling to a low temperature (10 °C) yielded UV-vis and CD spectra (broken blue lines in Fig. 3b and c, respectively), similar to those observed prior to heating (solid blue lines 1c and 1d, respectively), suggesting that the G-V2+ assemblies, including the V2+ groups orientated with secondary chirality, were regenerated. The TG-V2+ of the G-V2+ solution (68 °C) is >20 °C higher than that (TG-Py+, 43 °C) of a mono-pyridinium-substituted G derivative (G-Py+: Fig. S2†) in water.43 Therefore, the G-V2+ assemblies reveal high thermal stability with strong intermolecular interactions that are affected by the multiple hydrogen bonds of the G groups and π–π interactions of the V2+ moieties, despite the repulsion between their dications. These strong interactions may result in nano-fibrillar assemblies of the G-V2+ exhibiting unique chiroptical properties such as an orange color and strong UV-vis/CD signals in the visible region (Fig. 3b and c). The shoulder at 340 nm, and the visible-region band at 470 nm, could be assigned as V2+⋯X− (as a donor group) and/or V2+⋯Am (including a loan pair in the G) of CT complexes stabilized through lower polarity or less mobile conformations induced by the strong interactions of the G-V2+ assembly (Fig. 4), as reported in previous papers.29,40,41 However, the precise mechanism with the V2+ conformation in the present work is unclear, even with computational techniques, necessitating further investigation.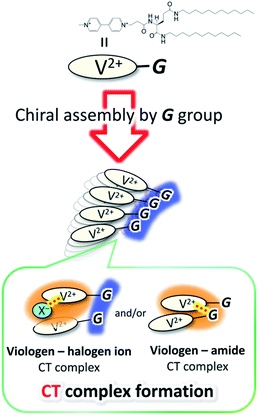 | ||
| Fig. 4 Schematic drawing for the formation of CT complexes between V2+ and donor (X− and/or amide) groups by chiral assembling of G groups. | ||
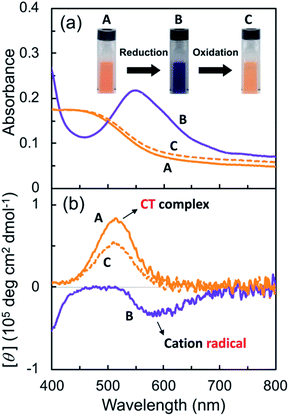
Subsequently, the G-V2+ assemblies were chemically reduced in an aqueous solution. Sodium dithionite (Na2S2O4) was employed as the reductant,29,46 as the process would require less reagent than the electrolyte amount required for an electrochemical reduction. The solutions changed from orange to blue-violet after adding the reductant solution (A to B in Fig. 5a). In the UV-vis spectrum of the G-V2+ solution (0.5 mM), the absorption band intensities at approximately 320, 370 (with a shoulder at 400 nm), and 560 nm (with a shoulder at 600 nm) increased after reduction when an equivalent amount of reductant was used (purple line, Fig. 5a and S5a†).
Furthermore, decreases in the absorption band intensities at 258 and 470 nm were observed when compared to prior to reduction (solid orange line, Fig. 5a and S5a†). The increased absorptions at approximately 370 and 560 nm can be assigned to singly occupied molecular orbital (SOMO), to lowest unoccupied molecular orbital (LUMO) or highest occupied molecular orbital (HOMO) to SOMO transitions, suggesting that the V2+ moieties converted to V+˙ species.29,30,46 Meanwhile, the 320 nm band corresponds to the reducing agent. Furthermore, the absorption bands at 370 and 560 nm in the UV-vis spectrum may suggest that the main species in aggregated G-V+˙ are the intermolecular interaction states of two or more V+˙ species, rather than the monomeric state (observed as the shoulder bands at 400 and 600 nm).29,30 In the CD spectrum after reduction (purple line, Fig. 5b and S5b†), the signals at 277 (−) and 514 nm (+), which were observed prior to reduction (solid orange line, Fig. 5b), were not detected. Additionally, two CD signals at approximately 387 (−: [θ] = −0.64 × 10⁵ deg cm2 dmol−1; g = −3.0 × 10⁻³) and 580 nm (−: [θ] = −0.36 × 10⁵ deg cm2 dmol−1; g = −2.9 × 10⁻³), corresponding to the absorption bands at 370 and 560 nm (purple line, Fig. 5a and S5†), respectively, were enhanced. The reduction-induced changes observed in the CD spectra are consistent with those observed in the UV-vis spectra. These spectra also suggest the following changes were caused. First, the V+˙ moieties within the G-V+˙assemblies inherit a G-induced orientation with secondary chirality, similar to the V2+ moieties within the G-V2+ assemblies prior to reduction. Second, the positive and negative CD signals at 514 and 260 nm, derived from the CT complexes and aromatic groups of V2+ moieties, respectively, convert to a negative signal at 580 nm derived from V+˙ moieties. These chiroptical changes indicate that R- and S-chirally oriented transition dipole moments, correlated with V2+ moieties in the assembly, convert to an S-chirally oriented transition dipole moment correlated with V+˙ moieties while maintaining the chiral assembly conformation. To the best of our knowledge, no prior study has described the chiroptical properties of chiral assemblies containing viologen cation radicals; we show that a unique, type-IV ECSw behavior is observed in G-V2+ nano-fibrillar materials, along with changes in their colors and signs of their strong CD signals after reduction. Moreover, a broad signal was detected in the electron paramagnetic resonance (EPR) spectrum of the G-V2+ assemblies after reduction (Fig. S5†), attributed to paramagnetic cation radicals29 within G-V+˙ aggregates.
Viologen cation radicals are easily oxidized by the oxygen in air; hence, the G-V+˙ aqueous solution was exposed to air at 10 °C to oxidize V+˙ and regenerate V2+ moieties. This was confirmed by the UV-vis and CD spectra (broken lines, Fig. 5a and b, respectively) after oxidation, which were similar to those (solid orange lines, Fig. 5a and b, respectively) prior to reduction. However, despite the almost complete reversion of the UV-vis signals, the CD signal intensities at 530 nm (+) decreased by ∼30% after one redox cycle; this might indicate that the chiral orientation of G-V2+ is partially disordered by the coexistence of byproducts such as HSO3− ions from the reductant rather than decomposition of G-V2+ moieties. Upon oxidation under air at 10 °C, the V+˙ moieties within G-V+˙ are oxidized to V2+ species within G-V2+, retaining the assembled chiral conformations. Moreover, the UV-vis spectra of multiple redox cycles at 10 °C underwent reversible changes like those in Fig. 6. This indicates that the conversion between the G-V2+ and G-V+˙ assemblies is still reversible after multiple redox cycles, and the chiral supramolecular structure is maintained.
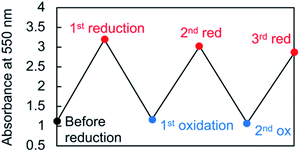 | ||
| Fig. 6 Absorbance changes of the 550 nm peak in the UV-vis spectrum throughout multiple redox cycles for an aqueous G-V2+ solution (0.5 mM) at 10 °C. | ||
Conclusions
G-V2+ molecules formed chiral supramolecular assemblies through G-induced self-assembly. These assemblies exhibited reversible, type-IV ECSw behavior utilizing the chiroptical properties with unusual CT bands of V2+ assemblies induced by the G groups. They demonstrated changes in the color and signs of their visible-region chiroptical signals, due to the strong intermolecular interactions within them in water at lower than room temperature. The UV-vis and CD spectra indicated that V2+, V+˙after reduction and V2+ after oxidation within the assemblies organize with chiral orientations while maintaining the assembled state. Using the chiral self-organizing properties of G derivatives, we developed a novel class of metal-free, chiroptical, 1D nanomaterials exhibiting reversible electrochromism and chiroptical switching behavior. These materials are promising candidates for next-generation, electro-responsive chiroptical devices, such as chiroptic dimmable windows, chiroptic e-papers, and security sensors with chiral recognition. Additionally, concentrated cation radicals within the nanofibrillar G-V+˙ assemblies are promising novel reactive and paramagnetic reagents for new radical reactions.Experimental
Materials and instrumentations
All chemicals were of reagent grade and were purchased from chemical suppliers (Tokyo Chemical Industry Co., Ltd., FUJIFILM Wako Pure Chemical Corp., and Sigma-Aldrich, Inc.). The NMR spectra, UV-visible (UV-vis) spectra, circular dichroism (CD) spectra, and electron paramagnetic resonance (EPR) spectra were measured using JNM-EX400 (JEOL, Tokyo, Japan), V-560 (JASCO, Tokyo, Japan), J-725 (JASCO, Tokyo, Japan), and JES-X320 (JEOL, Tokyo, Japan) spectrometers, respectively. Transmission electron microscopy (TEM) was conducted using a JEM-1400 Plus microscope (JEOL, Tokyo, Japan). Differential scanning calorimetry (DSC) thermograms (Fig. S1†) were obtained using a DSC 6200 differential scanning calorimeter (Seiko Instruments Inc., Chiba, Japan). An aqueous solution of viologen-modified glutamide (G) derivatives, G-V2+, (20 mM, 50 μL; Fig. 2a), was sealed in 70 μL silver pans and scanned between 5 and 90 °C at a heating and cooling rate of 2 °C min−1 under a N2 atmosphere (50 mL min−1).Solution preparation for spectroscopic and microscopic analysis
Samples for UV-vis, CD, and EPR spectroscopies, as well as TEM studies, were thermally pre-treated before use: An aqueous G-V2+ solution was sonicated for 10 min using a SONIFIER SFX250 (Branson Ultrasonics Corp., Danbury, CT, USA) and heated for 15 min at 90 °C to completely solubilize the compound to a monomeric state. The solution was cooled to 10–20 °C and maintained at this temperature for 30 min to enable self-assembly of G-V2+.Sample preparation for TEM
A droplet of the aqueous G-V2+ solution (0.5 mM, ca. 20 μL) was cast on a carbon-coated copper grid, and an aqueous solution of uranyl acetate (1 wt%, ca. 20 μL) was added to the droplet. The excess solution was removed using filter paper. After vacuum drying, the grid was used for TEM.Chemical redox reactions
An aqueous solution of G-V2+ (0.5 mM), including its assemblies, was reduced by using sodium dithionite (Na2S2O4, 0.5 mM).29,46 The aqueous solution, now containing G-V+˙ assemblies, was then oxidized by exposure to air at 10 °C to regenerate G-V2+. In the multiple redox cycles, sodium dithionite was consumed three and ten times more for the second and third reductions, respectively.EPR spectroscopy
EPR spectra were measured with an aqueous sample cell (LC12; flat type, 10 mm width × 0.25 mm thickness) in the solution state at 20 °C using an EPR spectrometer (JES-X320, JEOL RESONANCE Inc.). An aqueous G-V2+ solution (0.5 mM) was reduced using sodium dithionite (0.6 mM) under an Ar atmosphere in a glove box (MF-100, UNICO Inc.), and was moved into the aforementioned EPR cell for measurement. The EPR spectrum of the G-V2+ solution after reduction was analyzed, and the g-factor (dimensionless magnetic moment) was calculated using a software attached to the EPR spectrometer.Synthesis of L-glutamic acid derivatives, G-V2+
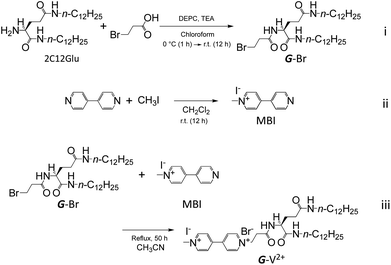
The derivatives of viologen-substituted L-glutamic acid, G-V2+, was synthesized by three steps (i)–(iii) in Scheme 1.![[double bond, length as m-dash]](https://www.rsc.org/images/entities/char_e001.gif) O, amide), 1556 cm−1 (δN–H). 1H-NMR (400 MHz, CDCl3, TMS, 25 °C): δ 0.86–0.90 (t, 6H, CH3), 1.26 (m, 36H, CH3(CH2)9), 1.45–1.55 (m, 4H, NHCH2CH2), 2.00–2.15 (m, 2H, C*HCH2), 2.25–2.55 (m, 2H, C*HCH2CH2), 2.75–2.95 (m, 2H, BrCH2CH2), 3.15–3.30 (m, 4H, NHCH2), 3.67 (t, 2H, BrCH2), 4.35–4.45 (m, 1H, C*H), 5.89 (t, 1H, NH), 6.84 (t, 1H, NH), 7.48–7.55 (d, 1H, NH).
O, amide), 1556 cm−1 (δN–H). 1H-NMR (400 MHz, CDCl3, TMS, 25 °C): δ 0.86–0.90 (t, 6H, CH3), 1.26 (m, 36H, CH3(CH2)9), 1.45–1.55 (m, 4H, NHCH2CH2), 2.00–2.15 (m, 2H, C*HCH2), 2.25–2.55 (m, 2H, C*HCH2CH2), 2.75–2.95 (m, 2H, BrCH2CH2), 3.15–3.30 (m, 4H, NHCH2), 3.67 (t, 2H, BrCH2), 4.35–4.45 (m, 1H, C*H), 5.89 (t, 1H, NH), 6.84 (t, 1H, NH), 7.48–7.55 (d, 1H, NH).![[double bond, length as m-dash]](https://www.rsc.org/images/entities/char_e001.gif) O)), 1.77 (m, 2H, C*HCH2CH2), 1.96 (m, 2H, C*HCH2CH2C(
O)), 1.77 (m, 2H, C*HCH2CH2), 1.96 (m, 2H, C*HCH2CH2C(![[double bond, length as m-dash]](https://www.rsc.org/images/entities/char_e001.gif) O)), 2.9–3.1 (m, 6H, CH2NHC(
O)), 2.9–3.1 (m, 6H, CH2NHC(![[double bond, length as m-dash]](https://www.rsc.org/images/entities/char_e001.gif) O), NCH2CH2C(
O), NCH2CH2C(![[double bond, length as m-dash]](https://www.rsc.org/images/entities/char_e001.gif) O)), 4.14 (q, 1H, C*H), 4.44 (s, 3H, CH3N+(CH)CH), 4.89 (t, 2H, C(
O)), 4.14 (q, 1H, C*H), 4.44 (s, 3H, CH3N+(CH)CH), 4.89 (t, 2H, C(![[double bond, length as m-dash]](https://www.rsc.org/images/entities/char_e001.gif) O)CH2CH2N+(CH)CH), 7.72 (t, 1H, CH2C(
O)CH2CH2N+(CH)CH), 7.72 (t, 1H, CH2C(![[double bond, length as m-dash]](https://www.rsc.org/images/entities/char_e001.gif) O)NHCH2), 7.89 (t, 1H, CHC(
O)NHCH2), 7.89 (t, 1H, CHC(![[double bond, length as m-dash]](https://www.rsc.org/images/entities/char_e001.gif) O)NHCH2), 8.28 (d, 1H, C(
O)NHCH2), 8.28 (d, 1H, C(![[double bond, length as m-dash]](https://www.rsc.org/images/entities/char_e001.gif) O)NHC*H), 8.75 (dd, 4H, CH3N+(CH)CHCHC, CH2N+(CH)CHCHC), 9.28 (d, 2H, CH3N+CH), 9.36 (d, 2H, CH2N+CH).
O)NHC*H), 8.75 (dd, 4H, CH3N+(CH)CHCHC, CH2N+(CH)CHCHC), 9.28 (d, 2H, CH3N+CH), 9.36 (d, 2H, CH2N+CH).Author contributions
All authors contributed to this study. Y. K.: conceptualization, data curation, formal analysis, funding acquisition, investigation, methodology, project administration, resources, validation, visualization, writing – original draft, writing – review, and editing. M. I.: data curation, formal analysis, investigation. T. I.: data curation, formal analysis, investigation. M. T.: resources, validation, writing – review, and editing. H. I.: funding acquisition, validation, writing – review, and editing N. R.: funding acquisition, validation, writing – review, and editing. T. M.: resources, validation, writing – review, and editing.Conflicts of interest
There are no conflicts to declare.Acknowledgements
Y. K. is grateful for support from the IROAST, Kumamoto University, and JSPS KAKENHI Grant Numbers JP 16KK0114, JP 17K04973 and JP 20K05248.References
- J. F. Heanue, M. C. Bashaw and L. Hesselink, Science, 1994, 265, 749–752 CrossRef CAS PubMed.
- D. Psaltis and G. W. Burr, Computer, 1998, 31, 52–60 Search PubMed.
- F. Zinna, M. Pasini, F. Galeotti, C. Botta, L. Di Bari and U. Giovanella, Adv. Funct. Mater., 2017, 27, 1603719 CrossRef.
- Y. Kitagawa, S. Wada, M. D. J. Islam, K. Saita, M. Gon, K. Fushimi, K. Tanaka, S. Maeda and Y. Hasegawa, Commun. Chem., 2020, 3, 119 CrossRef CAS.
- C. D. Stanciu, F. Hansteen, A. V. Kimel, A. Kirilyuk, A. Tsukamoto, A. Itoh and T. Rasing, Phys. Rev. Lett., 2007, 99, 047601 CrossRef CAS PubMed.
- Y. Yang, R. C. da Costa, M. J. Fuchter and A. J. Campbell, Nat. Photonics, 2013, 7, 634–638 CrossRef CAS.
- W. Li, Z. J. Coppens, L. V. Besteiro, W. Wang, A. O. Govorov and J. Valentine, Nat. Commun., 2015, 6, 8379 CrossRef CAS PubMed.
- B. L. Feringa, R. A. van Delden, N. Koumura and E. M. Geertsema, Chem. Rev., 2000, 100, 1789–1816 CrossRef CAS PubMed.
- L. Groenendaal, F. Jonas, D. Freitag, H. Pielartzik and J. R. Reynolds, Adv. Mater., 2000, 12, 481–494 CrossRef CAS.
- M. M. Richter, Chem. Rev., 2004, 104, 3003–3036 CrossRef CAS PubMed.
- P. M. Beaujuge and J. R. Reynolds, Chem. Rev., 2010, 110, 268–320 CrossRef CAS PubMed.
- H. C. Moon, C.-H. Kim, T. P. Lodge and C. D. Frisbie, ACS Appl. Mater. Interfaces, 2016, 8, 6252–6260 CrossRef CAS PubMed.
- J. W. Canary, S. Mortezaei and J. Liang, Coord. Chem. Rev., 2010, 254, 2249–2266 CrossRef CAS.
- H. Isla and J. Crassous, C. R. Chim., 2016, 19, 39–49 CrossRef CAS.
- K. Karoń, M. Łapkowski and J. C. Dobrowolski, Spectrochim. Acta A, 2021, 250, 119349 CrossRef PubMed.
- J. S. E. M. Svensson and C. G. Granqvist, Sol. Energy Mater., 1984, 11, 29–34 CrossRef CAS.
- R. D. Rauh, Electrochimi. Acta, 1999, 44, 3165–3176 CrossRef CAS.
- H. C. Moon, T. P. Lodge and C. D. Frisbie, J. Am. Chem. Soc., 2014, 136, 3705–3712 CrossRef CAS PubMed.
- M. Casini, Renewable Energy, 2018, 119, 923–934 CrossRef.
- J. Deng, N. Song, Q. Zhou and Z. Su, Org. Lett., 2007, 9, 5393–5396 CrossRef CAS PubMed.
- J. Deng, C. Zhou, C. Chen, N. Song and Z. Su, Macromolecules, 2008, 41, 7805–7811 CrossRef CAS.
- J. W. Canary, Chem. Soc. Rev., 2009, 38, 747–756 RSC.
- L. Zhang, H.-X. Wang, S. Li and M. Liu, Chem. Soc. Rev., 2020, 49, 9095–9120 RSC.
- H. Wynberg, E. W. Meijer, J. C. Hummelen, H. P. J. M. Dekkers, P. H. Schippers and A. D. Carlson, Nature, 1980, 286, 641–642 CrossRef CAS.
- T.-H. Chiou, S. Kleinlogel, T. Cronin, R. Caldwell, B. Loeffler, A. Siddiqi, A. Goldizen and J. Marshall, Curr. Biol., 2008, 18, 429–434 CrossRef CAS PubMed.
- V. Sharma, M. Crne, J. O. Park and M. Srinivasarao, Science, 2009, 325, 449 CrossRef CAS PubMed.
- L. Pauling, R. B. Corey and H. R. Branson, Proc. Natl. Acad. Sci. U. S. A., 1951, 37, 205 CrossRef CAS PubMed.
- J. D. Watson and F. H. C. Crick, Nature, 1953, 171, 737–738 CrossRef CAS PubMed.
- P. M. S. Monk, The viologens : physicochemical properties, synthesis and applications of the salts of 4,4'-bipyridine, Wiley, 1998 Search PubMed.
- T. Sagara and H. Tahara, Chem. Rec., 2021, 21, 2375–2388 CrossRef CAS PubMed.
- K. Yamada, H. Ihara, T. Ide, T. Fukumoto and C. Hirayama, Chem. Lett., 1984, 13, 1713–1716 CrossRef.
- H. Ihara, M. Takafuji and Y. Kuwahara, Polym. J., 2016, 48, 843–853 CrossRef CAS.
- H. Ihara, M. Takafuji, Y. Kuwahara, Y. Okazaki, N. Ryu, T. Sagawa and R. Oda, in Molecular Technology, ed. H. Yamamoto and T. Kato, WILEY-VCH, 2018, vol. 4, ch. 11, pp. 297–337 Search PubMed.
- H. Jintoku, M.-T. Kao, A. Del Guerzo, Y. Yoshigashima, T. Masunaga, M. Takafuji and H. Ihara, J. Mater. Chem. C, 2015, 3, 5970–5975 RSC.
- T. Goto, Y. Okazaki, M. Ueki, Y. Kuwahara, M. Takafuji, R. Oda and H. Ihara, Angew. Chem., Int. Ed., 2017, 56, 2989–2993 CrossRef CAS PubMed.
- K. Yoshida, Y. Kuwahara, K. Miyamoto, S. Nakashima, H. Jintoku, M. Takafuji and H. Ihara, Chem. Commun., 2017, 53, 5044–5047 RSC.
- V. Gopal, T. K. Prasad, N. M. Rao, M. Takafuji, M. M. Rahman and H. Ihara, Bioconjugate Chem., 2006, 17, 1530–1536 CrossRef CAS PubMed.
- Y. Kuwahara, T. Akiyama and S. Yamada, Langmuir, 2001, 17, 5714–5716 CrossRef CAS.
- H. Ihara, M. Takafuji and T. Sakurai, in Encyclopedia of Nanoscience & Nanotechnology, ed. H. S. Nalwa, American Scientific Publishers, California, 2004, vol. 9, pp. 473–495 Search PubMed.
- A. Nakahara and J. H. Wang, J. Phys. Chem., 1963, 67, 496–498 CrossRef CAS.
- H. Satoh, K. Tokuda and T. Ohsaka, Chem. Lett., 1996, 25, 51–52 CrossRef.
- M. Simonyi, Z. Bikádi, F. Zsila and J. Deli, Chirality, 2003, 15, 680–698 CrossRef CAS PubMed.
- Y. Kira, Y. Okazaki, T. Sawada, M. Takafuji and H. Ihara, Amino Acids, 2010, 39, 587–597 CrossRef CAS PubMed.
- H. P. J. M. Dekkers, in Circular Dichroism: Principles and Applications, ed. N. Berova, K. Nakanishi and R. W. Woody, WILEY-VCH, Inc, 2nd edn, 2000, ch. 7, pp. 185–216 Search PubMed.
- T. Kunitake, A. Tsuge and N. Nakashima, Chem. Lett., 1984, 1783–1786, DOI:10.1246/cl.1984.1783.
- E. M. Kosower and J. L. Cotter, J. Am. Chem. Soc., 1964, 86, 5524–5527 CrossRef CAS.
- S. Yamada, Y. Koide and T. Matsuo, J. Electroanal. Chem., 1997, 426, 23–26 CrossRef CAS.
Footnote |
| † Electronic supplementary information (ESI) available: Details regarding DSC thermal analysis, and NMR and EPR spectroscopies. See DOI: 10.1039/d1ra08984f |
| This journal is © The Royal Society of Chemistry 2022 |

