 Open Access Article
Microstructure and corrosion behavior of Al95−xNixY5 (x = 7,10) glassy ribbons
X. N. Wang†
ab,
Y. Feng†b,
H. Z. Liub,
H. Zhangb,
Z. C. Yanb and
Y. W. Bai *b
*b
aSchool of Chemistry and Chemical Engineering, Shandong University, Jinan 250100, China. E-mail: 975333453@qq.com
bKey Laboratory for Liquid-Solid Structural Evolution and Processing of Materials, Ministry of Education, Shandong University, Jinan 250061, China. E-mail: 805930717@qq.com; ze193288876@qq.com; zhanghao_0611@163.com; 940930045@qq.com; bai_yanwen@163.com
First published on 9th March 2022
Abstract
In this work, we correlate the microstructure and passivation of the Al95−xNixY5 lightweight glassy ribbons (x = 7 and 10) using various techniques. The overdosed Ni (x = 10) can increase the melt viscosity and then deteriorate its glass-forming ability (GFA), ribbon formability, and Y-depleted extra layer formation. Consequently, the overdosed Ni weakens the passivation stability and corrosion resistance of the as-spun ribbon. The key role of the overdosed Ni can form a strong network and crystalline grain boundary in the amorphous matrix, which can transport Y and O to participate in the oxidation. These results can help us explore a valuable method for designing new Al-based metallic glasses.
1. Introduction
Al-based metallic glasses have attracted a lot of attention due to their light weight and corrosion resistance.1,2 The thin passive films can effectively prevent the chemical attack of alloys in corrosive environments; their stability is related to the interplay between the structure and chemistry of the components of the alloy. In the classical Al-TM-RE metallic glasses, TM presents the transition metals such as Ni, Co, and Fe, and RE presents Y, La, Nd, Ce, etc., which are important for the glass-forming ability (GFA), plasticity and specific strength of the system.3–5 The homogeneity of the amorphous phase helps construct the ultrathin passive film on the surface of the alloy.As marginal metallic glasses, crystalline precipitates are often encountered in Al-based metallic glasses.6 The intermetallic phase and solid solution phase can exist in the as-spun and annealed Al-based glassy samples and have different effects on their corrosion behavior. Normally, the susceptibility of nanocrystals to corrosion is in the order α-Al < Al-TM intermetallics < Al-RE intermetallics in the Al–Ni–Ce glassy system. These details are valuable for further exploration and the clarification strategy is proposed to unveil the role of crystalline precipitates.
The passivation and pitting play very important roles in the corrosion behavior of the alloys.7,8 Nowadays, XPS is a good method for investigating the film at dozens of nanometers beneath the outermost surface of the metallic samples.9 Hence, it is possible to characterize the passive film of Al-based glasses by etching XPS analysis.
In this work, Al95−xNixY5 glassy ribbons (x = 7 and 10) are prepared using the melt-spinning method. Their microstructure and corrosion behaviors were measured by XRD, DSC, SEM, polarization, EIS and etching XPS methods. Herein, we focus on the extra film in the ribbon, and we tried to devise a strategy for improving the corrosion resistance of Al-based glassy alloys.
2. Experimental
2.1. Specimen preparation and structure characterization
The Al95−xNixY5 ingots of x = 7 and 10 were prepared by the high-frequency induction melting of pure Al, Ni, and Y metals (purity > 99.5 wt%) in the air. The ribbons were prepared by a single-roller melt-spinning equipment in the air at the circumferential speed (Sc) of 36.6 m s−1, and the length, width and thickness were about 5–30 cm, 2–4 mm, and 20–40 μm, respectively. In our earlier work, using the LECO oxygen-nitrogen-hydrogen determinator (TCH600), the oxygen content of the as-spun Al84Ni10Gd6 ribbon with Rc = 29.3 m s−1 was 0.022 ± 0.005 at%.8 The thicknesses of ribbons with x = 7 and 10 were 20 ± 5 and 40 ± 10 μm.An X-ray diffractometer (XRD, Beijing Purkinje General Instrument Co. Ltd, China) with Cu Kα radiation was used to characterize the structure. The cross-section fracture morphology of the as-spun ribbons after tearing was examined by scanning electron microscopy (SEM, HITACHI SU-70). The thermal analysis of the samples was performed using differential scanning calorimetry (DSC) (Netzsch DSC 404) under an Ar atmosphere from room temperature to 700 °C with a heating/cooling rate of 10 K min−1.
2.2. Electrochemical tests
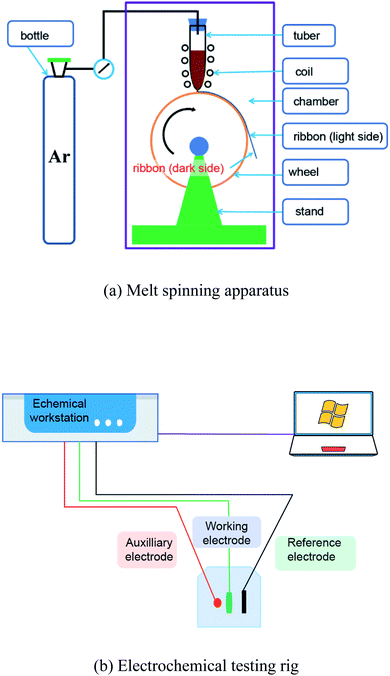
Electrochemical tests were performed on a CHI660E electrochemical workstation using a conventional three-electrode electrochemical cell system in NaCl solution at room temperature. The solution was made using ultra-pure water and analytical reagents. The electrolyte was made in a 0.6 M NaCl solution. The ribbon acted as a working electrode, the testing area of which had a length of 2.5–5.0 mm and a width of 0.8–1.6 mm. When testing the light side, the dark side was covered with epoxy resin. When testing the dark side, the light side was covered with epoxy resin. The platinum plate was used as the auxiliary electrode and the saturated calomel electrode (SCE) as the reference electrode. After each electrochemical test, the working area of the ribbon was measured.Before the potentiodynamic polarization was measured, the ribbons were stabilized by a 10 min open circuit potential (OCP) treatment. The potential range of the potentiodynamic polarization curve was from −1.2 to 0 VSCE, and the scanning rate was 1 mV s−1. Before the electrochemical impedance spectra (EIS) were obtained, the ribbon was pretreated for an OCP until the potential fluctuation was less than 5 mV within 10 min. The scanning frequency range was set as 10−2 to 105 Hz and the amplitude was 10 mV. The schematic graphs of the melting apparatus and electrochemical rig are shown in Fig. 1.
2.3. Passivation surface analysis
The composition and valence states of the passivation film of ribbons were analyzed by X-ray photoelectron spectroscopy (XPS, Thermo Fisher Escalab Xi+, USA) with monochromatized Al Kα radiation (hv = 1486.6 eV) at ambient temperature. The depth information of the surface elements was measured by Ar+ etching (2 kV, high current, 4 mm2 raster, 30 s), and the etching rate was 1 nm s−1. The proportions of different valence states of the same element were obtained by CasaXPS software (Casa Software Ltd., UK) for peak fitting. The C 1s peak at 284.6 eV was used to calibrate the binding energy (EBE). The content c of Al, Ni, Y, and O elements was estimated by dividing the measured peak area by the relative atomic sensitivity factor.3. Results
3.1. XRD and microstructure investigation
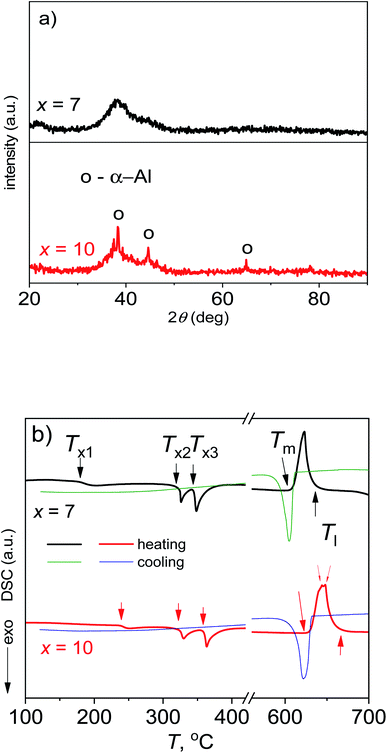
Fig. 2 shows the XRD patterns and DSC curves of Al95−xNixY5 ribbons (x = 7 and 10). For the sample with x = 7, its XRD pattern has a diffusive peak at 38°, representing a fully amorphous characteristic (Fig. 2a). A shoulder peak at 45° beside the main amorphous peak at 38° indicates the strong Al–Ni and Al-RE bonds in the amorphous matrix according to ref. 8 and 10. The ribbon length is 20 cm and shows good ribbon formability (upper-right inset in Fig. 2a). For the sample with x = 10, its XRD pattern has crystalline peaks identified as the α-Al phase, being embedded in the amorphous diffusive peak and indicating a crystallite/amorphous matrix structure (Fig. 2a). Its length is about 5 cm (bottom-right inset in Fig. 2a), being shorter than x = 7 and showing lower ribbon formability.In the DSC heating curve of the ribbon with x = 7, there are three exothermic peaks for crystallization located in the range of 150 to 400 °C, and one endothermic peak for melting at 620 °C; its cooling curve has one exothermic peak for solidification at 605 °C (Fig. 2b). Besides three similar peaks for crystallization and one similar peak for solidification, the alloy with x = 10 has two overlapped peaks for the melting at about 650 °C, indicating that it is farther from the eutectic point than x = 7 and shows a worse glass-forming ability (GFA) according to ref. 11. Generally, the first exothermic peak at Tx1 on the DSC curves of Al-TM-RE metallic glasses is associated with the formation of fcc-Al nanocrystals and the second/third one at Tx2/Tx3 is associated with the formation of intermetallic compound phases in the manner of eutectic crystallization.12 The Tx1 of the ribbon with x = 7 is much lower as compared to x = 10, suggesting that its stability is lower than the residual amorphous matrix with x = 10. In other words, the Tx1 of the former scales the alloy's global stability and that of the latter indicates the alloy's partial stability.
The onset temperatures (Tx1, Tx2 and Tx3) and enthalpies (ΔH1, ΔH2 and ΔH3) for the crystallization deduced from the three exothermic peaks, as well as the melting and solidification enthalpies (ΔHm and ΔHs), can give more structural information about the two ribbons and are listed in Table 1. For a metallic glass, a higher ΔHx means a higher disordering degree/amorphous fraction of the glass.13,14 It is accepted that the amorphous fraction with x = 7 is higher, and is consistent with the XRD patterns (Fig. 2a). Moreover, the Tm of the alloy with x = 7 is lower than x = 10, confirming that it is much closer to the eutectic point and shows a higher GFA. The melting enthalpies ΔHm of two alloys are close to their solidification enthalpies ΔHs, indicating that the measured enthalpies under the present cooling and heating rates are not far from the equilibrium values. Here, the ΔHm with x = 7 is higher than x = 10, suggesting that the disordered degree of the melt is higher than that of x = 10, and confirming that the melt with x = 7 has a higher GFA.
| x | Tx1, °C | Tx2, °C | Tx3, °C | Tm, °C | Tl, °C | ΔH1, J g−1 | ΔH2, J g−1 | ΔH3, J g−1 | ΔHm, J g−1 | ΔHs, J g−1 | ΔH′1, J g−1 | ΔH′2, J g−1 | ΔH′3, J g−1 |
|---|---|---|---|---|---|---|---|---|---|---|---|---|---|
| 7 | 179 | 318 | 344 | 618 | 663 | 9.1 | 11.6 | 19.3 | 57.0 | 56.0 | 0.15 | 0.20 | 0.33 |
| 10 | 238 | 322 | 358 | 623 | 668 | 4.2 | 10.3 | 14.0 | 47.4 | 46.7 | 0.08 | 0.21 | 0.29 |
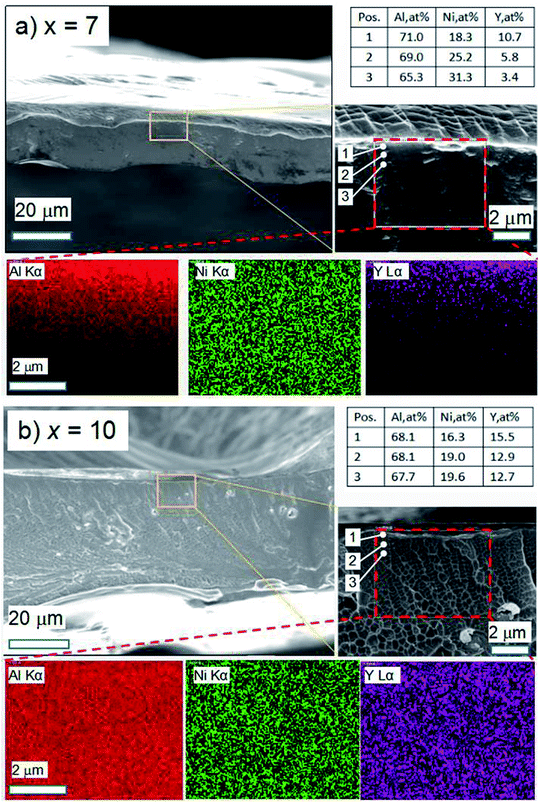
The cross-section fracture morphology and EDS analysis of the as-spun Al95−xNixY5 ribbons (x = 7 and 10) after tearing are shown in Fig. 3. The ribbon with x = 7 has a thickness of 20 ± 5 μm (Fig. 3a). In the magnification image (in the middle-right inset in Fig. 3a), there exist shear band intersections in the upper region of the cross-section, showing the good ductility of the ribbon, which is consistent with its high ribbon length (upper-right inset in Fig. 2a). The EDS values of points 1, 2 and 3, the distance between which is about 0.8 μm, show that the contents cAl and cY decrease and cNi increase with increasing depth (upper-right inset table in Fig. 3a). In the EDS mapping images (inside the dashed square in the middle-right inset in Fig. 3a), the Al Kα, Ni Kα and Y Lα are distributed along the depth, and the concentrations of Al and Y elements are steeper as compared to Ni Kα (bottom insets in Fig. 3a).
The ribbon with x = 10 has a thickness of 40 ± 10 μm (Fig. 3b). The vein-like patterns on the fracture surface show the amorphous character and no apparent intersected shear band in the cross-section (middle-right inset in Fig. 3b). According to ref. 15, the glass's fracture vein-like patterns can be described by the ratio of crack growth velocity against Rayleigh wave velocity (v/VR). Generally, different fracture patterns correspond to different v/VR ratios. Moreover, v/VR has a positive linear correlation with the modules EY. According to the argument by Thompson et al.,16,17 the toughness KIc of one glass is dependent on the fractal dimension change ΔD of the fracture morphology:
 | (1) |
3.2. Electrochemical measurement
Corrosion behavior is important for amorphous alloys in many applications and can be investigated by Tafel polarization and electrochemical impedance spectroscopy (EIS) tests.18,19 The open-circuit potential (OCP) and polarization curves on the light and dark sides of the as-spun Al95−xNixY5 ribbons (x = 7 and 10) in 3.5 wt% NaCl solution are shown in Fig. 4. The insets show the surface morphology of the light and dark sides of the ribbon, with grooves and air pockets existing on the light and dark sides, respectively. On the light side, the OCP curve with x = 7 is smooth and converges at −0.61 VSCE, while that with x = 10 is coarse and finally stays at −0.73 VSCE (Fig. 4a). The Tafel curve with x = 7 has a long passive range ending at Epit of −0.34 VSCE. The ribbon with x = 10 has an Epit of −0.64 VSCE, being more negative than x = 7 and having a much shorter passive zone (Fig. 4b).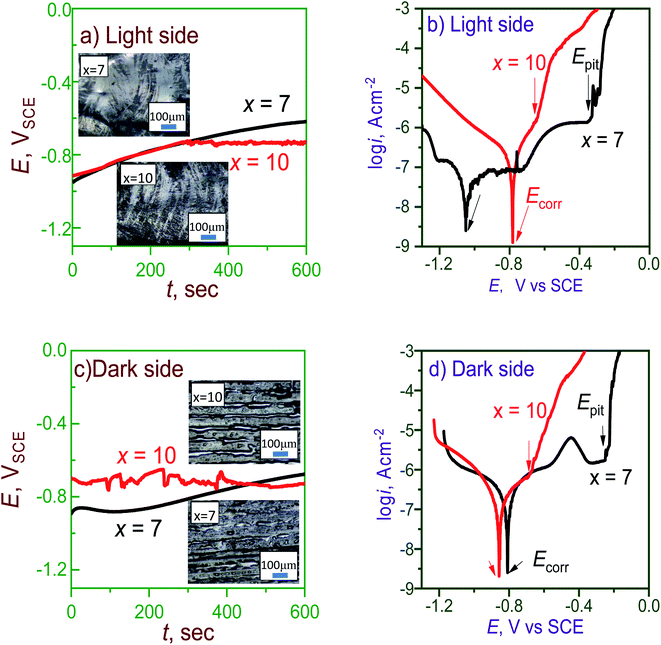 | ||
| Fig. 4 OCP and polarization curves of (a, b) light and (c, d) dark sides of Al95−xNixY5 ribbons with x = 7 and 10. Insets in (a) and (c) show the surface morphologies of light and dark sides. | ||
On the dark side, the OCP of the ribbon with x = 7 is also smoother than x = 10, and the final OCPs with 7 and 10 are −0.67 and −0.72 VSCE, respectively (Fig. 4c). The Tafel curve of the ribbon with x = 7 has a longer passive zone than x = 10, confirming that it has stronger passivation and higher corrosion resistance than x = 10 (Fig. 4d). Since larger grooves and air pockets exist on the light and dark sides of the ribbon with x = 7, its Tafel curve has a lower reproducibility than x = 10. The current curves of the sample with x = 7 on both sides are truly complicated, having jumps or bumps in the passive stage as compared with x = 10. This phenomenon indicates that the passive film with x = 7 has self-repairing behavior. The corrosion potential (Ecorr) and corrosion current densities (icorr) are summarized in Table 2. The icorr of both sides of the ribbon with x = 7 is lower than x = 10, indicating the higher passive stability of the ribbon with x = 7. These polarization tests show that the overdosed Ni (x = 10) can weaken the corrosion resistance of the Al-based glasses.
| x | Side | OCP, VSCE | Ecorr, VSCE | Epit, VSCE | log![[thin space (1/6-em)]](https://www.rsc.org/images/entities/char_2009.gif) icorr, A cm−2 icorr, A cm−2 |
|---|---|---|---|---|---|
| 7 | Light | −0.61 | −1.04 | −0.34 | −7.4 |
| Dark | −0.67 | −0.80 | −0.24 | −6.9 | |
| Average | −0.64 | −0.92 | −0.29 | −7.2 | |
| 10 | Light | −0.73 | −0.78 | −0.64 | −6.7 |
| Dark | −0.72 | −0.85 | −0.68 | −6.6 | |
| Average | −0.56 | −0.81 | −0.66 | −6.6 |
Fig. 5 shows the EIS data such as the Nyquist and Bode curves of the light and dark sides of the Al95−xNixY5 ribbons (x = 7 and 10). The diameter of Nyquist semicircles became smaller, indicating that the electron transfer capacity of the surface increased.9 On the light side, the Nyquist curve with x = 7 has a shape of a semicircle, which can be fitted by the equivalent circuit R(Q(LR)Q) (Fig. 5a). In the Bode plot (Fig. 5b), the phase angle curve has a kink at 4 s−1 and can be decomposed into two peaks, indicating that the ribbon has two characteristic frequencies during the EIS test. In the case of the ribbon with x = 10, its Nyquist curve also has a semicircular shape with a much smaller diameter than x = 7, which can be fitted by a simple equivalent circuit R(Q(LR)) (Fig. 5c). In the Bode plot, the phase angle curve only has one peak and one characteristic frequency at about 4 s−1 (Fig. 5d). The EIS results can be explained by the existence of the extra film in the ribbon with x = 7.
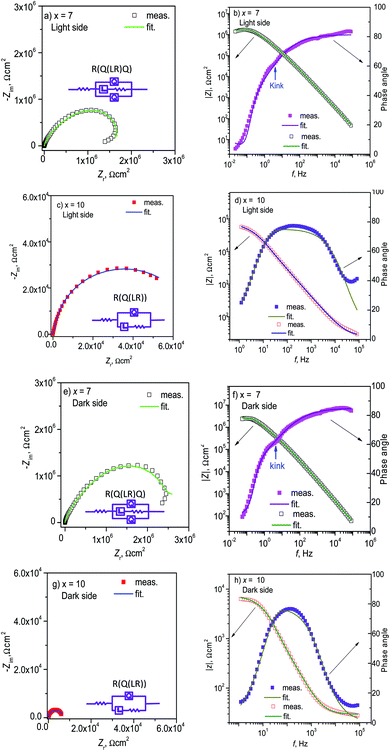 | ||
| Fig. 5 Nyquist and Bode graphs of the (a–d) light and (e–h) dark sides of Al95−xNixY5 ribbons with x = 7 and 10. | ||
On the dark side of the ribbons, the EIS results show their similar changing tendencies with increasing x. The Nyquist plot of the ribbon with x = 7 is a semicircle and can be fitted by R(Q(LR)Q) (Fig. 5e). Its phase angle curve also has two overlapped peaks and two characteristic frequencies (Fig. 5f). Meanwhile, the ribbon with x = 10 has a semicircular Nyquist plot with a smaller diameter than x = 7 and can be fitted by R(Q(LR)) (Fig. 5g). Its phase angle curve also has a single peak and one characteristic frequency (Fig. 5h). The fitted parameters are listed in Table 3. The film resistance Rf of the ribbon with x = 7 is much higher than x = 10 and agrees well with their polarization curves (Fig. 4), which can be ascribed to the extra passive film in the ribbon with x = 7.
| x | Side | Rs, Ω cm2 | Q−Y0, Ω−1 cm−2 sn | n | L, H cm−2 | Rf, Ω cm2 | Q−Y0, Ω−1 cm−2 sn | n |
|---|---|---|---|---|---|---|---|---|
| 7 | Light | 1.4 × 10⁻⁵ | 1.3 × 10⁻⁷ | 0.90 | 4.3 × 10⁶ | 2.5 × 10⁶ | 5.3 × 10⁻⁷ | 0.36 |
| Dark | 0.24 | 5.9 × 10⁻⁸ | 0.94 | 3.5 | 4.2 × 10⁶ | 3.1 × 10⁻⁷ | 0.46 | |
| Average | 0.12 | 9.4 × 10⁻⁸ | 0.92 | 2.1 × 10⁶ | 3.3 × 10⁶ | 4.2 × 10⁻⁷ | 0.41 | |
| 10 | Light | 24.6 | 1.5 × 10⁻⁶ | 0.83 | 8.6 × 10² | 7.4 × 10⁴ | — | — |
| Dark | 29.4 | 6.4 × 10⁻⁶ | 0.87 | 42.3 | 7173 | — | — | |
| Average | 27.5 | 3.9 × 10⁻⁶ | 0.85 | 4.3 × 10⁶ | 4.1 × 10⁴ | — | — |
3.3. XPS etching analysis
To further understand the passivation behavior of Al-based ribbons in NaCl solution, XPS analysis was conducted on the surfaces of the as-spun ribbons, and Al 2p, Ni 2p, Y 3d, C 1s and O 1s spectra were obtained. The global XPS spectra, with different etching depths te of the ribbons, are shown in Fig. 6 together with the element fractions. As te rises, the Ni 2p and Al 2p peaks with x = 7 and 10 increase, but C 1s decreases drastically (Fig. 6a and b). For the ribbon with x = 7, its C content is 40 at% at te = 0 and decreases to 5 at% as te is 3 nm or deeper (Fig. 6c). Its Al content tends to increase with te and can be divided into I, II and III regions for the outer (te = 0), middle (te = 3 and 6 nm) and inner (te = 9 nm or deeper) parts of the ribbon, respectively. For the ribbon with x = 10, its C content also decreases with increasing te, having a milder slope than x = 7, and its Al content increases simultaneously and can be divided into I and II regions for the outer (te = 0) and inner (te = 3 nm or deeper) parts of the ribbon, respectively (Fig. 6d). The element distribution in the measured range of the ribbon with x = 10 was more homogeneous as compared to x = 7. Meanwhile, the O content with x = 10 was higher than x = 7 at the measured te, indicating that the oxidation degree with x = 10 is higher than x = 7.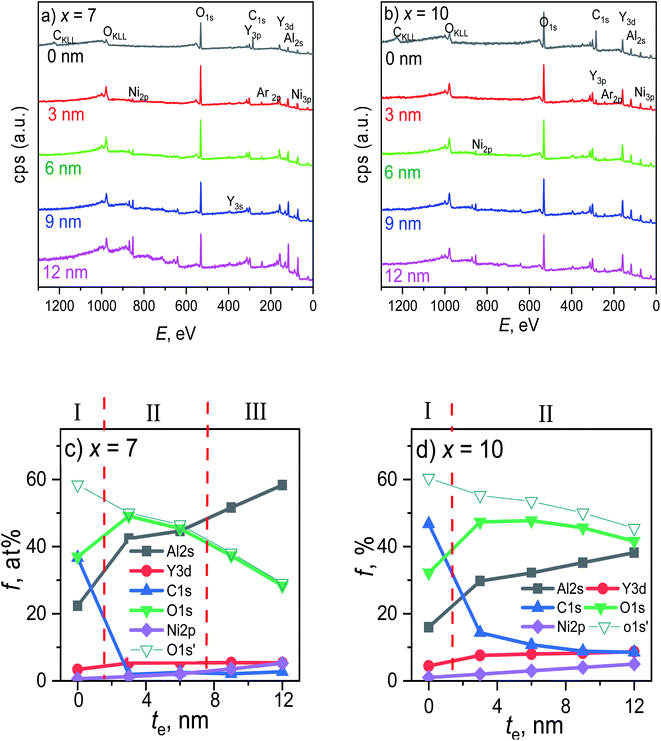 | ||
| Fig. 6 Etching depth-dependent (a, b) global XPS spectra and (c, d) element fraction of Al95−xNixY5 ribbons (x = 7 and 10). Open triangles denote the O 1s fraction without countering C 1s. | ||
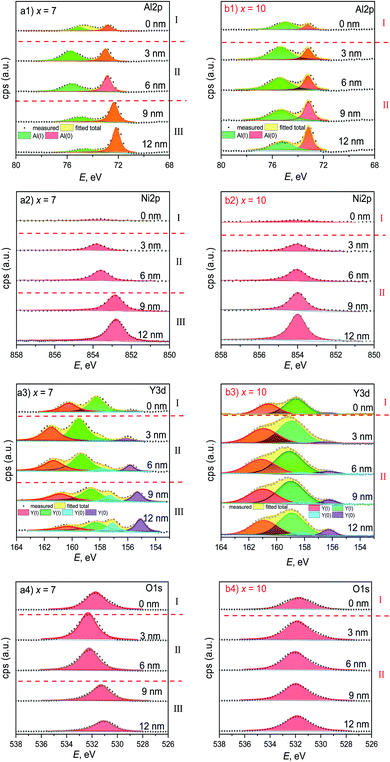
Fig. 7 shows the fine XPS spectra of the ribbons with x = 7 and 10. Al 2p spectra have two peaks in the range of E = 80–60 eV, denoted by Al0 and AlI at low E and high E, respectively (Fig. 7a(1) and b(1)). Interestingly, the AlI peak with x = 7 at te = 3 and 6 nm is much higher than that at other te. According to the Al 2p peak positions and areas, the sample with x = 7 can be divided into I, II, and III regions, corresponding to the Al content curve (Fig. 6c); meanwhile, the sample with x = 10 can be divided into I and II regions, also corresponding to its Al content curve (Fig. 6d). At te = 0, the Ni 2p peaks with x = 7 and 10 are much lower than the peak at other te (Fig. 7a(2) and b(2)), similar to the Al–Zr–Ni–Fe–Y glassy ribbon,20 indicating that Ni oxide is very sparse on the ribbon surface. The Y 3d spectra are located at the range of E = 164–153 eV and have 4 peaks, corresponding to Y0 3d3/2, Y0 3d5/2, YI 3d3/2, and YI 3d5/2 (Fig. 7a(3) and b(3)). In the data analysis, we only calculated the Y0 3d5/2 and YI 3d5/2 peaks. Similarly, the Y 3d spectra with x = 7 and 10 can be divided into 3 and 2 regions, respectively. In the range of E = 538 to 526 eV, the O 1s spectra of the ribbons with x = 7 and 10 appear in a single Gaussian peak shape (Fig. 7a(4) and b(4)), which can also be divided into 3 and 2 regions along the depth direction, respectively.
To further outline the oxidation situation of the ribbons, the te-dependent parameters from the fine XPS spectra of four elements like peak positions and areas are given in Fig. 8. The fluctuations of the Al0 and AlI peak positions of the ribbon with x = 7 are more drastic as compared to x = 10 (Fig. 8a), which correspond to the EDS results on the ribbon cross-sections (Fig. 3). The total Al 2p peak area of the ribbon with x = 7 is higher than x = 10 at each depth te and their total Al 2p peak areas can be divided into 3 and 2 regions (Fig. 8b); the Al0 peak area fraction fAl0 of the ribbon with x = 7 in region III is higher than 50%, indicating that the oxidation in region III is much less than that in regions I and II. Similarly, the Ni 2p peak position with x = 7 has a larger fluctuation than x = 10 (Fig. 8c). The Ni 2p peak area with x = 7 and 10 can also be divided into 3 and 2 regions, respectively (Fig. 8d). Interestingly, the Ni peak area with x = 7, i.e. cNi = 7 at%, is higher than x = 10 (cNi = 10 at%) at te = 3–12 nm, due to the lower oxygen content.
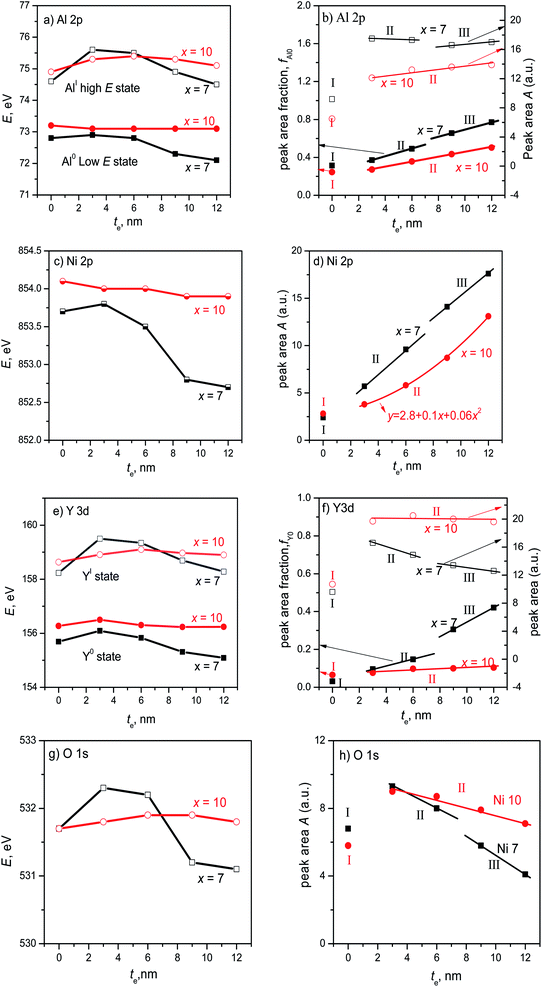 | ||
| Fig. 8 The position and fraction of the component atom peaks of Al95−xNixY5 ribbons with x = 7 and 10 (a, b) Al 2p, (c, d) Ni 2p, (e, f) Y 3d, (g, h) O 1s. | ||
For the 5/2 obit, the Y 3d spectra have two separated peaks with low and high energy states, denoted by Y0 and YI (Fig. 8e), respectively, similar to the Al 2p spectra. The fluctuation of the Y0 and YI positions with x = 7 is also larger than x = 7, being consistent with the EDS analysis in the ribbon cross-section (Fig. 3). The peak areas of the ribbons with x = 7 and 10 can be divided into 3 and 2 regions, respectively, and the total peak area of the former is higher as compared to the latter at each te (Fig. 8f). Here, the Y0 fraction fY0 in region III is much higher than regions I and II, confirming a lower oxidation degree in region III according to ref. 21. The fluctuation of the O 1s peak positions with x = 7 is also larger than x = 10 (Fig. 8g). Also, the O 1s peak areas with x = 7 and 10 can be divided into similar regions to Al 2p, Ni 2p, and Y 3d (Fig. 8h). Moreover, the O 1s areas with x = 7 in region III are much lower than the other regions to keep the mass conservation and confirm the involvement of a lower oxidation degree. Based on EDS and XPS results, the extra film is rich in Al and Ni and depleted in Y. In short, the ribbon with x = 7 has a higher oxidation/corrosion resistance than x = 10 due to the Y-depleted extra film, which can be destroyed by the overdosed Ni (x = 10).
4. Discussion
In the earlier work, Ni is a component element for forming the network by connecting the clusters in AlNiRE glasses, which can increase the melt viscosity and stress polarization.8,22 Here, it is understood that the ribbon thickness with x = 10 is higher than x = 7. In Pd40Cu30Ni10P20 glassy melts, Ni can diffuse in an up-hill manner.23 Generally, the higher viscosity a melt has, the lower the diffusion coefficient.24,25 Thus, the overdosed Ni hinders its up-hill diffusion in the quenching process and causes the even distribution of the elements (Fig. 3). Meanwhile, the network in the melt also plays a key role in the glass-forming process of the Ni–Nb metallic glassy alloys26 and the overly strong network can deteriorate the GFA of the GdDyErCoAl high-entropy bulk metallic glasses.27 Hence, it is understood that the alloy with x = 7 has a higher GFA than x = 10. It is known that the amorphous alloy has a higher corrosion resistance than the crystalline counterpart.1 His point is also confirmed in the present work (Fig. 4 and 5).Based on the XPS spectra, the ribbon with x = 7 has a Y-depleted extra layer beneath the outer film, i.e., region II in the XPS etching test, while the ribbon with x = 10 does not (Fig. 6–8), which is schematically shown in Fig. 9. Moreover, the equivalent circuits of ribbons with x = 7 and 10 are R(Q(LR)Q) and R(Q(LR)), respectively (Fig. 5). Thus, the equivalent circuits confirm the Y-depleted extra film in the ribbon with x = 7 and are attached in Fig. 9. Under the electrochemical conditions, the Y element in the ribbon with x = 10 can be transported along the network/grain boundary to the surface and participate in the oxidation, and hence the ribbon with x = 10 shows a higher Y content in the EDS and XPS tests on the surface region and a stronger oxidation degree (Fig. 3, 6d and 8f). Meanwhile, the Y-depleted extra film in the ribbon with x = 7 can hinder the transportation of Y atoms in the inner region and its oxidation, which then improves the stability of the passive film (Fig. 4 and 5).
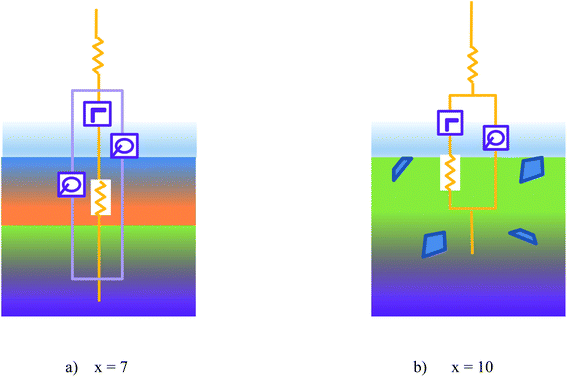 | ||
| Fig. 9 Schematic diagram of the passive film of Al95−xNixY5 glassy ribbons with (a) x = 7 and (b) x = 10. | ||
Besides the uphill diffusion of Ni, the Y-depleted extra film formation can also be ascribed to the metastability and homogeneous structure of the fully amorphous phase in the ribbon with x = 7 because the amorphous phase, like the Fe50Cr15Mo14C15B6 glass, can form an ultrathin passive film.1 The overdosed Ni in the ribbon with x = 10 can induce the crystalline precipitates with defects and grain boundaries and strong network, which stimulates the continuous selective dissolution and weakens the passive film in the electrochemical tests (Fig. 4 and 5). In short, the even element distribution deduced from EDS analysis does not indicate the homogeneous structure and stable passivation; while the Y-depleted extra film gives us new insight to design the anti-corrosion alloys.
5. Conclusions
In this paper, we used the melt-spinner to prepare the Al95−xNixY5 glassy ribbons (x = 7 and 10). Their microstructure and corrosion behavior were investigated by XRD, DSC, SEM, XPS and electrochemical tests. We found the following:(1) The ribbon x = 7 has a nearer eutectic composition, a higher glass-forming ability (GFA), and stronger ribbon formability than x = 10.
(2) The ribbon x = 7 has a longer passive zone in the polarization curve and higher corrosion resistance than x = 10, which can be ascribed to a Y-depleted extra film just under the outermost surface of the ribbon with x = 7 according to the XPS spectra.
(3) The overdosed Ni in the ribbon with x = 10 can enhance the formation of the network and crystalline precipitates in the Al–Ni–Y glasses, which can transport the Y and O elements to participate in the oxidation, hinder the formation of the Y-depleted extra film, and then weaken the alloy's corrosion resistance.
Conflicts of interest
The authors declare that there is no conflict of interest.Acknowledgements
This work was financially supported by National Natural Science Foundation of China (51771103, 52101196 and 52171158) and Open Foundation of Hunan Key Laboratory of Design and manufacture of electromagnetic equipment (DC202002).References
- M. J. Duarte, J. Klemm, S. O. Klemm, K. J. J. Mayrhofer, M. Stratmann, S. Borodin, A. H. Romero, M. Madinehei, D. Crespo, J. Serrano, S. S. A. Gerstl, P. P. Choi, D. Raabe and F. U. Renner, Element-resolved corrosion analysis of stainless-type glass-forming steels, Science, 2013, 341, 372–376 CrossRef CAS PubMed.
- L. M. Zhang, S. D. Zhang, A. L. Ma, H. X. Hu, Y. G. Zheng, B. J. Yang and J. Q. Wang, Thermally induced structure evolution on the corrosion behavior of Al–Ni−Y amorphous alloys, Corros. Sci., 2018, 144, 172–183 CrossRef CAS.
- L. M. Zhang, S. D. Zhang, A. L. Ma, A. J. Umoh, H. X. Hu, Y. G. Zheng, B. J. Yang and J. Q. Wang, Influence of cerium content on the corrosion behavior of Al−Co−Ce amorphous alloys in 0.6 M NaCl solution, J. Mater. Sci. Technol., 2019, 35, 1378–1387 CrossRef.
- Z. Zhang, X. Z. Xiong, W. Zhou, X. Lin, A. Inoue and J. F. Li, Glass forming ability and crystallization behavior of Al−Ni−RE metallic glasses, Intermetallics, 2013, 42, 23–31 CrossRef CAS.
- B. J. Yang, J. H. Yao, J. Zhang, H. W. Yang, J. Q. Wang and E. Ma, Al-rich bulk metallic glasses with plasticity and ultrahigh specific strength, Scr. Mater., 2009, 61, 423–426 CrossRef CAS.
- S. D. Zhang, Z. M. Wang, X. C. Chang, W. L. Hou and J. Q. Wang, Identifying the role of nanoscale heterogeneities in pitting behaviour of Al-based metallic glass, Corros. Sci., 2011, 53, 3007–3015 CrossRef CAS.
- G. T. Burstein, C. Liu, R. M. Souto and S. P. Vines, Origins of pitting corrosion, Corros. Eng., Sci. Technol., 2004, 39, 25–30 CrossRef CAS.
- G. H. Li, S. P. Pan, J. Y. Qin, Z. H. Zhang and W. M. Wang, Insight into thermodynamic and corrosion behaviour of Al−Ni−Gd glassy alloys from atomic structure, Corros. Sci., 2013, 66, 360–368 CrossRef CAS.
- C. G. Jia, J. Pang, S. P. Pan, Y. J. Zhang, K. B. Kim, J. Y. Qin and W. M. Wang, Tailoring the corrosion behaviors of Fe-based metallic glasses through inducing Nb-triggered netlike structure, Corros. Sci., 2019, 147, 94–107 CrossRef CAS.
- N. C. Wu, L. Zuo, J. Q. Wang and E. Ma, Designing aluminum-rich bulk metallic glasses via electronic-structure-guided microalloying, Acta Mater., 2016, 108, 143–151 CrossRef CAS.
- D. Wang, H. Tan and Y. Li, Multiple maxima of GFA in three adjacent eutectics in Zr−Cu−Al alloy system – a metallographic way to pinpoint the best glass forming alloys, Acta Mater., 2005, 53, 2969–2979 CrossRef CAS.
- Y. C. Niu, X. F. Bian, W. M. Wang, S. F. Jin, G. H. Li, F. M. Chu and W. G. Zhang, The peculiarity of contraction in the primary crystallization of amorphous Fe73.5Nb3Cu1Si13.5B9 alloy, J. Alloys Compd., 2007, 433, 296–301 CrossRef CAS.
- Z. C. Yan, Y. Liu, S. Pan, Y. H. Hu, J. Pang and W. M. Wang, The structural evolution of Al86Ni9La5 glassy ribbons during milling at room and cryogenic temperatures, Materials, 2018, 11, 1956 CrossRef PubMed.
- X. Cui, Q. D. Zhang, X. Y. Li and F. Q. Zu, On crystallization behavior and thermal stability of Cu64Zr36 metallic glass by controlling the melt temperature, J. Non-Cryst. Solids, 2016, 452, 336–341 CrossRef CAS.
- J. X. Meng, Z. Ling, M. Q. Jiang, H. S. Zhang and L. H. Dai, Appl. Phys. Lett., 2008, 92, 171909 CrossRef.
- C. H. Shek, G. M. Liu, K. L. Lee and J. K. L. Lai, J. Non-Cryst. Solids, 1998, 224, 244 CrossRef CAS.
- W. M. Wang, Y. C. Niu, F. Wang, J. C. Liang, S. F. Jin, W. G. Zhang and X. F. Bian, Electrical resistivity evolution in the annealed amorphous Fe78Si9B13 ribbons, J. Non-Cryst. Solids, 2008, 354, 3612–3616 CrossRef CAS.
- B. Sarac, T. Karazehir, M. Mühlbacher, A. S. Sarac and J. Eckert, Electrocatalytic behavior of hydrogenated Pd-metallic glass nanofilms: Butler-Volmer, Tafel, and impedance analyses, Electrocatalysis, 2020, 11, 94–109 CrossRef CAS.
- M. Nematollahi, M. Heidarian, M. Peikari, S. M. Kassirih, N. Arianpouya and M. Esmaeilpour, Comparison between the effect of nanoglass flake and montmorillonite organoclay on corrosion performance of epoxy coating, Corros. Sci., 2010, 52, 1809–1817 CrossRef CAS.
- R. Babilas, W. ŁońSki, K. Młynarek, A. Bajorek and A. Radoń, Relationship between the thermodynamic parameters, structure, and anticorrosion properties of Al–Zr–Ni–Fe–Y alloys, Metall. Mater. Trans. A, 2020, 51, 4215–4227 CrossRef CAS.
- X. Yang, X. C. Xu, Q. C. Xiang, Y. D. Qu, Y. L. Ren and K. Q. Qiu, The catalytic performance of Cu46Zr47−xAl7Yx amorphous ribbons in the degradation of AO II dye wastewater, Environ. Sci. Pollut. Res., 2021, 28, 48038–48052 CrossRef CAS PubMed.
- G. H. Li, W. M. Wang, X. F. Bian, J. T. Zhang, R. Li and L. Wang, Comparing the dynamic and thermodynamic behaviors of Al86Ni9-La5/(La0.5Ce0.5)5 amorphous alloys, J. Alloys Compd., 2009, 478, 745–749 CrossRef CAS.
- A. Griesche, M. P. Macht and G. Frohberg, Chemical diffusion in bulk glass-forming Pd40Cu30Ni10P20 melts, Scr. Mater., 2005, 53, 1395–1400 CrossRef CAS.
- A. Ponjavic, J. Dench, N. Morgan and J. S. S. Wong, In situ viscosity measurement of confined liquids, RSC Adv., 2015, 5, 99585–99593 RSC.
- H. Luo, S. F. Xiao, S. J. Wang, P. Huai, H. Q. Deng and W. Y. Hu, Molecular dynamics simulation of diffusion and viscosity of liquid lithium fluoride, Comput. Mater. Sci., 2016, 111, 203–208 CrossRef CAS.
- W. F. Lu, J. C. Tseng, A. H. Feng and J. Shen, Structural origin of the enhancement in glass-forming ability of binary Ni–Nb metallic glasses, J. Non-Cryst. Solids, 2021, 564, 120834 CrossRef CAS.
- L. L. Shao, Q. Q. Wang, L. Xue, M. Y. Zhu, A. D. Wang, J. H. Luan, K. B. Yin, Q. Luo, Q. S. Zeng, L. T. Sun and B. L. Shen, Effects of minor Si addition on structural heterogeneity and glass formation of GdDyErCoAl high-entropy bulk metallic glass, J. Mater. Res. Technol., 2021, 11, 378–391 CrossRef CAS.
Footnote |
| † These authors give the same contribution to this paper equally and can be considered as first author. |
| This journal is © The Royal Society of Chemistry 2022 |

