 Open Access Article
Bio-based arginine surface-modified ammonium polyphosphate: an efficient intumescent flame retardant for epoxy resin†
Chen Chenga,
Yi Wangb,
Yanling Lua,
Shaojie Lia,
Hua Lia,
Jun Yan*c and
Shiguo Du *a
*a
aArmy Engineering University of PLA-Shijiazhuang Campus, Shijiazhuang, Hebei 050003, P. R. China. E-mail: shiguoduaeu@163.com
bNaval Aeronautical University, Yantai, Shandong 264000, P. R. China
cHebei Jiaotong Vocational and Technical College, Shijiazhuang, Hebei 050003, P. R. China. E-mail: yan-junjun@263.net
First published on 23rd March 2022
Abstract
In this work, ammonium polyphosphate (APP) was surface-modified by bio-based arginine (Arg) for the first time to enhance its flame retardance for fire-safety epoxy resin (EP). The structure of Arg modified APP (Arg-APP) was characterized by Fourier transform infrared spectroscopy (FTIR), X-ray photoelectron spectroscopy (XPS), 1H nuclear magnetic resonance (1H-NMR), and scanning electron microscopy (SEM). The results illustrated that Arg was attached on the surface of APP through a cation exchange reaction. With Arg acting as the efficient carbon source, the char-forming ability of Arg-APP was significantly improved as illustrated by thermogravimetric analysis (TGA). The flame retardance of EP/APP and EP/Arg-APP composites was evaluated using the limit oxygen index (LOI), vertical burning tests (UL-94), and cone calorimeter tests (CCT). The results showed that at the same weight loading (15 wt%), Arg-APP had better flame retardance and smoke suppression performance compared with pristine APP, which can be attributed to Arg-APP constituting an integrated intumescent flame retardant (IFR) and facilitating formation of char residues with significantly expanded structures and higher carbonization degrees. When the weight loading of Arg-APP reached 25 wt%, the EP/Arg-APP composite could achieve an LOI value as high as 34.7%, pass V-0 requirements in UL-94 tests, and decrease the peak heat release rate and total smoke production by 83.5% and 61.1% compared with neat EP in CCT, respectively, indicating the superior flame retardance performance of Arg-APP. Finally, the effects of the flame retardant additives on the mechanical properties of EP were evaluated by the differential scanning calorimetry (DSC) tests and tensile-strain tests. At the same additive weight loading (15 wt%), the EP/Arg-APP composite showed higher glass-transition temperature and better tensile-strain properties compared with EP/APP composite, which can be attributed to the Arg shell structure improving the compatibility between APP and the organic substrate. In conclusion, this work presents a convenient and environmentally friendly method to improve the practical performance of APP.
1. Introduction
In the modern polymer industry, epoxy resins (EPs) are widely used in many fields such as transportation, aerospace, electronic packing materials, and coatings owing to their superior tensile strength, chemical stability, and strong cohesiveness.1–4 However, neat EP with high flammability can easily result in a fire risk, which restricts its use in specific fields. Hence, it is important to reduce the fire risk of EP to further broaden its engineering applications.5In recent years, the halogen-free intumescent flame retardants (IFRs) are widely used for EP flame-retardant treatment owing to the low toxic smoke emission and high flame retardance efficiency.6–9 A typical IFR system is constituted by three elementary components, namely an acid source, a carbon agent, and a blowing agent. In the fire scene, the acid source promotes the char-forming process of the carbon agent, then the chars will be further expanded by the gases emitting from the blowing agent.10,11 The intumescent char residuals are supposed to interrupt the transfer of oxygen and heat efficiently, thus breaking down the burning process.
Ammonium polyphosphate (APP) is one of the most widely-used components for IFRs at present. Due to the abundant phosphorus contents and NH4+ functional groups in the molecular structures, APP can act as the acid source and blowing agent simultaneously.12 Nevertheless, as an inorganic additive, pristine APP tends to migrate and cause phase separation in the organic substrates, which may lead to a negative effect on the mechanical properties of the composites.13 Additionally, to improve the quality of the chars, APP generally needs to be blended with efficient carbon sources in practical use.14,15 In some cases, the blowing agents are also requested to further expand the char residuals.16,17 Owing to the synergistic effects of the components, the APP-based IFR systems possess better flame retardance performance compared with pristine APP. To overcome the aforementioned drawbacks and improve the practical performance of pristine APP simultaneously, the microencapsulation technology is widely used to modify APP before it can function as an applicable flame retardant. After surface modification, the integrated organic shell structures can be formed on the surfaces of APP, which are supposed to enhance the compatibility between the additives and the organic matrices. Meanwhile, because the organic shell structures are generally rich in carbon, the microencapsulated APP (MAPP) samples constitute the integrated IFR systems with the shells as the efficient carbon agents. For now, various materials, such as melamine-formaldehyde resin,18 polyurea,19 epoxy resin,20 and different kinds of amino-containing modifiers,21–24 have been applied as the shell structures for MAPP. The as-prepared flame retardants showed good compatibility and flame retardance performance when incorporated with the organic matrices. However, it is worthwhile to note that the monomers for the shells are all derived from petroleum materials, some of which are even toxic, thus the extensive use may do potential harm to the environment. From the perspective of environmental protection, it is meaningful to apply “green” shell materials for MAPP.
In recent years, the investigation of environmentally friendly flame retardants has caught the attention of researchers all over the world. For now, diverse bio-based materials, such as polydopamine,25 ethyl cellulose,26 beta-cyclodextrin,27 tannic acid28 and chitosan,29,30 have been used as shell structures for MAPP. It was reported that MAPP with “green” shell structures can get enhanced compatibility and flame retardance performance simultaneously, which verified the feasibility of substituting traditional shell materials with more environmentally friendly ones. Amino acids are a category of bio-based materials that are widely used in biochemistry, pharmaceutical science, and agriculture at present.31–33 In the flame-retardant fields, amino acids generally act both as the carbon agent and blowing agent for IFR due to the carbon chains and amino groups in the molecular structures. Fang et al. synthesized three novel flame retardants based on the reactions between H3PO3 and urea with amino acids.34 The cotton fabrics were phosphorylated by these flame retardants to prevent the formation of levoglucosan and promote the dehydration and charring process. He et al. prepared fully bio-based phytic acid–basic amino acid salts for flame-retardant polypropylene.35 The characterization results showed that the phytic acid and the basic amino acids constituted integrated IFR systems, which endowed polypropylene with a fire-safety function under different burning scenes. In our previous study, lysine (Lys) was applied to modify APP through cation exchange reaction for the first time to reduce the potential harm to the environment caused by the traditional amino-containing modifiers.36 The obtained Lys modified APP exhibited both improved flame retardance and smoke suppression performance, indicating the capacity of amino acid for acting as a “green” flame retardant. Though there are various amino acids at present, it should be noted that the basic amino acids are more suitable for APP surface modification. This is because the basic amino acids possess high isoelectric points and are positively charged throughout a wide pH range, making the cation exchange interaction with the negatively charged substrates feasible.
In this work, to further broaden the application of environmentally friendly amino acids in the flame retardant field, the arginine (Arg) modified APP (Arg-APP) was prepared through cation exchange reaction and applied as flame retardant for EP. Derived from the nut fruits, Arg is a typical basic amino acid as Lys. However, Arg possesses a higher isoelectric point (10.76) compared with Lys (9.75), thus the cation exchange reaction between Arg and APP can be performed conveniently, and the prepared Arg-APP tends to keep stable in a wider pH range in theory. Additionally, the nitrogen contents of Arg (32.1%) are higher than Lys (19.1%), meaning that more inert gaseous products can be emitted by Arg during the burning process. Hence, Arg is supposed to perform as a more efficient gas agent in the IFR system. In this article, the chemical composition and morphology of Arg-APP, as well as its thermal decomposition behavior and flame retardance performance were comprehensively investigated. Furthermore, based on the characterization results of the char residuals and volatile components, the possible flame retardance mechanism of Arg-APP was also proposed.
2. Experimental
2.1 Materials
APP (form II, n > 1000) was purchased from Guangzhou Xijia Chemical Co., Ltd, China. Arg (purity: 98%) was supplied by Aladdin Chemical Reagent Co., Ltd, China. Ethyl alcohol (purity: 99.8%) was obtained from Tianjin Yongda Chemical Reagent Co., Ltd, China. Diglycidyl ether of biphenol A (E-44, epoxy equivalent = 0.44 mol/100 g) was supplied by Shandong Deyuan Epoxy Resin Co., Ltd, China. Diethylenetriamine-butyl glycidyl ether (amine value = 600–700 mgKOH per g), supplied by Shandong Deyuan Epoxy Resin Co., Ltd, China, was applied as the hardener for the epoxy resin matrix.2.2 Preparation of Arg-APP
At room temperature, a solution of ethyl alcohol (200 mL) and deionized water (10 mL) was poured into a three-neck flask. Stirring for 30 min, Arg (4.0 g), and APP (8.0 g) were added into the mixture. The cation exchange reaction between Arg and APP was performed in the N2 atmosphere at 80 °C. After gentle mechanical stirring for 4 h, the mixture was cooled down to room temperature and filtered to remove the extra solvent. The residues were washed with ethyl alcohol three times and dried overnight at 60 °C in vacuum. Finally, the obtained white powder was labeled as Arg-APP. The possible preparation mechanism and chemical structure of Arg-APP were presented in Scheme 1. In theory, the side-chain-amino group and α-amino group can both perform cation exchange reaction with APP. However, it should be noted that the pKa value of α-COOH in Arg is 2.17, meaning that the carboxylic function group is negatively charged during the preparation procedure.37 Hence, considering the electrostatic repulsion, the side-chain amino group may be more likely to conduct the cation exchange reaction with APP.382.3 Preparation of flame-retardant EP
Firstly, the pre-weighed flame retardant additives (APP or Arg-APP) and hardener were added into uncured epoxy under continuous mechanical stirring and ultrasonic treatment. The detailed ingredients were presented in Table 1. Stirring for 30 min, the homogeneous mixtures were poured into the Teflon molds and precured at room temperature for 24 h. Finally, after post-cured at 80 °C for 4 h, the flame-retardant EP composites were obtained.| Sample | Epoxy | Parts per hundred (phr.) | ||
|---|---|---|---|---|
| Hardener | APP | Arg-APP | ||
| EP | 100 | 20 | — | — |
| EP/APP15 | 100 | 20 | 15 | — |
| EP/Arg-APP15 | 100 | 20 | — | 15 |
| EP/Arg-APP20 | 100 | 20 | — | 20 |
| EP/Arg-APP25 | 100 | 20 | — | 25 |
2.4 Characterization
The Fourier transform infrared tests (FTIR) were performed by TENSOR II spectrometer (Bruker, Germany) in KBr disk. The wavenumber range was set from 4000 cm−1 to 500 cm−1.X-ray photoelectron spectroscopy (XPS) was obtained on ThermoFischer ESCALAB 250 Xi spectrometer (Thermo Fisher Scientific, USA) equipped with Al Kα excitation radiation (hν = 1486.6 eV).
1H nuclear magnetic resonance (1H-NMR) spectra were recorded by Bruker 400M spectrometer (Bruker, Germany) with D2O applied as the solvent.
Scanning electronic microscopy (SEM, JEOL JSM-7800F, Japan) was applied to observe the microstructures. The energy dispersive spectrometer (EDS) connected to SEM was recorded by Oxford X-Max 20 EDS (Oxford Instrument Co., UK) to investigate the elemental composition of char residuals.
Thermogravimetric analysis (TGA) tests were performed on an X70 apparatus (Netzsch, Germany). APP and Arg-APP samples were heated in nitrogen with the heating rate set as 15 K min−1.
The limiting oxygen indexes (LOI) of EP composites were measured by an LOI meter (HC-2, Jiangning Analytical Instrument Co. Ltd., China). According to ASTM D2863, the sample dimension was prepared as 130 × 6.5 × 3.2 mm3. The vertical burning (UL-94) tests were conducted on a vertical burning tester (CZF-2, Jiangning Analytical Instrument Co. Ltd., China) with a sample dimension of 130 × 13 × 3.2 mm3 according to ASTM D3801.
Cone calorimeter tests (CCT) were performed on a calorimeter (Stanton Redcroft Type, England) under a heat flux of 35 kW m−2. In accordance with ISO 5660, the dimension of samples was prepared as 100 × 100 × 3 mm3.
The carbon degree of chars was obtained by a LabRAM HR Evolution laser Raman spectrometer (HORIBA Jobin Yvon, France). The excitation was provided by a 532 nm argon laser line in backscattering geometry.
TGA-infrared spectrometry (TG-IR) was performed on a thermogravimetric analyzer (X70, Netzsch, Germany) linked to an FTIR spectrometer (Bruker, TENSOR27) in nitrogen to characterize the volatile components of EP composites. The heating rate was set as 15 K min−1.
Differential scanning calorimetry (DSC) tests were conducted on the SDT Q20 DSC analyzer (TA Instrument, USA). The heating rating was set to 10 K min−1.
Tensile tests were performed using an electronic universal mechanical testing machine (Instron 5892, Instron Co. USA). Based on ISO 527.2, the tests were carried out at room temperature with a constant crosshead speed of 1 mm min−1.
3. Results and discussion
3.1 FTIR spectra
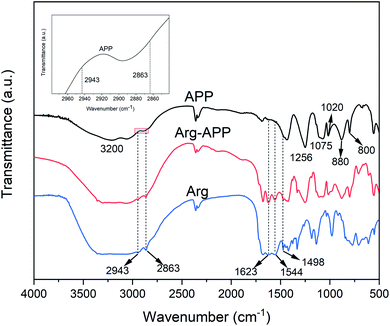
The FTIR spectra of APP, Arg-APP and Arg were presented in Fig. 1. The typical characteristic peaks for APP can be found in the FTIR spectrum, such as the peaks corresponding to N–H (3200 cm−1), P![[double bond, length as m-dash]](https://www.rsc.org/images/entities/char_e001.gif) O (1256 cm−1), P–O symmetric stretching (1075 cm−1), symmetric vibration of PO2 and PO3 (1020 cm−1), P–O asymmetric stretching (880 cm−1), and P–O–P (800 cm−1).27 Compared with APP, some new peaks exhibited in the spectrum of Arg-APP at 2943 cm−1 and 2863 cm−1 (C–H groups), 1623 cm−1 (COO− stretching vibrations), 1544 cm−1 (NH3+ symmetric deformation of the side-chain amino group) and 1498 cm−1 (NH3+ symmetric deformation of the α-amino group).39,40 These emerging characteristic peaks can all be found in the spectrum of Arg, which confirmed that Arg was incorporated well with APP.
O (1256 cm−1), P–O symmetric stretching (1075 cm−1), symmetric vibration of PO2 and PO3 (1020 cm−1), P–O asymmetric stretching (880 cm−1), and P–O–P (800 cm−1).27 Compared with APP, some new peaks exhibited in the spectrum of Arg-APP at 2943 cm−1 and 2863 cm−1 (C–H groups), 1623 cm−1 (COO− stretching vibrations), 1544 cm−1 (NH3+ symmetric deformation of the side-chain amino group) and 1498 cm−1 (NH3+ symmetric deformation of the α-amino group).39,40 These emerging characteristic peaks can all be found in the spectrum of Arg, which confirmed that Arg was incorporated well with APP.
3.2 XPS spectra
XPS analyses were performed to further characterize the surface elements of APP samples. As shown in Fig. 2(a), pristine APP exhibited distinct P2p and P2s peaks at 134.7 eV and 190.9 eV, respectively, while the two peaks can hardly be observed in the Arg-APP XPS spectrum. Additionally, as illustrated in Table 2, Arg-APP showed decreased N, O, and P atomic concentration, nevertheless the C content was increased dramatically. The changes in surface element concentration can be attributed to the fabrication of organic layers on the surfaces of APP since the C element in Arg is much higher than that in APP. The XPS survey spectra confirmed the core–shell structure of Arg-APP. | ||
| Fig. 2 XPS spectra of APP and Arg-APP: (a) survey spectra; (b) N1s spectrum of APP; (c) N1s spectrum of Arg-APP. | ||
| Sample | C (at%) | N (at%) | O (at%) | P (at%) |
|---|---|---|---|---|
| APP | 18.73 | 23.69 | 43.81 | 13.77 |
| Arg-APP | 72.45 | 10.00 | 16.66 | 0.89 |
Fig. 2(b) and (c) presented the N1s high-resolution spectra of APP and Arg-APP, respectively. In Fig. 2(b), the N1s spectrum of APP was deconvoluted into two characteristic peaks corresponding to NH4+ (401.6 eV) and –P–NH–P– (399.4 eV), respectively. This result was consistent with the previous studies.22,41 However, after Arg modification, the area ratio of NH4+ was decreased significantly, and two new characteristic peaks can be additionally observed at 401.1 eV and 399.1 eV as shown in Fig. 2(c), which can be attributed to the nitrogen in –NH3+ and –O–NH3+–C–/–C![[double bond, length as m-dash]](https://www.rsc.org/images/entities/char_e001.gif) NH, respectively.28,41 The obvious changes of N1s spectra indicated that the cation exchange reaction between Arg and APP has been performed successfully.
NH, respectively.28,41 The obvious changes of N1s spectra indicated that the cation exchange reaction between Arg and APP has been performed successfully.
3.3 1H-NMR spectra
1H-NMR was performed to confirm the chemical structure of Arg-APP. For the spectrum of APP shown in Fig. 3(a), only one main characteristic peak corresponding to D2O can be observed at 4.70 ppm. In Fig. 3(b), Arg presented similar 1H-NMR spectra as the previous study.35 Compared with pristine APP, four new resonance peaks presented at 3.50 ppm, 3.08 ppm, 1.70 ppm, and 1.53 ppm in the 1H-NMR spectrum of Arg-APP, which can be corresponding to the protons of CH2 (H-a), CH (H-d), CH2 (H-b) and CH2 (H-c), respectively. Furthermore, in Fig. 3(c), it can be observed that the peaks “a” and “b” showed distinct downfield shifts after the cation-exchange reaction, which can be attributed to the enhanced electron absorption capacity caused by the cationization of amino groups. Generally, the cationic amino groups are electrophilic and can decrease the electron cloud density of H protons, causing the downfield shifts of the characteristic peaks. However, the anionic carboxyl groups in the molecular structures significantly weakened the electron-withdrawing ability of the α-amino groups, hence the downfield shifts of the peaks may be mainly caused by the side-chain amino groups. Additionally, the electron-withdrawing effects of the amino groups can be weakened with the elongation of the carbon chains. Because H-a and H-b were closer to the amino groups of the side chain, they were affected significantly and showed distinct downfield shifts. The 1H-NMR results further demonstrated the successful synthesis of Arg-APP.3.4 SEM micrographs
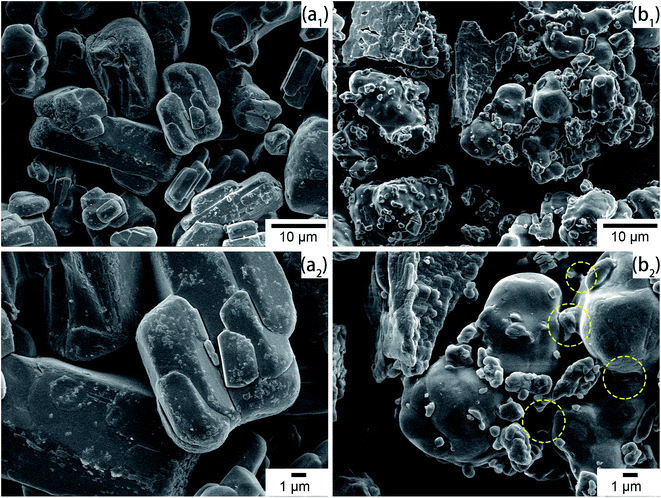
SEM micrographs were taken to intuitively observe the changes in morphology. As shown in Fig. 4(a1) and (a2), the commercial APP was rod-like and exhibited a smooth surface. However, in Fig. 4(b1) and (b2), Arg-APP presented a spherical overall appearance with rougher surficial morphology after the cation exchange reaction, and some tiny particles caused by the aggregation of Arg were additionally observed on the surfaces. The average particle size of Arg-APP was larger than pristine APP as shown in Fig. S1 and Table S1 of the ESI.† Furthermore, unlike the accumulation of APP particles in Fig. 4(a2), it is interesting to observe the bridge-like structures among Arg-APP in Fig. 4(b2), which were made by excess organic Arg films on APP surface and resulted in the aggregation of the Arg-APP particles. During the preparation process, partial α-amino groups may also conduct cation exchange reaction with APP, thus the Arg can act as the “bridge” and make the particles stick together. The changes of the external surfaces further proved the successful coating of APP by Arg.3.5 TGA of APP and Arg-APP
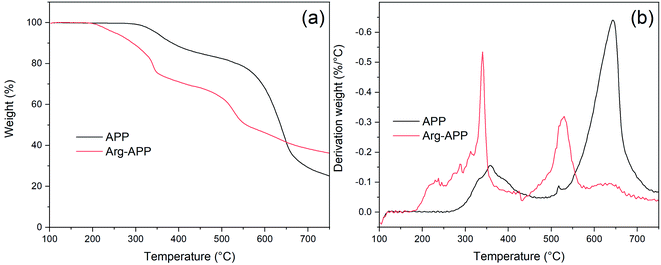
The decomposition processes of APP and Arg-APP were investigated by TGA, and the corresponding data were presented in Fig. 5 and Table 3. The TG and DTG curves showed that pristine APP went through two main degradation steps at 300–450 °C and 500–750 °C, respectively. The former weight-loss step was mainly attributed to the thermal removal of H2O and NH3, while the latter one was caused by the volatilization of phosphorus-containing acids at high temperatures.42 However, owing to the incorporation of less thermally stable Arg shell structures, Arg-APP started to decompose prior to pristine APP, which caused lower Tonest (temperature corresponding to 5% weight loss) and higher mass-loss rate at Tmax1 (temperature for the first maximum mass loss rate) as shown in Table 3. At this degradation step, Arg shells started to decompose and generate NH3. Compared with the reported Lys modified APP, the mass loss rate of Arg-APP at Tmax1 was much higher, indicating the more rapid NH3 release rate of Arg-APP in this temperature range.35 With the temperature increasing, the released phosphorus acids tended to react with Arg instead of volatilizing. Therefore, at Tmax2 (temperature for the second maximum mass loss rate), Arg-APP got a lower degradation rate compared with pristine APP. The reaction made more phosphorus contents available for the fabrication of char residuals, resulting in the increased residual mass of Arg-APP at 750 °C. The TGA results demonstrated that the char-forming ability of APP was significantly improved by the Arg shell structures.| Sample | Tonset (°C) | Tmax1 (°C) | Tmax2 (°C) | Degradation rate at Tmax1 (%/°C) | Degradation rate at Tmax2 (%/°C) | Char mass (%) |
|---|---|---|---|---|---|---|
| APP | 347.1 | 357.2 | 642.2 | 0.16 | 0.64 | 25.1 |
| Arg-APP | 252.4 | 339.9 | 529.9 | 0.53 | 0.32 | 36.4 |
3.6 LOI and UL-94 tests
LOI and UL-94 tests were performed to evaluate the flame retardance of EP composites. The obtained data were presented in Table 4. Owing to the inferior flame retardance performance, neat EP showed a relatively low LOI value (18.6%) and displayed no rating in the UL-94 tests. Because APP is efficient in flame retarding, EP/APP15 showed increased LOI value (28.9%) and passed V-0 degree in the UL-94 tests. However, at the same weight loading, Arg-APP can endow EP with a higher LOI value, indicating its better flame retardance performance. This phenomenon can be mainly attributed to the IFR system constituted by Arg-APP, which tended to fabricate thermally stable char residuals in the tests to interpret the burning behavior. With the weight loading of Arg-APP increasing, more char residuals can be generated to provide efficient protection for EP, hence the highest LOI value was got by EP/Arg-APP25. The LOI and UL-94 tests indicated that Arg-APP was efficient in improving the flame retardance and anti-dripping property of EP.| Samples | LOI (%) | UL-94 rating | |
|---|---|---|---|
| Rating | Dripping | ||
| EP | 18.6 | No rating | Yes |
| EP/APP15 | 28.9 | V-0 | No |
| EP/Arg-APP15 | 31.1 | V-0 | No |
| EP/Arg-APP20 | 33.2 | V-0 | No |
| EP/Arg-APP25 | 34.7 | V-0 | No |
3.7 Cone calorimeter tests
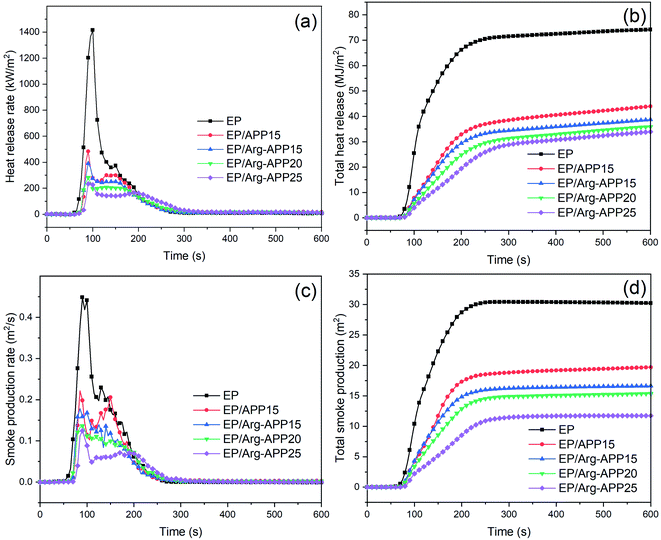
Based on the oxygen consumption principle, CCT are widely used to simulate the combustion behavior of composites in the real fire scene. The primary data of EP composites in CCT, e.g., heat release rate (HRR), total heat release (THR), time to ignition (TTI), time to peak heat release rate (TTP), smoke production rate (SPR), and total smoke production (TSP) were shown in Fig. 6 and Table 5. As presented in Fig. 6(a), neat EP displayed a relatively sharp HRR curve with the peak heat release rate (PHRR) reaching 1416.1 kW m−2, indicating its violent burning behavior. APP and Arg-APP can both decrease the PHRR value of EP to a certain degree. However, EP/Arg-APP15 showed lower PHRR compared with EP/APP15, and with the weight loading of Arg-APP increasing, the lowest PHRR value (233.7 kW m−2) was got by EP/Arg-APP25. Additionally, as shown in Fig. 6(b) and Table 5, EP/Arg-APP25 possessed the lowest THR value and highest residual weight ratio, meaning that a large portion of EP substrates were protected and transferred into char residuals instead of burning up.| Sample | EP | EP/APP15 | EP/Arg-APP15 | EP/Arg-APP20 | EP/Arg-APP25 |
|---|---|---|---|---|---|
| PHRR (kW m−2) | 1416.1 | 484.5 | 391.2 | 283.3 | 233.7 |
| THR (MJ m−2) | 74.1 | 43.9 | 38.7 | 35.8 | 33.9 |
| TTI (s) | 47 | 60 | 61 | 64 | 68 |
| TTP (s) | 100 | 90 | 90 | 90 | 95 |
| Residual mass (wt%) | 2.6 | 12.7 | 22.1 | 31.5 | 40.6 |
| EHC (MJ kg−1) | 22.10 | 18.02 | 17.12 | 16.83 | 16.65 |
| FPI (s m2 kW−1) | 0.033 | 0.124 | 0.156 | 0.226 | 0.291 |
| FGI (kW (m−2 s−1)) | 14.16 | 5.38 | 4.34 | 3.15 | 2.46 |
| PSPR (m2 s−1) | 0.448 | 0.221 | 0.178 | 0.136 | 0.124 |
| TSP (m2) | 30.21 | 19.69 | 16.61 | 15.36 | 11.74 |
The effective heat of combustion (EHC) discloses the burning degree of volatile gases in the gaseous phase during the burning process. As shown in Table 5, the incorporation of flame retardants decreased the EHC of pristine EP. This was because APP and Arg-APP can release non-flammable gases, i.e., NH3, to the gaseous phase and dilute the concentration of flammable volatiles, resulting in the incomplete burning behavior. Furthermore, because the nitrogen contents of Arg were higher than APP, Arg-APP tended to emit more NH3 at the same weight loading, leading to the even lower EHC of the EP/Arg-APP composites. The decreased EHC of EP/Arg-APP indicated that Arg-APP can exhibit good flame retardance in the gaseous phase.
To assess the fire hazard accurately, the fire propagation index (FPI, the proportion of TTI and PHRR) and fire growth index (FGI, the proportion of PHRR and TTP) were calculated with the obtained results shown in Table 5. Generally, larger FPI is obtained from the material which is hard to get flashover, and smaller FGI means that it will take a longer time before the material reaches PHRR.43 As shown in Table 5, EP/Arg-APP25 got the highest FPI and lowest FGI value, which demonstrated its relatively low fire risk.
In a real fire scene, the toxic smoke is a fatal threat to personnel. The curves of SPR and TSP were shown in Fig. 6(c) and (d), respectively. It can be observed that Arg-APP possessed better smoke suppression performance compared with APP at the same weight loading (15 wt%). Moreover, EP blended with 25 wt% Arg-APP decreased the peak smoke production rate (PSPR) and TSP by 72.3% and 61.1% compared with neat EP, respectively. Based on this, it was verified that Arg-APP can significantly reduce the danger of asphyxiation in the real fire scene.
3.8 Analyses of char residuals
Fig. 7 portrayed the overall appearance of char residuals generated in CCT. Pristine EP was burned up with almost no residual left. APP and Arg-APP catalyzed the carbonization process, thus the char residuals were formed by the flame-retardant EP composites. However, as shown in Fig. 7(b1) and (b2), the char residuals formed by EP/APP15 presented a fragmentary overall appearance, which may do harm to the shield effect. Arg-APP constituted an integrated IFR system, hence the EP/Arg-APP composites fabricated intumescent and integral char residuals after CCT. In practical application, the intumescent char residuals can protect the EP substrates from the attack of heat, as well as impede the transfer of oxygen and flammable volatiles, thus breaking down the burning process.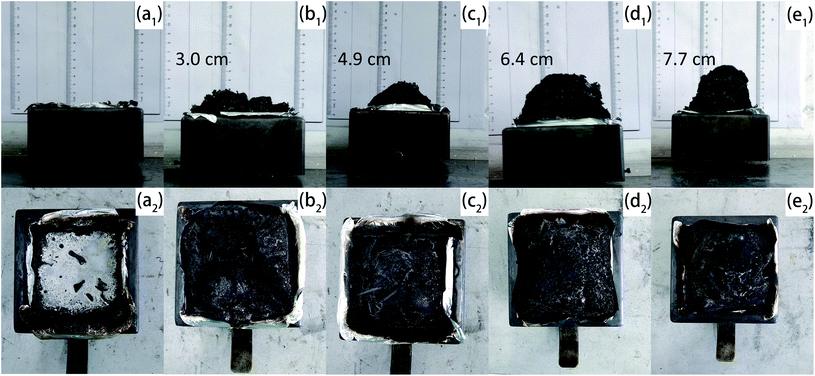 | ||
| Fig. 7 Digital photographs of chars formed by (a1) and (a2) EP, (b1) and (b2) EP/APP15, (c1) and (c2) EP/Arg-APP15, (d1) and (d2) EP/Arg-APP20, and (e1) and (e2) EP/Arg-APP25. | ||
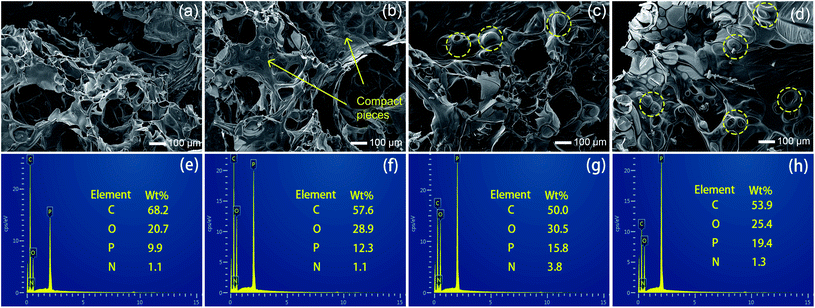
SEM photographs were taken to observe the microstructures of char residuals. As shown in Fig. 8(a), EP/APP15 generated relatively porous char residuals after CCT, while the structures of the char residuals formed by EP/Arg-APP15 were better, since some one-piece chars can be observed in Fig. 8(b). With the Arg-APP weight loading increasing, besides the microstructures of chars being more compact and continuous, some bubble-like structures can be additionally observed in Fig. 8(c) and (d). The reasons for the transformation of the morphology were as follows. Under high temperatures, the EP substrates tended to decompose and generate a mass of gaseous products. Meanwhile, APP catalyzed the formation of char layers, which were supposed to retard the emission of the volatiles. If the carbon layers were not strong enough, the gaseous products can break up the barriers and form a large number of paths for the mass transfer, which eventually fabricated porous char residual microstructures as EP/APP15 did.44 However, the incorporation of Arg carbon agent enhanced the strength of carbon layers, hence EP/Arg-APP15 formed char residuals with better structures. With the Arg-APP weight loading increasing, there were enough phosphorus contents and carbon agents to fabricate char residuals with good strength, which can efficiently retard the emission of volatile products instead of being broken up, hence the bubble-like structures were formed eventually. In the practical application, the continuous char residuals can slow down the transfer of volatiles and prevent the underlying substrates from contacting oxygen, thus endowing EP composites with enhanced fire safety.
Fig. 8(e)–(h) presented the EDS results of the char residuals. The flame-retardant EP composites all fabricated phosphorus-containing char residuals after CCT, which verified that APP has participated in the carbonization process. Additionally, as shown in Fig. 8(e) and (f), EP/Arg-APP15 formed char residuals with higher phosphorus concentration compared with EP/APP15, meaning that Arg-APP made more P contents available for the fabrication of char residuals. No wonder that the char residuals formed by EP/Arg-APP25 got the highest P concentration, which can be regarded as the primary reason for its compact char residual microstructures.45
The structures of char residuals were further characterized by Raman spectroscopy. As shown in Fig. 9, all the char residuals exhibited typical two overlapping peaks at 1590 cm−1 (G band) and 1360 cm−1 (D band), which were corresponding to the graphitic structure and disordered graphite carbons, respectively. Generally, the graphitization of carbon materials can be reflected by the integrated peak intensity ratio of the D band to G band (ID/IG). Lower ID/IG indicates better carbon structures and thermal-oxidative stability.46 Obviously, the ID/IG value followed the sequence of EP/APP15 > EP/Arg-APP15 > EP/Arg-APP20 > EP/Arg-APP25, meaning that Arg-APP can facilitate EP to fabricate char residuals with a higher graphitization degree.
 | ||
| Fig. 9 Raman spectra of char residuals fabricated by (a) EP/APP15, (b) EP/Arg-APP15, (c) EP/Arg-APP20, and (d) EP/Arg-APP25. | ||
XPS analyses were conducted to further investigate the chemical bond information of the char residuals formed by EP, EP/APP15 and EP/Arg-APP25. As shown in Fig. 10(a), the P2s and P2p characteristic peaks can be found in the survey spectrum of EP/APP15 and EP/Arg-APP25, which verified that APP and Arg-APP have participated in the char-forming processes. Additionally, it can be observed that the P2p and P2s peak intensities of EP/Arg-APP25 were stronger compared with EP/APP15. This phenomenon was consistent with the results of EDS mentioned above. For the C1s spectra in Fig. 10(b), the peaks of EP that were located at 288.3 eV, 286.2 eV, 285.0 eV and 284.4 eV can be attributed to the chemical bonds of C![[double bond, length as m-dash]](https://www.rsc.org/images/entities/char_e001.gif) O in ester groups, C–O/C–N, C
O in ester groups, C–O/C–N, C![[double bond, length as m-dash]](https://www.rsc.org/images/entities/char_e001.gif) C, and C–H/C–C in aliphatic groups, respectively. EP/APP15 exhibited similar C1s high-resolution spectra as pristine EP. However, it is interesting to note that the characteristic peak for C
C, and C–H/C–C in aliphatic groups, respectively. EP/APP15 exhibited similar C1s high-resolution spectra as pristine EP. However, it is interesting to note that the characteristic peak for C![[double bond, length as m-dash]](https://www.rsc.org/images/entities/char_e001.gif) O cannot be found in the C1s spectrum of EP/Arg-APP25. Furthermore, as shown in Table S2 of ESI,† the total area ratio of the non-oxidation carbons (C–C, C–H, C
O cannot be found in the C1s spectrum of EP/Arg-APP25. Furthermore, as shown in Table S2 of ESI,† the total area ratio of the non-oxidation carbons (C–C, C–H, C![[double bond, length as m-dash]](https://www.rsc.org/images/entities/char_e001.gif) C) followed the sequence of EP/Arg-APP25 (90.5%) > EP/APP15 (80.5%) >EP (68.3%), which indicated that the char residuals formed by EP/Arg-APP25 were highly graphitized.47 For the O1s spectra of EP/APP15 and EP/Arg-APP25 in Fig. 10(c), it can be observed that the peak intensities ascribed to P–O–P/C–O–P (533.1 eV) and C
C) followed the sequence of EP/Arg-APP25 (90.5%) > EP/APP15 (80.5%) >EP (68.3%), which indicated that the char residuals formed by EP/Arg-APP25 were highly graphitized.47 For the O1s spectra of EP/APP15 and EP/Arg-APP25 in Fig. 10(c), it can be observed that the peak intensities ascribed to P–O–P/C–O–P (533.1 eV) and C![[double bond, length as m-dash]](https://www.rsc.org/images/entities/char_e001.gif) O/P
O/P![[double bond, length as m-dash]](https://www.rsc.org/images/entities/char_e001.gif) O (531.6 eV) were enhanced dramatically compared with neat EP, which can be attributed to the fabrication of organophosphorus carbonaceous char residuals. The N1s spectra also confirmed the formation of phosphorus-containing chars since the strong peaks corresponding to the P–N–P bond emerged in the spectra of EP/APP15 and EP/Arg-APP25. For the P2p spectra, the peaks at 134.5 eV can be ascribed to the chemical bonds of P–O–C, P–O–P, and PO3−, which verified the formation of cross-structured pyrophosphate and polyphosphate complexes in the chars of the flame retardant composites.
O (531.6 eV) were enhanced dramatically compared with neat EP, which can be attributed to the fabrication of organophosphorus carbonaceous char residuals. The N1s spectra also confirmed the formation of phosphorus-containing chars since the strong peaks corresponding to the P–N–P bond emerged in the spectra of EP/APP15 and EP/Arg-APP25. For the P2p spectra, the peaks at 134.5 eV can be ascribed to the chemical bonds of P–O–C, P–O–P, and PO3−, which verified the formation of cross-structured pyrophosphate and polyphosphate complexes in the chars of the flame retardant composites.
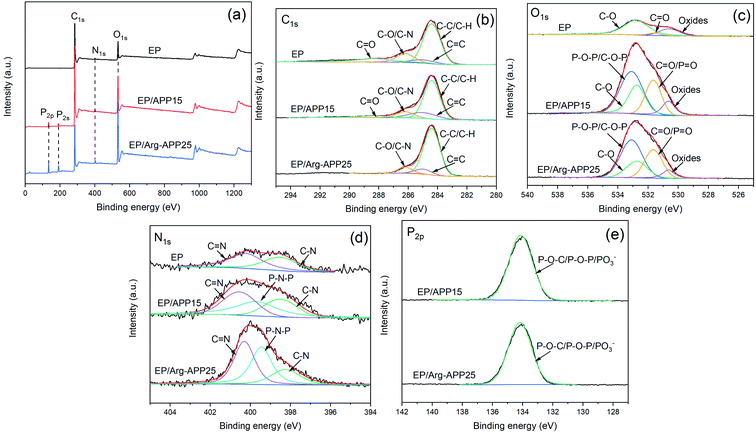 | ||
| Fig. 10 XPS spectra of char residuals formed by EP, EP/APP15 and EP/Arg-APP25: (a) survey spectra and high-resolution spectra of (b) C1s, (c) O1s, (d) N1s, and (e) P2p. | ||
3.9 Thermal stability and pyrolysis products analyses
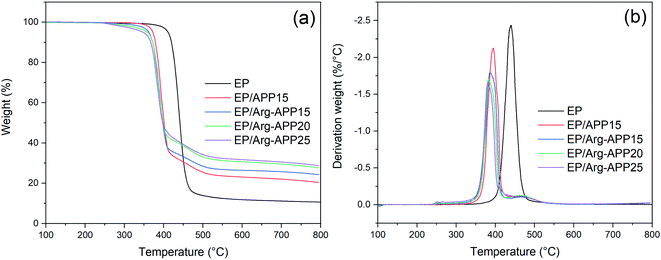
TG-IR tests were conducted to analyze the volatile products generated by EP composites during TGA. Fig. 11 presented the TG and DTG curves of EP samples. Pristine EP exhibited one-step decomposition at 350–500 °C with a relatively high maximum weight loss rate. However, EP blending with APP or Arg-APP showed a typical two-step weight loss behavior, which was consistent with the previous studies.21,23 As illustrated in Table 6, EP/APP and EP/Arg-APP composites exhibited lower Tonset, T30 (temperature corresponding to 30% weight loss) and Tmax compared with pristine EP, indicating the earlier decomposition behavior of the flame retardant samples. Furthermore, due to the prior decomposition of Arg shell structures, the Tonset of EP/Arg-APP was even lower than that of EP/APP15. To evaluate the thermal stability of the composites, the heat resistance index temperature (THRI) was calculated using the following formula.48,49| THRI = 0.49 × [Tonset + 0.6 × (T30 − Tonset)] |
| Sample | Tonset (°C) | T30 (°C) | Tmax (°C) | THRI (°C) | Mass loss rate at Tmax (%/°C) | Residual mass at 800 °C (wt%) |
|---|---|---|---|---|---|---|
| EP | 411.2 | 432.9 | 440.2 | 207.9 | 2.44 | 10.64 |
| EP/APP15 | 372.3 | 392.3 | 394.8 | 188.4 | 2.12 | 20.36 |
| EP/Arg-APP15 | 362.6 | 387.6 | 387.6 | 185.0 | 1.79 | 24.23 |
| EP/Arg-APP20 | 357.0 | 384.5 | 382.1 | 183.0 | 1.71 | 27.67 |
| EP/Arg-APP25 | 347.4 | 382.4 | 379.9 | 180.5 | 1.66 | 28.71 |
As shown in Table 6, owing to the significantly decreased Tonset and T30, EP/APP and EP/Arg-APP composites presented lower THRI compared with EP, indicating that the flame retardant composites were more easily to decompose at high temperature. This phenomenon was also presented by other phosphorus-containing flame retardants, and the explanation is as follows.50,51 At high temperature, APP decomposed and generated various phosphorus-containing acids, which can further react with the EP substrates. On the one hand, this reaction accelerated the decomposition behavior of EP thus causing the lower Tonset, T30 and Tmax. On the other hand, in this process, partial EP substrates were carbonized by the phosphorus-containing acids instead of gasifying, which led to the lower decomposition rate at Tmax and a higher residual weight ratio. In practical application, this process can be regarded as a positive effect for flame retardance performance because more EP substrates can be protected instead of burning up. Additionally, the incorporation of efficient Arg carbon agents made more carbon residuals generated during TGA, hence EP/Arg-APP composites possessed lower degradation rate at Tmax and higher char residuals weight ratio at 800 °C compared with EP/APP15.
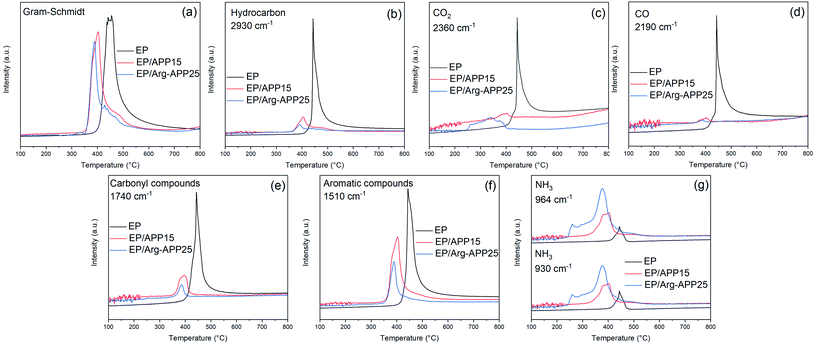
Fig. 12 exhibited the FTIR spectra of the volatile components produced by EP, EP/APP15 and EP/Arg-APP25 at a series of temperatures. It can be observed that the three samples generated approximately the same main gaseous products, i.e., water vapor or phenol, hydrocarbons, CO2, carbon compounds, and aromatic compounds. This phenomenon indicated that the EP substrates were the main sources of the pyrolysis products. However, in the spectra of EP/APP15 and EP/Arg-APP25, two new characteristic peaks that correspond to NH3 were additionally observed at 964 cm−1 and 930 cm−1, which can be ascribed to the degradation of APP and Arg-APP during TGA.52
 | ||
| Fig. 12 FTIR spectra of the gaseous products generated by (a) EP, (b) EP/APP15 and (c) EP/Arg-APP25. | ||
Fig. 13 presented the absorbance intensities of pyrolysis products versus temperature relationships. As shown in Fig. 13(a)–(f), EP/APP15 and EP/Arg-APP25 showed decreased maximum absorbance intensities of the total gas emission and the main pyrolysis products compared with pristine EP, indicating the significantly suppressed gas release of the flame-retardant composites. This phenomenon can be attributed to that a portion of EP substrates were carbonized by APP and Arg-APP instead of decomposing to generate volatile products. In the real fire scene, most of the volatile products can function as the fuel agents in the gaseous phase, therefore the suppressed emission of flammable gaseous products can be deemed as an important flame retardance mechanism of the flame retardants. However, because of the degradation of the flame retardant additives, EP/APP15 and EP/Arg-APP25 showed stronger absorbance intensities for NH3 in Fig. 13(g). In the solid phase, NH3 can promote the swelling of the chars to generate intumescent char residuals. Within the flaming region, the non-flammable NH3 can dilute the concentration of oxygen and flammable volatile products thus disturbing the burning process. Additionally, it can be observed that EP/Arg-APP25 showed earlier and larger NH3 release compared with EP/APP15, which can be attributed to the prior degradation and high nitrogen contents of the Arg shells. The rapid NH3 release rate can be regarded as an important factor for the superior flame retardance performance of Arg-APP.
3.10 Flame retardance mechanism
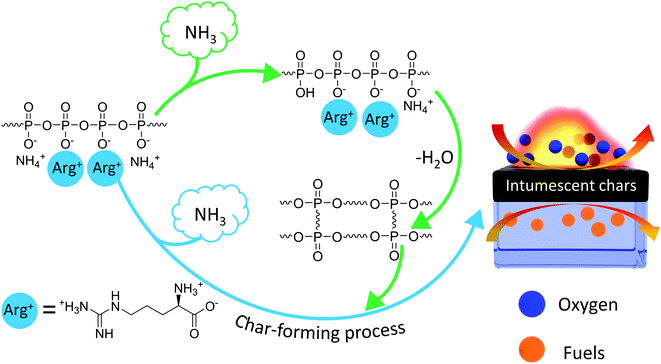
Based on the aforementioned characterization results, the possible flame retardance mechanism of Arg-APP was demonstrated in Scheme 2. Arg-APP itself constituted an integrated IFR system. In the fire scene, the APP cores can be decomposed to generate phosphoric acid and its poly/pyro/ultra-derivatives, which will further react with Arg shell structures and generate a mass of phosphorus-containing char residuals with good thermal stability. Furthermore, during the burning process, a mass of nonflammable NH3 can be emitted by Arg-APP. In addition to diluting the concentration of oxygen and flammable gaseous products in the gas phase, NH3 can also expand the structures of the char residuals. The intumescent and thermally stable char residuals on the surface of EP are supposed to protect the EP substrates from contacting with heat and oxygen, as well as suppress the emission of flammable gaseous products, thus endowing the composites with superior flame retardance performance.3.11 Mechanical properties
DSC was applied to evaluate the glass-transition temperatures (Tg) of EP samples. No obvious exothermic peak showing in the DSC curves indicated that all of the composites were cured completely.53 The APP particles decreased the crosslink density of EP, hence EP/APP15 showed lowered Tg compared with pristine EP.44 However, it can be observed that the Tg of EP/Arg-APP15 was higher than that of EP/APP15. This may be because the Arg shell structures enhanced the compatibility between Arg-APP and polymer, which restricted the mobility of EP chains near Arg-APP particles. With the Arg-APP weight ratio increasing, the crosslink density of EP was even lower, thus EP/Arg-APP20 and EP/Arg-APP25 got lower Tg compared with EP/Arg-APP15.Fig. 14(b) and (c) and Table 7 presented the tensile test results of EP composites. Pristine EP exhibited the highest value of elongation at break, tensile strength, and Young's modulus, indicating its superior mechanical properties. However, blending with flame retardant additives may cause numerous defects in EP matrices and decrease the crosslinking density significantly, hence the flame-retardant EP composites, especially EP/Arg-APP25, showed deteriorated tensile strain properties and decreased Young's modulus. Even so, it should be noted that at the same weight loading (15 wt%), Arg-APP possessed less negative effect on the mechanical properties of EP, which can be attributed to the improved compatibility between Arg shells and substrates. The weakened adverse effect on the mechanical properties, together with the improved flame retardance performance, indicated that Arg-APP was more suitable for practical use.
 | ||
| Fig. 14 (a) DSC curves, (b) typical tensile-strain curves and (c) elongation at break and tensile strength results of EP composites. | ||
| Sample | Elongation at break (%) | Tensile strength (MPa) | Young's modulus (GPa) |
|---|---|---|---|
| EP | 9.78 ± 0.66 | 58.25 ± 1.02 | 1.474 ± 0.029 |
| EP/APP15 | 3.37 ± 0.22 | 38.14 ± 1.58 | 1.392 ± 0.021 |
| EP/Arg-APP15 | 4.01 ± 0.37 | 40.05 ± 1.82 | 1.411 ± 0.016 |
| EP/Arg-APP20 | 3.40 ± 0.28 | 34.41 ± 1.27 | 1.352 ± 0.019 |
| EP/Arg-APP25 | 2.91 ± 0.13 | 32.70 ± 1.65 | 1.332 ± 0.017 |
4. Conclusions
In summary, this work proposed a convenient and environmentally friendly method to fabricate Arg surface-modified APP via cation exchange reaction for flame-retardant EP. Arg-APP constituted an integrated IFR system and showed better flame retardance performance than pristine APP. With the conjugation of 25 wt% Arg-APP, the LOI value of the flame retardant EP/Arg-APP composite increased to 34.7%, and a UL-94 V-0 rating was also achieved. Additionally, in CCT, EP/Arg-APP25 decreased the PHRR and TSP by 83.5% and 61.1% compared with neat EP, respectively, demonstrating the outstanding flame retardance and ameliorated smoke suppression. Afterwards, the flame retardance mechanism of Arg-APP were investigated. The results of SEM, XPS, Raman spectra and TG-IR indicated that Arg-APP showed good flame retardance both in the condensed phase and gaseous phase. With Arg shell acting as efficient carbon agent and blowing agent, EP/Arg-APP composites fabricated the continuous, intumescent and thermally stable phosphorus-rich graphitized protective char residuals, which protected the underlying EP substrates from the attacking of oxygen and heat. Additionally, in the gaseous phase, the non-flammable NH3 diluted the concentration of flammable volatile products thus decreased the combustion efficiency. Furthermore, because Arg shell enhanced the compatibility between APP and the substrates, Arg-APP additives caused less damage to the mechanical properties of EP. Thus, this work improved the flame retardance and compatibility of APP through a convenient and “green” method.Together with the previously reported Lys modified APP, this work further illustrated the feasibility of amino acids acting as the efficient flame retardants. However, the higher nitrogen contents and isoelectric point of Arg indicate that it may be more efficient in acting as the blowing agent and more suitable for further modification. In this work, the flame retardance performance of Arg-APP was compared with APP preliminarily. To promote the practical use of Arg-APP, more detailed contrast experiments with pristine APP and other APP-based flame retardants are needed in future work.
Conflicts of interest
There are no conflicts to declare.Acknowledgements
This work wants to thank Shiyanjia Lab for the support of XPS analysis.Notes and references
- Z. Shao, M. Zhang, Y. Li, Y. Han and L. Ren, Chem. Eng. J., 2018, 345, 471–482 CrossRef CAS.
- N. Saba, M. Jawaid, O. Y. Alothman, M. Paridah and A. Hassan, J. Reinf. Plast. Compos., 2016, 35, 447–470 CrossRef CAS.
- A. Dadian, S. Rahnama and A. Zolfaghari, J. Adhes. Sci. Technol., 2020, 34, 2389–2404 CrossRef CAS.
- I. Bustero, I. Gaztelumendi, I. Obieta, M. A. Mendizabal, A. Zurutuza, A. Ortega and B. Alonso, Adv. Compos. Hybrid Mater., 2020, 3, 31–40 CrossRef CAS.
- O. Dagdag, A. El Harfi, E. Essamri, M. El Gouri, S. Chraibi, M. Assouag, B. Benzidia, O. Hamed, H. Lgaz and S. Jodeh, Int. J. Ind. Chem., 2018, 9, 231–240 CrossRef CAS.
- Y. Chen, Q. Lu, G. Zhong, H. Zhang, M. Chen and C. Liu, J. Appl. Polym. Sci., 2021, 138, 49918 CrossRef CAS.
- K. Chavali, D. Pethsangave, K. Patankar, R. Khose, P. Wadekar, S. Maiti, R. Adivarekar and S. Some, J. Mater. Sci., 2020, 55, 14197–14210 CrossRef CAS.
- T. Rao, T. Naidu, M. Kim, B. Parvatamma, Y. Prashanthi and B. Koo, Nanomaterials, 2019, 10, 42 CrossRef PubMed.
- M. Kuranska, U. Cabulis, M. Auguscik, A. Prociak, J. Ryszkowska and M. Kirpluks, Polym. Degrad. Stab., 2016, 127, 11–19 CrossRef CAS.
- Y. Zhang, Y. Hu, J. Wang, W. Tian, K. Liew, Y. Zhang and B. Wang, Composites, Part A, 2018, 115, 215–227 CrossRef CAS.
- W. K. Lim, M. Mariatti, W. S. Chow and K. T. Mar, Composites, Part B, 2012, 43, 124–128 CrossRef.
- K. Lim, S. Bee, L. Sin, T. Tee, C. Ratnam, D. Hui and A. R. Rahmat, Composites, Part B, 2016, 84, 155–174 CrossRef CAS.
- S. Qiu, C. Ma, X. Wang, X. Zhou, X. Feng, R. Yuen and H. Yuan, J. Hazard. Mater., 2018, 344, 839–848 CrossRef CAS PubMed.
- J. Wang and X. Cai, Polym. Int., 2012, 61, 703–710 CrossRef CAS.
- X. Su, Y. Yi, J. Tao, H. Qi and D. Li, Polym. Degrad. Stab., 2014, 105, 12–20 CrossRef.
- S. Ullah, F. Ahmad, A. Al-Sehemi, M. Assiri, M. Raza and A. Irfan, J. Appl. Polym. Sci., 2021, 138, 50310 CrossRef CAS.
- Q. Zhang and Y. Chen, J. Polym. Res., 2011, 18, 293–303 CrossRef CAS.
- Y. Zhang, Y. Lu, F. Guo, C. Peng, M. Li and W. Xu, Polym. Adv. Technol., 2012, 23, 166–170 CrossRef.
- J. Cheng, S. Niu, D. Ma, Y. Zhou and X. Chen, J. Appl. Polym. Sci., 2020, 137, 49591 CrossRef CAS.
- L. Liu, Y. Zhang, L. Li and Z. Wang, Polym. Adv. Technol., 2011, 22, 2403–2408 CrossRef CAS.
- M. Kim, H. Ko and S. Park, Composites, Part B, 2019, 170, 19–30 CrossRef CAS.
- Z. Shao, C. Deng, Y. Tan, Y. Li, M. Chen, L. Chen and Y. Wang, J. Mater. Chem. A, 2014, 2, 13955 RSC.
- Y. Tan, Z. Shao, L. Yu, J. Long, M. Qi, L. Chen and Y. Wang, Polym. Chem., 2016, 7, 3003–3012 RSC.
- Y. Tan, Z. Shao, L. Yu, Y. Xu, W. Rao, L. Chen and Y. Wang, Polym. Degrad. Stab., 2016, 131, 62–70 CrossRef CAS.
- S. Zhu, W. Wang, Z. Islam, Y. Fu and Y. Dong, J. Appl. Polym. Sci., 2021, 138, 49696 CrossRef CAS.
- W. Hu, B. Wang, X. Wang, H. Ge, L. Song, J. Wang and Y. Hu, J. Therm. Anal. Calorim., 2014, 117, 27–38 CrossRef CAS.
- W. Wang, Y. Peng, H. Chen, Q. Gao, J. Li and W. Zhang, Polym. Compos., 2017, 38, 2312–2320 CrossRef CAS.
- Y. Sui, X. Dai, P. Li and C. Zhang, Eur. Polym. J., 2021, 156, 110601 CrossRef CAS.
- Y. Zhang, Z. Xiong, H. Ge, L. Ni, T. Zhang, S. Huo, P. Song and Z. Fang, ACS Sustainable Chem. Eng., 2020, 8, 6402–6412 CrossRef CAS.
- Z. Xiong, Y. Zhang, X. Du, P. Song and Z. Fang, ACS Sustainable Chem. Eng., 2019, 7, 8954–8963 CrossRef CAS.
- P. Kandasamy, G. Gyimesi, Y. Kanai and M. Hediger, Trends Biochem. Sci., 2018, 43, 752–789 CrossRef CAS PubMed.
- J. Hedges and K. Ryan, Chem. Rev., 2020, 120, 3161–3209 CrossRef CAS PubMed.
- M. D'Este, M. Alvarado-Morales and I. Angelidaki, Biotechnol. Adv., 2018, 36, 14–25 CrossRef PubMed.
- F. Xu, L. Zhong, Y. Xu, C. Zhang, P. Wang, F. Zhang and G. Zhang, Cellulose, 2019, 26, 7537–7552 CrossRef CAS.
- S. He, Y. Gao, Z. Zhao, S. Huang, Z. Chen, C. Deng and Y. Wang, ACS Appl. Polym. Mater., 2021, 3, 1488–1498 CrossRef CAS.
- G. Gambino, G. Lombardo, A. Grassi and G. Marletta, J. Phys. Chem. B, 2004, 108, 2600–2607 CrossRef CAS.
- S. Jacqueline, F. Asmaa, S. Roger and G. Claude, J. Membr. Sci., 1994, 89, 73–81 CrossRef.
- N. Kitadai, T. Yokoyama and S. Nakashima, J. Colloid Interface Sci., 2009, 338, 395–401 CrossRef CAS PubMed.
- E. Shokri, R. Yegani and A. Akbarzadeh, Appl. Clay Sci., 2017, 144, 141–149 CrossRef CAS.
- Z. Zarnegar, H. Monjezi and J. Safari, J. Mol. Struct., 2019, 1193, 14–23 CrossRef CAS.
- P. Zhang, H. Fan, K. Hu, Y. Gu, Y. Chen, J. Yan, S. Tian and Y. He, Prog. Org. Coat., 2018, 120, 88–99 CrossRef CAS.
- W. Jiang, J. Hao and Z. Han, Polym. Degrad. Stab., 2012, 97, 632–637 CrossRef CAS.
- B. Wang, Q. Tang, N. Hong, L. Song, L. Wang, Y. Shi and Y. Hu, ACS Appl. Mater. Interfaces, 2011, 3, 3754–3761 CrossRef CAS PubMed.
- Y. Zhang, B. Yu, B. Wang, K. Liew, L. Song, C. Wang and Y. Hu, Ind. Eng. Chem. Res., 2017, 56, 1245–1255 CrossRef CAS.
- Y. Sun, S. Sun, L. Chen, L. Liu, P. Song, W. Li, Y. Yu, F. Lu, J. Qian and H. Wang, Composites Communications, 2017, 6, 1–5 CrossRef.
- S. Khanal, Y. Lu, S. Ahmed, M. Ali and S. Xu, Polym. Test., 2020, 81, 106177 CrossRef CAS.
- S. Bourbigot, M. Bras, L. Gengembre and R. Delobel, Appl. Surf. Sci., 1994, 81, 299–307 CrossRef CAS.
- M. Patel, S. Mestry, S. P. Khuntia and S. Mhaske, J. Coat. Technol. Res., 2020, 17, 293–303 CrossRef CAS.
- A. Satdive, S. Mestry, P. Borse and S. Mhaske, Iran. Polym. J., 2020, 29, 433–443 CrossRef CAS.
- S. Arora, S. Mestry, D. Naik and S. Mhaske, Polym. Bull., 2020, 77, 3185–3205 CrossRef CAS.
- P. Sheth, S. Mestry, D. Dave and S. Mhaske, J. Coat. Technol. Res., 2020, 17, 231–241 CrossRef CAS.
- B. Yuan, Y. Sun, X. Chen, Y. Shi, H. Dai and S. He, Composites, Part A, 2018, 109, 345–354 CrossRef CAS.
- A. Bifulco, D. Parida, K. A. Salmeia, R. Nazir, S. Lehner, R. Stampfli, H. Markus, G. Malucelli, F. Branda and S. Gaan, Mater. Des., 2020, 193, 108862 CrossRef CAS.
Footnote |
| † Electronic supplementary information (ESI) available. See DOI: 10.1039/d1ra09459a |
| This journal is © The Royal Society of Chemistry 2022 |


