 Open Access Article
Effects of rice root exudates on aggregation, dissolution and bioaccumulation of differently-charged Ag nanoparticles†
Jiajia Yang*a,
Hongyu Duana,
Xiya Wangb,
Huan Zhanga and
Zhifeng Zhang *a
*a
aSchool of Life Science, Shanxi Normal University, Taiyuan, 030000, China. E-mail: jjyang2009@126.com; zzfsx2012@126.com; Fax: +86-0351-2051196
bSchool of Life Science, East China Normal University, Shanghai, 200241, China
First published on 25th March 2022
Abstract
The biological toxicity and eco-environmental risk of metal nanoparticles (MNPs) is closely related to their stability. The stability of MNPs not only depends on their own properties but also on the effects of biological and environmental factors. To better understand the interaction between biological factors and MNPs in aquatic environments, the effects of total rice root exudates (T-RRE) on the aggregation, dissolution and bioaccumulation of Ag nanoparticles (AgNPs) with different surface charges were investigated in detail. Results indicated that T-RRE can induce the aggregation and sedimentation, and hinder the dissolution of polyethyleneimine-coated AgNPs (AgNPs@PEI) with positive surface charges as well as reducing the bioaccumulation of Ag in rice roots. T-RRE had no obvious effect on the dispersion stability of AgNPs@Cit (negatively charged citrate-coated AgNPs) and AgNPs@PVP (near electrically neutral polyvinylpyrrolidone-coated AgNPs), although T-RRE could induce the dissolution of AgNPs@Cit and AgNPs@PVP. In the molecular fractions of T-RRE, high-molecular-weight root exudates (H-RRE) play a key role in inducing the aggregation of AgNPs@PEI and hindering the bioaccumulation of Ag in rice roots. Compared with H-RRE, low-molecular-weight root exudates (L-RRE) can promote the dissolution of AgNPs@Cit and AgNPs@PVP, but it can obviously promote silver accumulation in rice roots. The difference in charge intensity between L-RRE and T-RRE plays a key role in inducing the aggregation and dissolution of AgNPs with different charges. These findings provide a foundation for investigation of the interactions between rice root exudates and nanoparticles with different surface charges in complex environmental systems.
1. Introduction
With the rapid development of nanotechnology, nanomaterials (NMs) have shown promising potential to promote agricultural production and crop protection.1 As a typical metal-based nanoparticle (MNP), silver nanoparticles (AgNPs) have been widely used due to their unique and outstanding antibacterial properties.2,3 However, widespread application of AgNPs will inevitably increase the environmental exposure and ecosystem risk. Many studies have demonstrated that AgNPs exert harmful effects on the growth, photosynthetic processes, lipid peroxidation, enzyme activities, oxidative stress, and gene expressions of different crops.4–7 Investigations into the environmental behavior and evaluation of biological toxicity of AgNPs have received increasing attention. Similar to other MNPs, AgNPs may stay in suspension, aggregation, dissolution or react with different species in the soil and aquatic system. These processes depend not only on their size, charge and surface properties, but also on environmental conditions.8,9 Current studies on the environmental transformations of AgNPs have demonstrated that several environmental factors such as pH, ionic strength, electrolyte, and natural organic matter, can influence the environmental behavior and fate of AgNPs.10–12 Likewise, the interaction between AgNPs and microorganisms or plants may change the occurrence states and fate of AgNPs. For example, extracellular polymeric substances of microorganism can affect the dissolution and toxicity of AgNPs.13,14 As the primary producers of ecosystems, plants play an important role in accumulation and biodistribution of environmentally released substances. Plants serve as a potential pathway for AgNPs transport and bioaccumulation into food chains. Meanwhile, plant growth and metabolic processes may affect the environmental behavior and biological effects of nanoparticles.15 Nevertheless, knowledge of the effect of plants on the fate and transformation of AgNPs is still limited. Comprehensive insight into the influence of plants on the behavior of nanoparticles is beneficial to control their agricultural environment risks.Root exudates (RE) are the main medium of plants to respond to environmental stress. Approximately 30% to 40% of all photosynthetically fixed carbon will be transferred to the rhizosphere through RE.16,17 RE can often be separated into two classes: low-molecular-weight compounds, which include amino acids, organic acids, sugars, phenolics, and an array of secondary metabolites; and high-molecular-weight compounds, such as mucilage and proteins.17 RE has pivotal roles in enhancing the plant resource-use efficiency and regulating the bioavailability of various inorganic and organic pollutants in the rhizosphere.18–20 For example, plant roots can undergo a dynamic physiological response by increasing the secretion of RE and thus reducing the bioavailability of metals in the contaminated soil.21,22 Given that MNPs have unique properties that differ from conventional organic and inorganic pollutants, considerable efforts have been made to illustrate the effects of RE on the aggregation, dissolution, and bioavailability of nanoparticles. Zhao et al. reported that synthetic RE could highly influence the dissolution, transformation and aggregation of uncoated Cu nanoparticles.23 Xing et al. found that Maize RE could not only inhibit the aggregation of CuO NPs but also could promote the dissolution of CuO NPs.24 Cervantes-Avilés et al. observed that four kinds of bare metal oxide nanoparticles present different types of dissolution and aggregation behavior in the presence of Soybean RE.25 Li et al. demonstrated cysteine as a representative small-molecule RE that can enhance the aggregation of AgNPs. Bao et al. reported that citric acid as a typical organic acid secreted by plant roots, can enhance Ce uptake and accumulation in rice seeds when rice was exposed to CeO2 NPs.26 These studies provide important clues to explore the relationship between RE and nanoparticles. However, the colloidal stability of dispersed nanoparticles in aqueous medium is strongly affected by their surface charges and interaction with other molecules.27 Thus, RE may have different effects on the stability, and dissolution behavior of nanoparticles with different surface charges.
Rice (Oryza sativa L.) as an important food crop is a popular staple food for more than half of the world's population. Rice is more likely to suffer from MNPs due to the high solubility of MNPs under moist soil conditions; as such, total rice root exudates (T-RRE) were collected and serve as model RE. Citrate-coated AgNPs (AgNPs@Cit), polyvinylpyrrolidone-coated AgNPs (AgNPs@PVP), and polyethyleneimine-coated AgNPs (AgNPs@PEI) were synthesized as the representative AgNPs with negative, near neutral and positive surface charges, respectively. The effects of T-RRE and its two fractions (H-RRE, L-RRE) on the aggregation and dissolution behavior of differently charged AgNPs will be investigated. Furthermore, the effects of T-RRE, H-RRE, L-RRE on Ag bioaccumulation in rice roots will be also analyzed. This work will be helpful to better understand the interaction mechanism of RE and MNPs and to further evaluate the effects of RE on the bioavailability of nanoparticles in complex environment systems.
2. Materials and methods
2.1 Chemicals and media
AgNO3 (>99.5%) was purchased from Sinopharm Reagent Co., Ltd (Shanghai, China). Polyvinylpyrrolidone (PVP, MW = 3500) and polyethyleneimine (PEI, MW = 600) were supplied by Aladdin Chemistry Co. Ltd (Beijing, China). Sodium borohydride was commercially available from Sigma Aldrich (Dorset, UK). Amicon Ultra-15 centrifugal filters (with 3 kDa nominal MW cutoff) were obtained from Merck Millipore (Darmstadt, Germany). All other reagents were of analytical grade and acquired from Tianjin Kermel Chemical Reagent Co., Ltd (Tianjin, China). Millipore water was used throughout the experiments.2.2 Synthesis of Ag nanoparticles
AgNPs@Cit was prepared as reported previously28 with slightly modification. In brief, 1 mL of 10 mM NaBH4 was injected into 50 mL of 1.25 mM AgNO3 solution containing 0.25 mM sodium citrate. The solution was stirred for 3 h until the mixed solution became yellow and stabilized.AgNPs@PEI was prepared by adding 10 mL of AgNO3 solution (4.76 mmol L−1) into 200 mL of the PEI solution (0.5 mg mL−1) under vigorous stirring at room temperature. After stirring for 1 h, 20 μL of NaBH4 solution (39.5 mmol L−1) was added into the above reaction solution and stirred for 3 h at room temperature to ensure that complete reduction had occurred.
AgNPs@PVP was synthesized referring to the instruction described by El-Badawy et al.29 with slight modifications. Briefly, 2.5 mmol L−1 NaBH4 was dissolved in 50 mL of 1% PVP solution. The solution was added with 50 mL of 2.5 mmol L−1 AgNO3 dropwise and stirred for 2 h. All the steps were conducted in ice bath.
The prepared AgNPs suspension was purified by centrifugal ultrafiltration (Amicon Ultra-15, 50 kDa, Millipore) to remove excess Ag+, citrate, PEI, PVP, and NaBH4, respectively. Each AgNPs suspension was prepared in diluted concentrations of 10 mg mL−1 and stored at 4 °C in the dark until use.
2.3 Characterization of AgNPs
The morphologies of the AgNPs were characterized via a transmission electron microscope (JEOL, JEM-2100F). Zeta (ζ) potential and hydrodynamic diameter of AgNPs were determined using a Malvern Zetasizer Nano-ZS90 instrument (Malvern, USA). UV-vis absorption spectra of AgNPs suspension was recorded by a Shimadzu UV-29100 spectrophotometer using a 1 cm path length quartz cuvette (Tokyo, Japan). The concentration of total silver in the stock solution was measured by ICP-MS (NexION 300, PerkinElmer, USA) after digestion by concentrated HNO3 and H2O2.2.4 T-RRE collection and fractionation
T-RRE was collected according to the protocol described by Zhao et al.16 with slight modifications. In brief, plump rice seeds (Yuan chuang Liangyou 900 variety, Hunan Yuanchuang Super Rice Technology Co., Ltd, China) with uniform size were sterilized with 30% H2O2 for 30 min. After washing repeatedly with deionized water, the rice seeds were germinated for 48 h in the seedling tray at 30 °C. Seeds with root length of about 1 cm were transplanted into culture box and cultured in Hoagland nutrient solution at 25 °C. After 14 days under an alternative light–dark regimen (14 h light and 10 h dark), the roots of rice seedlings were gently washed three times with deionized water and then placed back into culture box with deionized water for 24 h. The culture solution was collected and filtered immediately through the 0.45 μm Millipore membrane to remove the microorganisms and root residues. The concentrated filtrate was stored as stock solution of T-RRE at – 20 °C for future uses.Low-molecular-weight RRE fraction (L-RRE) and high-molecular-weight RRE fraction (H-RRE) were separated by ultrafiltration.24 Briefly, 15 mL of RRE was first centrifuged at 8000 rpm for 20 min by using Amicon Ultra-15 centrifugal filters with 3 kDa nominal MW cutoff. The residue in the centrifugal filter was diluted to 10 mL and regarded as H-RRE, and the filtrate was collected as L-RRE.
2.5 Effect of RRE on dispersion stability of AgNPs
The effect of RRE on the dispersion stability of AgNPs was first investigated through Rayleigh resonance scattering (RRS). In brief, 50 μL AgNPs (10 mg mL−1), 50 μL T-RRE (total RRE), L-RRE, and H-RRE with different concentrations were added to a series of 10 mL centrifuge tubes, respectively. The mixed solution was diluted to 5 mL with 10% strength of nutrient solution.30 The pH value of nutrient solution was adjusted to 6.0 by 1% HNO3 to get close to the pH of the rice growing environment. After reaction for 20 min and the RRS intensity was no longer obvious change, the RRS intensity of the mixed solution was recorded with Cary Eclipse fluorescence spectrophotometer (Agilent Technologies, USA). The slit of excitation wavelength was set to 2.5 nm. In accordance with the above procedure, the hydrodynamic diameter (DH) of AgNPs was determined using a Malvern Zetasizer Nano-ZS90 instrument.2.6 Effect of RRE on dissolution of AgNPs
The dissolution of AgNPs was investigated in the absence and presence of RRE. In brief, 0.2 mL of AgNPs (10 mg mL−1) as well as T-RRE, L-RRE, and H-RRE were added to a series of 50 mL centrifuge tubes, respectively. The mixed solution was diluted to 20 mL with 10% strength of nutrient solution (pH = 6.0). The AgNP solution in the absence T-RRE, L-RRE and H-RRE was as the blank control (CK). At various time points (0, 24, 48, 72, 96, 120, and 168 h), the Ag ions released in solution were separated by ultracentrifugation (MW cutoff: 3 kDa, volume: 15 mL) at 12![[thin space (1/6-em)]](https://www.rsc.org/images/entities/char_2009.gif) 000 rpm for 30 min. Ag concentration in the filtrate was finally analyzed by ICP-MS after acidification with HNO3. Meanwhile, after 168 hours of incubation with T-RRE and L-RRE and H-RRE, AgNPs was separated by the ultrafiltration. The isolated AgNPs was dispersed onto a small piece of aluminum foil and eventually formed a thin film. When samples were dried in a full vacuum, the valence state change of Ag on the surface of AgNPs was determined using an X-ray photoelectron spectroscopy (XPS, K-Alpha, Thermo Fisher Scientific, USA equipped with an X-ray lamp Al Kα micrometer monochromator, hv = 486.6 eV). All the reported binding energies (BE) data was calibrated to the C 1s peak at 284.8 eV through the Avantage software.
000 rpm for 30 min. Ag concentration in the filtrate was finally analyzed by ICP-MS after acidification with HNO3. Meanwhile, after 168 hours of incubation with T-RRE and L-RRE and H-RRE, AgNPs was separated by the ultrafiltration. The isolated AgNPs was dispersed onto a small piece of aluminum foil and eventually formed a thin film. When samples were dried in a full vacuum, the valence state change of Ag on the surface of AgNPs was determined using an X-ray photoelectron spectroscopy (XPS, K-Alpha, Thermo Fisher Scientific, USA equipped with an X-ray lamp Al Kα micrometer monochromator, hv = 486.6 eV). All the reported binding energies (BE) data was calibrated to the C 1s peak at 284.8 eV through the Avantage software.
2.7 Effect of RRE on bioaccumulation of Ag in rice roots
The germinated seeds were transplanted into incubator and cultured in 25% strength of nutrient solution containing 10 mg L−1 AgNPs. After culture for 7 days under an alternative light–dark regimen (14 h light and 10 h dark) with addition of T-RRE, L-RRE or H-RRE (1.0 mg L−1), the harvested rice roots were gently washed with 0.01 mol L−1 HNO3 and rinsed with deionized water to remove AgNPs and silver ions adsorbed on the surface of roots. The roots were dried at 105 °C for 24 h until constant weight was obtained. In brief, 1.0 g of the dried roots were added into 10 mL of concentrated HNO3 at 130 °C for 10 min, then at 180 °C for another 15 min. The above samples were digested in 1 mL of H2O2 at 85 °C for 5 min and then at 130 °C for 4 min. After cooling, the samples were diluted with 1% (v/v) HNO3 up to the total volume of 10 mL. Total Ag content was measured using ICP-MS.2.8 Statistical analysis
The results from all the experiments are expressed as the mean ± standard error. Five replicates were made for the plant growth experiments, and three replicates were conducted for all other tests. One-way analysis of variance (ANOVA) followed by Duncan test was applied (p < 0.05).3. Results and discussion
3.1 Characteristics of AgNPs
The TEM images of the synthesized AgNPs are presented in Fig. 1A–C. Three kinds of brownish yellow AgNPs solution all were highly dispersed and the particles exhibited approximate spherical shape. The XPS spectrum of AgNPs@Cit, AgNPs@PVP, and AgNPs@PEI were shown in Fig. 1D. The peaks centered at binding energy of 368.3 eV and 374.3 eV can be ascribed to Ag 3d3/2 and Ag 3d5/2, respectively. The binding energy values of each AgNPs are in agreement with metallic silver (Ag0), indicated the formation of AgNPs. The average DH of AgNPs@Cit, AgNPs@PVP, and AgNPs@PEI were 65.09 ± 3.28, 85.60 ± 4.62, and 92.36 ± 3.85 nm in 10% strength of nutrient solution (pH = 6.0) respectively (Fig. 1E). The zeta potential values of AgNPs@Cit, AgNPs@PVP, and AgNPs@PEI were −13.69 ± 0.72 mV, −1.53 ± 0.39 and +18.85 ± 0.89 mV in 10% strength of nutrient solution (pH = 6.0), respectively (Fig. 1F). It indicated that AgNPs@Cit, AgNPs@PVP, and AgNPs@PEI exhibited negative, near neutral and positive surface charge, respectively. The total Ag contents in AgNPs@Cit, AgNPs@PVP, and AgNPs@PEI are 6.84 mg g−1, 4.08 mg g−1, and 4.73 mg g−1, respectively.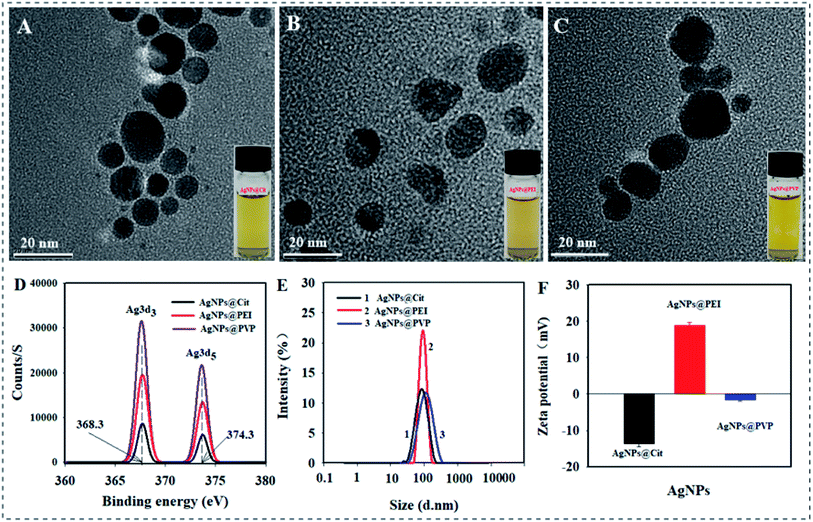 | ||
| Fig. 1 TEM image of AgNPs@Cit (A), AgNPs@PEI (B), and AgNPs@PVP (C). (D) XPS spectrum of each AgNPs. (E) DH distribution of each AgNPs. (F) Zeta potential value of each AgNPs. | ||
3.2 Effect of RRE on dispersion stability of AgNPs
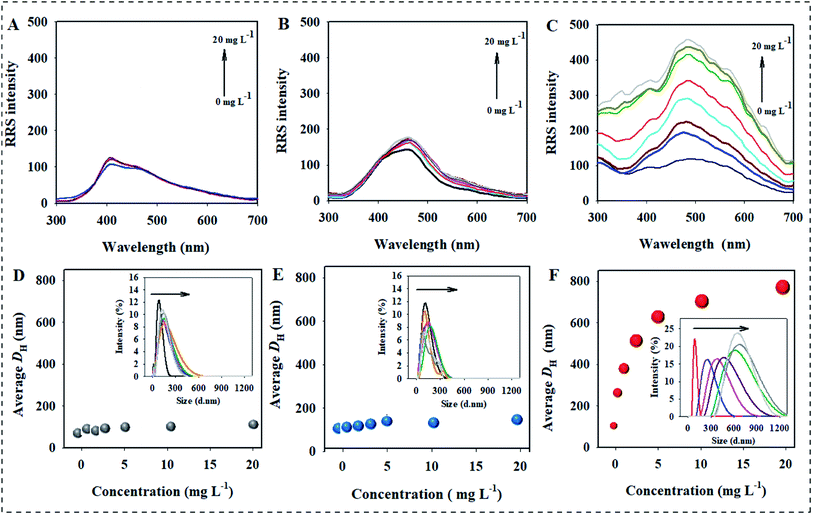
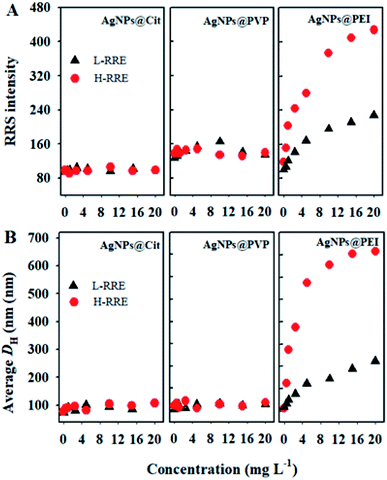
The effect of RRE on the dispersion stability of three kinds of AgNPs was first investigated by RRS, which is a convenient technique used to measure the aggregation behavior of nanoparticles due to large nanoparticles corresponding to high RRS intensity.31 The result showed no obvious change in the RRS intensity of AgNPs@Cit in the presence of T-RRE even if the concentration was 20 mg L−1 (Fig. 2A). Similar result was also observed for AgNPs@PVP (Fig. 2B). However, the RRS intensity of AgNPs@PEI showed a pronounced change in the presence of T-RRE, and it gradually enhanced with increasing concentration of T-RRE, which reflected the formation of AgNPs@PEI agglomerates (Fig. 2C). The effect of T-RRE on the DH changes of three kinds of AgNPs was further investigated. As shown in Fig. 2D and E, negligible changes in the DH distribution were observed for AgNPs@Cit (Fig. 2D insert) and AgNPs@PVP (Fig. 2E insert), Hence, T-RRE had no significant effect on the average DH of AgNPs@Cit and AgNPs@PVP. By contrast, the average DH distribution of AgNPs@PEI became wider (Fig. 2F insert), and the average DH increased rapidly from 98.6 nm to 766.9 nm with increasing T-RRE concentration (Fig. 2F), demonstrating that T-RRE promoted the aggregation of AgNPs@PEI. The effect of T-RRE on the dispersion stability of three kinds of AgNPs was further confirmed by TEM imaging (Fig. S1†). It was found that AgNPs@Cit and AgNPs@PVP can maintain good dispersion in the presence of T-RRE. However, AgNPs@PEI adhered to each other in the presence of T-RRE leading to the formation of larger aggregates.Given the RE often be separated into low-molecular-weight fragment and high-molecular-weight fragment,17 It's critical to investigate which specific fragment plays a key role in the dispersion and aggregation of AgNPs. Thus, the effects of L-RRE and H-RRE on the aggregation of AgNPs were further analyzed. The results showed no significant change in the RRS intensity for AgNPs@Cit and AgNPs@PVP when each fraction was added (Fig. 3A). However, the RRS intensity of AgNPs@PEI after the addition of L-RRE, and H-RRE was significantly higher than that of the pristine AgNPs@PEI (Fig. 3A). The results were further confirmed by DH analysis (Fig. 3B). In the presence of different concentrations of L-RRE or H-RRE, the average DH of AgNPs@Cit and AgNPs@PVP remained stable. Consistent with the RRS results, the average DH of AgNPs@PEI increased from 94.6 nm to 255.8 nm and 653.4 nm in the presence of L-RRE and H-RRE. The RRS intensity and DH of AgNPs@PEI in the presence of H-RRE were higher than those in the presence of L-RRE, demonstrating H-RRE more easily induced the aggregation of AgNPs@PEI than L-RRE.
The stability of nanoparticles is highly related to their surface potential and the electrostatic interaction between particles and charged molecules.32,33 Therefore, changes in the surface zeta potential of three kinds of AgNPs in the presence of T-RRE, L-RRE, and H-RRE were examined. As shown in Fig. S2A,† the zeta potential of T-RRE, L-RRE, and H-RRE was measured to be −19.33 mV, −13.66 mV and −24.16 mV, respectively. When T-RRE was added into the dispersions of the three kinds of AgNPs, the surface zeta potential of AgNPs@Cit and AgNPs@PVP presented higher electronegativity. While the surface zeta potential of AgNPs@PEI decreased from +19.67 mV to +8.16 mV (Fig. S2B†). Compared with L-RRE, H-RRE can induce more obvious changes in the zeta potential of three kinds of AgNPs. The increase in surface zeta potential will enhance the electrostatic repulsion between nanoparticles, and then maintain the colloidal stability,34 by contrast, the electrostatic repulsion between nanoparticles will decrease with decreasing surface zeta potential.34,35 Hence, negatively charged T-RRE will enhance the electrostatic repulsion and dispersion stability of AgNPs@Cit and AgNPs@PVP. However, T-RRE will decrease the electrostatic repulsion between AgNPs@PEI. Additionally, T-RRE can induce the aggregation of AgNPs@PEI by electrostatic interaction. Because of the high zeta potential, H-RRE displayed a stronger ability to induce the aggregation of AgNPs@PEI compared with L-RRE.
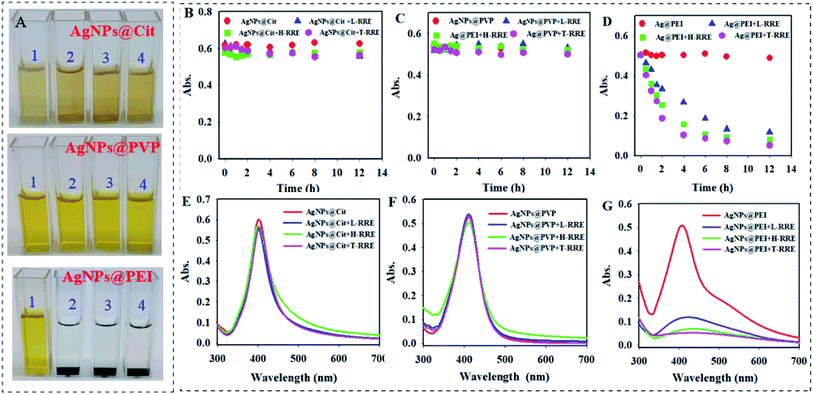
During the experiment, it was found that T-RRE, L-RRE, and H-RRE can further result in the sedimentation of AgNPs@PEI and a sedimented layer would be formed at the bottom of cuvettes after 12 h (Fig. 4A). However, AgNPs@Cit and AgNPs@PVP can maintain a stable dispersion state. Therefore, the settling behavior of three kinds of AgNPs in the presence of T-RRE, L-RRE, and H-RRE was observed by measuring the change in absorbance at 410 nm. In the presence of T-RRE, L-RRE, and H-RRE, AgNPs@Cit and AgNPs@PVP were stable because the absorption value did not show obvious change (Fig. 4B and C). However, 79.3%, 68.7%, and 46.8% loss of absorbance only within 4 h was observed for AgNPs@PEI added with T-RRE, L-RRE, or H-RRE, respectively (Fig. 4D). The effect of T-RRE, L-RRE, and H-RRE on the sedimentation trends of the three kinds of AgNPs also can be verified from the change of absorption spectrum at 12 h (Fig. 4E–G). The sedimentation behavior will influence the mobility and bioavailability of nanoparticles in environmental media, which implies that RRE may have different effects on the dissolution and bioavailability of AgNPs@Cit, AgNPs@PVP and AgNPs@PEI.
3.3 Effect of RRE on dissolution of AgNPs
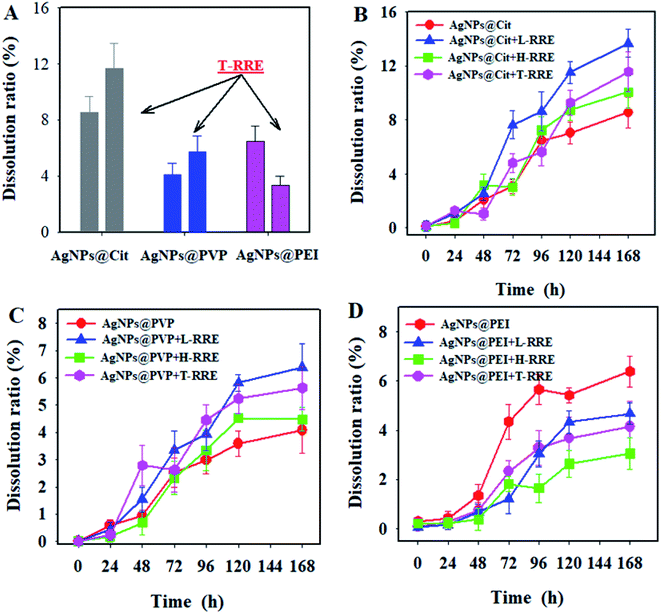
Silver ions released through the dissolution of AgNPs are one of the most toxic species for organisms.36,37 The concentration of dissolved silver ions from the three kinds of AgNPs was monitored after 168 h of incubation with and without T-RRE. As shown in Fig. 5A, the dissolution ratios of AgNPs@Cit, AgNPs@PVP, and AgNPs@PEI without the addition of T-RRE were 8.56%, 4.08%, and 6.49%, respectively. In the presence of T-RRE, the dissolution ratio of AgNPs@Cit was approximately 1.4 times higher than that in the absence of T-RRE. The dissolution ratio of AgNPs@PVP also increased. However, the dissolution ratio of AgNPs@PEI obviously decreased from 6.49% to 3.36%. Batch dissolution studies were further conducted to figure out which fraction of T-RRE plays a major role in promoting and hindering the dissolution of AgNPs. Fig. 5B shows that AgNPs@Cit began to dissolve obviously after 48 h of incubation. L-RRE and H-RRE promoted AgNPs@Cit dissolution by 13.69% and 10.08% within 168 h of incubation, respectively. The contribution of L-RRE in the AgNPs@Cit dissolution was more pronounced (Fig. S3†). L-RRE also obviously promoted the dissolution of AgNPs@PVP (Fig. 5C and S3†). This finding was supported by Shang et al., who reported that small molecular RE can obviously promote the dissolution of CuO NPs.24 As shown in Fig. 5D, the dissolution AgNPs@PEI will be hindered by L-RRE and H-RRE with low dissolution ratio. The lowest dissolution ratio of AgNPs@PEI was observed in the presence of H-RRE (Fig. S3†), indicating that H-RRE plays a relatively important role in hindering the dissolution of AgNPs@PEI. In general, the results indicated that L-RRE can promote the dissolution of AgNPs@Cit with negative surface charge, while H-RRE has an obvious role of hindering the dissolution of AgNPs@PEI with positive surface charge. Free metal ions dissolved from the metal nanoparticles are composed of ligand-assisted dissolution process.38 Root exudates consists of monosaccharides, organic acids, amino acids, fatty acids, polysaccharides, proteins and so on. Organic acids and amino acids can act as organic ligands to complex metal ions, which will reduce free metal ions concentrations in solutions and promote the dissolution of nanoparticles.24,39 The dissolution of AgNPs promoted by L-RRE may be attributed to the formation of soluble Ag-organic ligand complexes.The AgNPs dissolution is oxidative dissolution through reaction of metallic Ag with dissolved oxygen and protons following reactions.40
| 4Ag(S) + O2 = 2Ag2O(S) | (1) |
| Ag2O(S) + 2H+ = 2Ag+ + H2O | (2) |
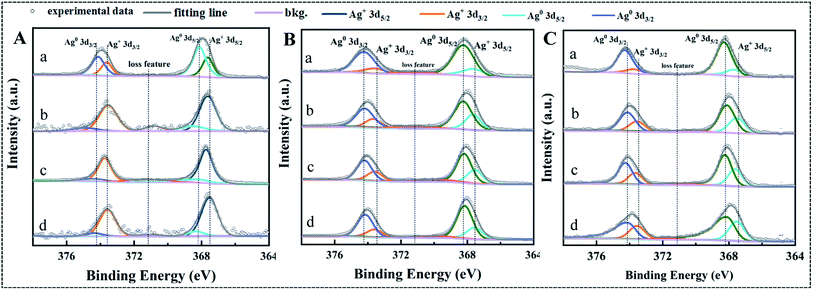
Dissolution by oxidation of metallic Ag on the surface of AgNPs is initiated by dissolved O2 and formation a 1–2 atomic layer thick silver oxide (Ag2O).41,42 Then, Ag ions will be released into solution with the dissolution of Ag2O layer.41,42 XPS analysis was carried out to confirm the effect of T-RRE, L-RRE and H-RRE on the valence state change of Ag on the surface of AgNPs (Fig. 6). The Ag 3d XPS spectra of three kinds of AgNPs was fitted by two peaks that were assigned to Ag0 and Ag+ (Ag2O).43 The atomic relative percentages of Ag0 and Ag+ corresponding to the characteristic peaks of Ag 3d5/2 and Ag 3d3/2 was summarized in Table S1.† In the presence of T-RRE, more Ag0 was transformed into Ag+ on the surface of AgNPs@Cit compared with that of AgNPs@PVP and AgNPs@PEI. Besides, higher atomic relative percentages of Ag+ were also found on the surface of AgNPs@Cit in the presence of L-RRE. However, no obvious change in the atomic relative percentages of Ag0 and Ag+ on the surface of AgNPs@PEI was observed in the presence of RRE. In the presence of L-RRE, high Ag+ content on the surface of AgNPs@Cit will potentially increase the release of Ag ions. It was reported that aggregation and size increase will reduce surface to volume ratios and surface reaction sites of nanoparticles.41,44 In the presence of T-RRE, H-RRE, and L-RRE, the low dissolution ratio of AgNPs@PEI could be due to the aggregation limits the dissolved O2 and protons to reaction sites, which will reduce the formation of Ag2O layer and hinder the dissolution of silver ions.
3.4 Effect of RRE on bioaccumulation of Ag in rice roots
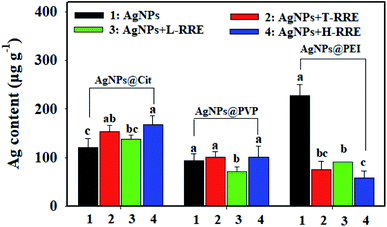
The bioavailability of nanoparticles highly depends on their stabilization state.45 The effect of RRE on the bioavailability of AgNPs was investigated by determining the total Ag content in rice root after 7 days of exposure to 10 mg L−1 of AgNPs in the presence T-RRE, L-RRE or H-RRE. The total Ag content in the rice roots after exposure to AgNPs@Cit, AgNPs@PVP, and AgNPs@PEI were approximately 121.62, 93.26 and 227.33 μg g−1, respectively (Fig. 7). The total Ag content in the rice roots after exposure to AgNPs@PEI was significantly higher than that in the roots exposed to AgNPs@PVP and AgNPs@Cit. This finding is mainly attributed to the fact that positively charged nanoparticles are more easily adsorbed on the surface of roots and then be uptaked by plants compared with negatively charged nanoparticles.46,47 After exposure to AgNPs@Cit, the relatively high Ag content was detected in the rice roots added with T-RRE. Contrary to our expectation, although L-RRE could more obviously promote the dissolution of AgNPs@Cit than H-RRE, the higher accumulation of Ag was not observed in the presence of L-RRE compared with that in the presence of H-RRE. In terms of AgNPs@PVP, although T-RRE and H-RRE did not significantly change the accumulation of Ag, the Ag content was relatively decreased upon the addition of L-RRE. Some small molecular RE (e.g., L-cysteine, cysteine and glutathione) can serve as ligands and form complexes with metal ion released from MNPs, which will reduce the uptake of metal ion by plant roots.12 Therefore, L-RRE can decrease the accumulation of silver in a certain extent, which may be related to the formation of complexes between some small molecules and silver ions. Similar phenomena have been reported. For example, low-molecular-weight natural organic matter increased the dissolution of AgNPs in the medium but did not alter the uptake of AgNPs by nematodes.48 Given that we did not discriminate the free silver ions and silver ions complexes during the dissolution of AgNPs under the influence of RRE, the effect mechanism of L-RRE on the uptake of AgNPs by rice roots remains to be further explored. Compared with T-RRE and L-RRE, H-RRE is more effective in reducing Ag accumulation in rice roots after exposure to AgNPs@PEI. It can be explained the formation of agglomerates tends to decrease the bioavailability associated with limited nanoparticle uptake and translocation of nanoparticles.49–534. Conclusions
This study demonstrated that T-RRE and its two fractions (L-RRE and H-RRE) present different effects on the aggregation and dissolution of differently-charged AgNPs. T-RRE can induce the aggregation and hinder the dissolution of positively charged AgNPs, and H-RRE play a critical role. T-RRE has no obvious effect on the dispersion stability of negatively charged and near electrically neutral AgNPs, but it can promote their dissolution, and L-RRE presents obvious effects. H-RRE can hinder the bioaccumulation of Ag in the rice roots for positively charged AgNPs. L-RRE can alleviate the accumulation of silver to a certain extent. These findings provide a foundation for further investigation of the interactions between RE and nanoparticles with different surface charges in complex environmental systems. Further studies will be extended to obtain insights regarding the effect of RE on the aggregation, dissolution, and bioaccumulation of AgNPs in the soil or aquatic system. Moreover, given the complex molecular composition of RE, its effects on the aggregation, dissolution, and bioaccumulation of AgNPs will be considered from the level of composition of RE.Conflicts of interest
The authors declare no competing financial interests.Abbreviations
| MNPs | Metal nanoparticles |
| AgNPs | Silver nanoparticles |
| AgNPs@PEI | Polyethyleneimine-coated AgNPs |
| AgNPs@Cit | Citrate-coated AgNPs |
| AgNPs@PVP | Polyvinylpyrrolidone-coated AgNPs |
| RE | Root exudates |
| T-RRE | Total rice root exudates |
| H-RRE | High-molecular-weight root exudates |
| L-RRE | Low-molecular-weight root exudates |
Acknowledgements
This work was financially supported by the Natural Science Foundation of Shanxi Province of China (No. 201901D111284, 201901D211390) and innovation experiment program for university students of Shanxi Province (2020DCXM-035).References
- M. Usman, M. Farooq, A. Wakeel, A. Nawaz, S. A. Cheema, H. U. Rehman, I. Ashraf and M. Sanaullah, Sci. Total Environ., 2020, 721, 137778 CrossRef CAS PubMed.
- V. A. Ho, P. T. Le, T. P. Nguyen, C. K. Nguyen, V. T. Nguyen and N. Q. Tran, J. Nanomater., 2015, 1–7 CAS.
- S. W. Kim, J. H. Jung, K. Lamsal, Y. S. Kim, J. S. Min and Y. S. Lee, Mycobiology, 2012, 40(1), 53–58 CrossRef CAS PubMed.
- C. C. Li, F. Dang, M. Li, M. Zhu, H. Zhong, H. Hintelmann and D. M. Zhou, Nanotoxicology, 2017, 11(5), 699–709 CrossRef CAS PubMed.
- M. J. Ke, Q. Qu, W. J. G. M. Peijnenburg, X. X. Li, M. Zhang, Z. Y. Zhang, T. Lu, X. L. Pan and H. F. Qian, Sci. Total Environ., 2018, 644, 1070–1079 CrossRef CAS PubMed.
- S. D. Gupta, A. Agarwal and S. Pradhan, Ecotoxicol. Environ. Saf., 2018, 161, 624–633 CrossRef CAS PubMed.
- R. M. Galazzi, C. A. Lopes Júnior, T. B. de Lima, F. C. Gozzo and M. A. Z. Arruda, J. Proteomics, 2019, 191, 88–106 CrossRef CAS PubMed.
- Y. Sakka, L. M. Skjolding, A. Mackevica, J. Filser and A. Baun, Aquat. Toxicol., 2016, 177, 526–535 CrossRef CAS PubMed.
- V. K. Sharma, K. M. Siskova, R. Zboril and J. L. Gardea-Torresdey, Adv. Colloid Interface Sci., 2014, 204, 15–34 CrossRef CAS PubMed.
- Y. Li, H. Y. Chen, F. Wang, F. R. Zhao, X. M. Han, H. H. Geng, L. Gao, H. L. Chen, R. F. Yuan and J. Yao, Environ. Pollut., 2018, 243, 1334–1342 CrossRef CAS PubMed.
- L. Gutierrez, A. Schmid, N. Zaouri, D. Garces and J. P. Croue, NanoImpact, 2020, 19, 100242 CrossRef.
- M. Li, F. Dang, Q. L. Fu, D. M. Zhou and B. Yin, Environ. Sci.: Nano, 2018, 5(4), 969–979 RSC.
- Y. Yang, S. M. Zheng, R. X. Li, X. Chen, K. K. Wang, B. B. Sun, Y. Q. Zhang and L. Y. Zhu, Environ. Sci.: Nano, 2021, 8(3), 748–757 RSC.
- I. Fernando, D. Lu and Y. Zhou, Environ. Sci.: Nano, 2020, 7(1), 186–197 RSC.
- C. M. Rico, S. Majumdar, M. Duarte-Gardea, J. R. Peralta-Videa and J. L. Gardea-Torresdey, J. Agric. Food Chem., 2011, 59(8), 3485–3498 CrossRef CAS PubMed.
- L. J. Zhao, Y. X. Huang, J. Hu, H. J. Zhou, A. S. Adeleye and A. A. Keller, Environ. Sci. Technol., 2016, 50, 2000–2010 CrossRef CAS PubMed.
- D. V. Badri and J. M. Vivanco, Plant, Cell Environ., 2009, 32(6), 666–681 CrossRef CAS.
- H. J. Fu, H. Y. Yu, T. X. Li and X. Z. Zhang, Ecotoxicol. Environ. Saf., 2018, 150(15), 168–175 CrossRef CAS PubMed.
- Y. T. Chen, Y. Wang and K. C. Yeh, Curr. Opin. Plant Biol., 2017, 39, 66–72 CrossRef CAS PubMed.
- P. P. Du, Y. H. Huang, H. X. Lü, L. Xiang, Y. W. Li, H. Li, C. H. Mo, Q. Y. Cai and Q. X. Li, Environ. Res., 2020, 186, 109611 CrossRef CAS PubMed.
- L. Qin, Z. Li, B. Li, J. X. Wang, Y. Q. Zu, M. Jiang and Y. Li, Environ. Contam. Toxicol., 2021, 107, 1059–1064 CrossRef CAS PubMed.
- M. M. Montiel-Rozas, E. Madejón and P. Madejón, Environ. Pollut., 2016, 216, 273–281 CrossRef CAS PubMed.
- Y. X. Huang, L. J. Zhao and A. A. Keller, Environ. Sci. Technol., 2017, 51(17), 9774–9783 CrossRef CAS PubMed.
- H. P. Shang, H. Y. Guo, C. X. Ma, C. Y. Li, B. Chefetz, T. Polubesova and B. S. Xing, Sci. Total Environ., 2019, 690, 502–510 CrossRef CAS PubMed.
- P. Cervantes-Avilés, X. N. Huang and A. A. Keller, Environ. Sci. Technol., 2021, 55(20), 13443–13452 CrossRef PubMed.
- Y. Y. Bao, J. Y. Ma, C. G. Pan, A. Y. Guo, Y. X. Li and B. S. Xing, Chemosphere, 202, 240, 124897 CrossRef PubMed.
- S. Skoglund, E. Blomberg, I. O. Wallinder, I. Grillo, J. S. Pedersen and L. M. Bergström, Phys. Chem. Chem. Phys., 2017, 19(41), 28037–28043 RSC.
- S. H. Chen and D. L. Carroll, J. Phys. Chem. B, 2004, 108(18), 5500–5506 CrossRef CAS.
- A. M. El Badawy, R. G. Silva, B. Morris, K. G. Scheckel, M. T. Suidan and T. M. Tolaymat, Environ. Sci. Technol., 2011, 45(1), 283–287 CrossRef CAS PubMed.
- Z. Wang, X. Xie, J. Zhao, X. Liu, W. Feng, J. C. White and B. S. Xing, Environ. Sci. Technol., 2012, 46, 4434–4441 CrossRef CAS PubMed.
- M. Chen, H. H. Cai, F. Yang, D. Lin, P. H. Yang and J. Y. Cai, Spectrochim. Acta, Part A, 2014, 118(24), 776–781 CrossRef CAS PubMed.
- L. K. Limbach, R. Bereiter, E. Müller, R. Krebs, R. Gälli and W. J. Stark, Environ. Sci. Technol., 2008, 42(15), 5828–5833 CrossRef CAS PubMed.
- Y. J. Wang, P. P. Chen, G. S. Zhao, K. Sun, D. X. Li, X. C. Wan and J. S. Zhang, Food Chem. Toxicol., 2015, 85, 71–77 CrossRef CAS PubMed.
- X. X. Ye, H. Y. Li, Q. Y. Wang, R. S. Chai, C. Ma, H. J. Gao and J. D. Mao, Ecotoxicol. Environ. Saf., 2018, 148, 418–425 CrossRef CAS PubMed.
- Y. J. Jung, G. Metreveli, C. B. Park, S. Baik and G. E. Schaumann, Environ. Sci. Technol., 2018, 52(2), 436–445 CrossRef CAS PubMed.
- L. Z. Li, H. F. Wu, W. J. G. M. Peijnenburg and C. A. M. van Gestel, Nanotoxicology, 2015, 9(6), 792–801 CrossRef CAS PubMed.
- J. N. Meyer, C. A. Lord, X. Y. Yang, E. A. Turner, A. R. Badireddy, S. M. Marinakos, A. Chilkoti, M. Wiesner and M. Auffan, Aquat. Toxicol., 2010, 100(2), 140–150 CrossRef CAS PubMed.
- S. K. Misra, A. Dybowska, D. Berhanu, S. N. Luoma and E. Valsami-jones, Sci. Total Environ., 2012, 438, 225–232 CrossRef CAS PubMed.
- X. Pan, J. Yang, D. Zhang, X. Chen and S. Mu, J. Biosci. Bioeng., 2011, 111, 193–197 CrossRef CAS PubMed.
- J. Y. Liu and R. H. Hurt, Environ. Sci. Technol., 2010, 44(6), 2169–2175 CrossRef CAS PubMed.
- G. A. Sotiriou, A. Meyer, J. T. N. Knijnenburg, S. Panke and S. E. Pratsinis, Langmuir, 2012, 28(45), 15929–15936 CrossRef CAS PubMed.
- T. S. Peretyazhko, Q. B. Zhang and V. L. Colvin, Environ. Sci. Technol., 2014, 48(20), 11954–11961 CrossRef CAS PubMed.
- P. Prieto, V. Nistor, K. Nouneh, M. Oyama, M. Abd-Lefdil and R. Díaz, Appl. Surf. Sci., 2012, 258(22), 8807–8813 CrossRef CAS.
- J. Dobias and R. Bernier-Latmani, Environ. Sci. Technol., 2013, 47(9), 4140–4146 CrossRef CAS PubMed.
- C. Levard, E. M. Hotze, G. V. Lowry and G. E. Brown, Environ. Sci. Technol., 2012, 46(13), 6900–6914 CrossRef CAS PubMed.
- J. L. Zhang, Q. Q. Xiang, L. Shen, J. Ling, C. H. Zhou, J. M. Hu and L. Q. Chen, Chemosphere, 2020, 247, 125936 CrossRef CAS PubMed.
- P. Cvjetko, A. Milošić, A. M. Domijan, I. Vinković Vrček, S. Tolić, P. Peharec Štefanić, I. Letofsky-Papst, M. Tkalec and B. Balen, Ecotoxicol. Environ. Saf., 2017, 137, 18–28 CrossRef CAS PubMed.
- X. Y. Yang, C. J. Jiang, H. Hsu-Kim, A. R. Badireddy, M. Dykstra, M. Wiesner, D. E. Hinton and J. N. Meyer, Environ. Sci. Technol., 2014, 48(6), 3486–3495 CrossRef CAS PubMed.
- E. M. Hotze, T. Phenrat and G. V. Lowry, J. Environ. Qual., 2010, 39(6), 1909–1924 CrossRef CAS PubMed.
- B. Reidy, A. Haase, A. Luch, K. A. Dawson and I. Lynch, Materials, 2013, 6(6), 2295–2350 CrossRef CAS PubMed.
- G. A. Sotiriou and S. E. Pratsinis, Environ. Sci. Technol., 2010, 44(14), 5649–5654 CrossRef CAS PubMed.
- P. Wang, N. W. Menzies, E. Lombi, B. A. McKenna, B. Johannessen, C. J. Glover, P. Kappen and P. M. Kopittke, Environ. Sci. Technol., 2013, 47(23), 13822–13830 CrossRef CAS PubMed.
- Y. J. Ha, X. Z. Wang, H. M. Liljestrand, J. A. Maynard and L. E. Katz, Environ. Sci. Technol., 2016, 50(13), 6717–6727 CrossRef CAS PubMed.
Footnote |
| † Electronic supplementary information (ESI) available. See DOI: 10.1039/d2ra00229a |
| This journal is © The Royal Society of Chemistry 2022 |

