 Open Access Article
DeNOx performance enhancement of Cu-based oxides via employing a TiO2 phase to modify LDH precursors†
Yali Du‡
a,
Xuezhen Liu‡ab,
Jiangning Liub,
Rongting Dub and
Xu Wu *bc
*bc
aCollege of Chemistry and Chemical Engineering, Jinzhong University, Jinzhong 030619, P. R. China
bCollege of Chemistry and Chemical Engineering, Taiyuan University of Technology, Taiyuan 030024, P. R. China. E-mail: wuxu@tyut.edu.cn; Fax: +86-351-6018528; Tel: +86-351-6018528
cShanxi Huadun Industrial Co., Ltd, Taiyuan 030062, China
First published on 31st March 2022
Abstract
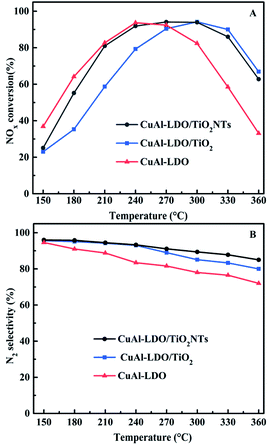
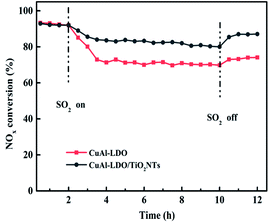
CuAl-LDO, CuAl-LDO/TiO2 and CuAl-LDO/TiO2NTs catalysts were obtained from TiO2 modified LDHs precursor which were prepared by in situ assembly method. Then catalysts were evaluated in the selective catalytic reduction of NOx with NH3(NH3-SCR), and the results showed that the CuAl-LDO/TiO2NTs catalyst exhibited preferable deNOx performance (more than 80% NOx conversion and higher than 90% N2 selectivity at a temperature range of 210–330 °C) as well as good SO2 resistance. With the aid of series of characterizations such as XRD, N2 adsorption/desorption, XPS, NH3-TPD, H2-TPR, and in situ DRIFTS, it could be concluded that, doping TiO2NTs afforded the catalyst larger specific surface area, more abundant surface chemisorption oxygen species and more excellent redox performance. Meanwhile, In situ DRIFTS evidenced that CuAl-LDO/TiO2NTs catalyst has a strong adsorption capacity for the reaction gas, which is more conducive to the progress of the SCR reaction.
1 Introduction
Nitrogen oxides (NOx), released from stationary sources (such as coal-fired power plants), are major atmospheric pollutants which seriously threaten the ecological environment and human health.1,2 Selective catalytic reduction with NH3 (NH3-SCR) is considered as one of the most efficient technologies for removing NOx.3–5 Nowadays, the commercial V2O5-WO3/TiO2 catalysts are widely applied in the NH3-SCR field and exhibit excellent catalytic activity in the temperature range of 300–400 °C.3,6,7 However, there are still some practical problems of the catalysts, such as the toxicity of vanadium, low N2 selectivity due to the formation of N2O and high conversion of SO2 to SO3 at high temperature.8,9 Generally, the poison of SO2 and dust can be avoided by placing an SCR reactor behind the dust removal and desulfurization equipment, resulting in the debasement of exit gas temperature, which cannot meet the optimum activity temperature window of V2O5-WO3/TiO2 catalysts.10–12 Thus, it would be necessary to develop more efficient and eco-friendlier deNOx catalysts with non-vanadium-based at low temperatures.At the present stage, many researchers consider the copper oxides as a potential candidate for the low-temperature SCR catalysts, including pure copper oxides, copper-based composite oxides and supported copper-based catalysts.13–16 Among them, copper-based composite oxides catalysts with excellent catalytic performance have recently attracted much attention. In recent years, it is well known that layered double oxides (LDO) from layered-double hydroxides (LDHs) demonstrated fine reaction activity in NH3-SCR, especially the typical CuAl-LDO catalyst.17,18 For instance, Yan et al. reported a high-performance Cu-based oxides catalyst prepared from CuAl-LDHs precursor.19 In our previous work, it is also found that the CuAl-LDO catalysts derived from LDHs demonstrated better reaction activity in NH3-SCR.18 However, due to its insufficient acidity, the CuAl-LDO catalyst afforded poor reaction activity at medium and high temperature in NH3-SCR, which limited its further application.
As well known, titanium dioxide (TiO2) has been found to be a valuable and environmentally friendly material with stable chemical properties.20 At the same time, for transition metal oxide catalyst, the introduction of TiO2 could improve the acid sites and chemical adsorption oxygen over the catalyst surface, enhance the adsorption and activation of NH3 as well as resistance of SO2.21–24 Based on the characteristic advantages of LDHs and TiO2, it is promising to prepare well-behaved Cu–Ti composite oxide catalysts derived by LDHs. However, due to the Jahn–Teller distortion of Cu2+ ions, it is difficult to prepare CuTi-based LDHs by one step preparation. Here, desirable SCR catalyst of CuAl-LDO/TiO2 was tentatively fabricated by modifying CuAl-LDHs with TiO2 phase.
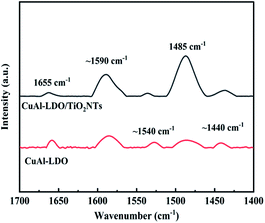
Herein, the CuAl-LDHs with titanium-based materials were assembled and calcined at high temperature. Subsequently, the catalytic performance of the obtained composite oxide catalysts was evaluated in NH3-SCR reaction. At the same time, the structural characteristics and the SCR performance of the catalysts were explored through a series of characterizations, such as XRD, N2 adsorption/desorption, TEM, XPS, H2-TPR, NH3-TPD. The intrinsic difference between CuAl-LDO and CuAl-LDO/TiO2NTs catalysts derived by LDHs over the deNOx activity was studied by In situ DRIFTS. This research might provide significant reference value for LDHs precursor in SCR application.
2 Materials and methods
2.1. Materials
TiO2(P25), Cu(NO3)2·3H2O(99%), Al(NO3)3·9H2O(99%), NaOH(96%) and Na2CO3(99%) were obtained from the Sinopharm Chemical Reagent Company. All chemicals were of analytical grade and were employed without further purification.2.2. Sample preparation
2.3. Catalyst characterization
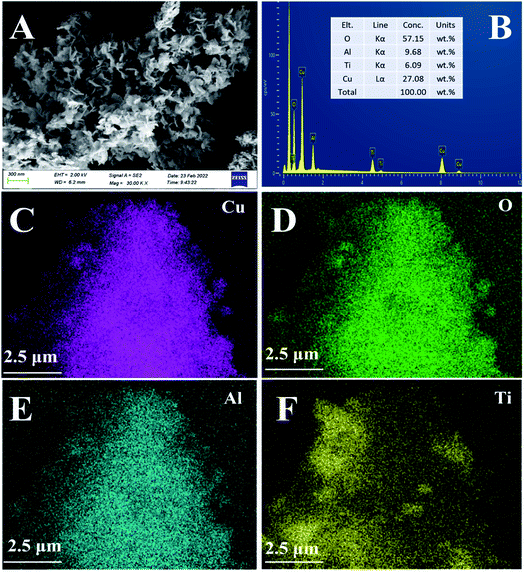
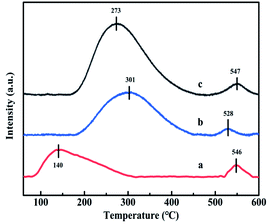
The phase structure of the LDHs and catalyst samples was analyzed by the Rigaku DX-2700 X-ray diffractometer instrument, with Cu/Kα radiation (λ = 1.54184 Å) at the 2θ of 5° to 85°. The morphology of the precursors was scanned and analyzed by the scanning electron microscope (SEM, Hitachi's SU8010 JEOL). The morphology and surface atomic concentration of catalyst was scanned and analyzed by SEM and EDS-mapping (Carl Zeiss GeminiSEM300, Germany). The surface textural structures of catalysts were operated on the ASAP-2460 physical adsorption instrument (Micromeritics, USA) at −196 °C. Brunauer–Emmett–Teller (BET) method and Barrett–Joyner–Halenda (BJH) model were used to calculated the specific surface area, pore volume and pore diameter of catalysts. The transmission electron microscope (TEM) analysis was used to research the morphology images of the catalysts by JEM-2100F, JEOL microscope with an accelerating voltage of 200 kV. The surface property of the catalysts was analyzed by X-ray photoelectron spectroscopy (XPS, Thermo Fisher ESCALAB 250xi, England) with Al Kα radiation (hν = 1486.6 eV). Both NH3-temperature programmed desorption (NH3-TPD) and H2 temperature-programmed reduction (H2-TPR) tests were performed on the FINESORB-3010 temperature programmed adsorption instrument (Zhejiang Pantech) with using 80 mg catalysts. For NH3-TPD test, the catalysts were pretreated in He atmosphere at 150 °C for 1 h, and then cooled to 50 °C in the same stream. Then the input gas was shifted a 3% NH3 + He (25 mL min−1) mixed atmosphere at 50 °C, and the adsorption in this atmosphere lasted for 30 minutes. Before starting the TPD experiment, the catalyst was flushed with He at a flow rate of 30 mL min−1 to remove physically adsorbed NH3 on its surface. The desorption process was performed by heating the samples in He (30 mL min−1) from 50 °C to 600 °C at a heating rate of 10 °C min−1, the data was detected and recorded online by a thermal conductivity detector (TCD), then analyzed by the Origin software. Each desorption peak was integrated to obtain the corresponding peak area, as well as the total acid content and the ratio of strong and weak acid sites were calculated. For H2-TPR experiment, 80 mg catalyst (particle size: 40–60 mesh) was putted into a laboratory-made quartz tube, and pre-treated in pure Ar atmosphere (flow rate: 20 mL min−1) for 1 h at 300 °C. Then cooled down the temperature to 30 °C and stabilize for a period of time, followed by changing the gas to 10% H2/Ar, and the reduction process occurred from 30 °C to 600 °C at a heating rate of 10 °C min−1. The corresponding data was detected and recorded by TCD. Origin software was employed to fit the H2-TPR curve through splitting the peaks, and calculate the hydrogen consumption based on the peak area. In situ diffuse reflectance infrared Fourier transform spectroscopy (In situ DRIFTS) experiments were performed using In situ infrared spectrometer (Bruker TENSOR 27) from Germany, with a Pike DRIFTS sample cell and a high-precision MCT detector cooled by liquid nitrogen. At first, the sample was pretreated at 300 °C under N2 about 10 min, and the background spectrum was collected in the same condition at the test temperature (240 °C). Then, each spectrum was recorded by subtracting the background spectrum in the range of 2000–1000 cm−1. The gas flow during reaction process included: 600 ppm NO, 600 ppm NH3, 5 vol% O2, 100 ppm SO2, with N2 as the balance gas. The acid sites over the samples were investigated by infrared spectroscopy of adsorbed pyridine (Py-IR) using Bruker INVENIO S from Germany. The spectra were recorded with 2 cm−1 spectral resolution on a Frontier FT-IR Spectrometer at 240 °C.2.4. SCR activity test
The NH3-SCR performance of the catalysts (40–60 mesh) was tested over the fixed-bed quartz tube reactor. The reaction gas was set as follows: 600 ppm NO, 600 ppm NH3, 5 vol% O2, 100 ppm SO2 (when used), with N2 as the balance gas and the space velocity (GHSV) was 45![[thin space (1/6-em)]](https://www.rsc.org/images/entities/char_2009.gif) 000 h−1. Experimental configurations for evaluating catalytic performance were presented in Fig. S1.†
000 h−1. Experimental configurations for evaluating catalytic performance were presented in Fig. S1.†
The IR flue gas analyser (MKS) was hired to detect online gas concentration and recorded the reaction data in a steady state at each temperature point (from 150–360 °C with 30 °C as an interval). NOx conversion and N2 selectivity were calculated by eqn (1) and (2):
 | (1) |
 | (2) |
In the above formula, the subscript “[X]in” and “[X]out” indicate the inlet and outlet concentration of gas in a steady state flow mode, respectively.
3 Results and discussion
3.1. Catalytic performance of the catalysts
3.2. XRD patterns and SEM images of LDHs precursors
The XRD patterns of TiO2, TiO2NTs (prepared by the hydrothermal method), CuAl-LDHs, CuAl-LDHs/TiO2 and CuAl-LDHs/TiO2NTs are presented in Fig. 3. For TiO2 and TiO2NTs, it could be confirmed that the diffraction peaks at 25.3°, 37.8°, 48.1°, 53.9°, 55.1°, 62.7°, 68.8°, 70.3° and 75.1° might be assigned to the crystal planes of anatase TiO2 phase (JCPDS # 21-1272).20,23 The peaks located at 11.9°, 23.8°, 34.8°, 39.1° and 60.9° in CuAl-LDHs, CuAl-LDHs/TiO2 and CuAl-LDHs/TiO2NTs were corresponded to the (003), (006), (012), (015) and (110) crystal planes of LDHs (JCPDS # 35-0964), respectively, indicating the successful preparation of LDHs precursors.18,19 For CuAl-LDHs/TiO2NTs and CuAl-LDHs/TiO2, the peaks around 25.28°, 36.95°, 37.80° and 48.05° could be ascribed to the (101), (103), (004) and (200) of anatase. The TEM images of TiO2NTs are presented in Fig. S4(A) and (B).† The TiO2NTs has a regular morphology and a complete hollow tubular structure.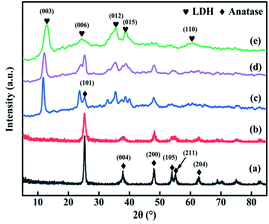 | ||
| Fig. 3 The XRD patterns of (a) TiO2(P25), (b) TiO2NTs, (c) CuAl-LDHs/TiO2NTs, (d) CuAl-LDHs/TiO2 and (e) CuAl-LDHs. | ||
The SEM images of CuAl-LDHs, CuAl-LDHs/TiO2 and CuAl-LDHs/TiO2NTs are displayed in Fig. 4. It could be seen from SEM images that all samples displayed morphology of assembled nanosheets, which was the typical structure of LDHs, thus further witnessing the successful preparation of LDHs. As shown Fig. 4(C), the nanosheets of CuAl-LDHs/TiO2NTs were effectively separated by TiO2NTs, which effectively alleviates the stacking and aggregation of LDHs laminates.
 | ||
| Fig. 4 The SEM images of the precursors: (A) CuAl-LDHs, (B) CuAl-LDHs/TiO2 and (C) CuAl-LDHs/TiO2NTs. | ||
3.3. Characterization of the catalysts
| Catalysts | SBET (m2 g−1) | Pore volume (cm³ g−1) | Pore diameter (nm) |
|---|---|---|---|
| CuAl-LDO | 49.7 | 0.35 | 27.3 |
| CuAl-LDO/TiO2 | 51.7 | 0.48 | 34.6 |
| CuAl-LDO/TiO2NTs | 80.5 | 0.67 | 28.7 |
| TiO2 | 55.8 | 0.19 | 14.8 |
| TiO2NTs | 192.8 | 0.8 | 15.2 |
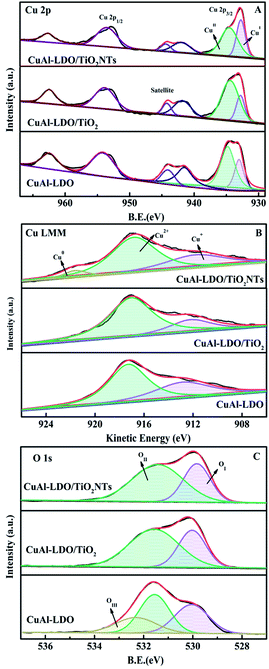 | ||
| Fig. 8 The XPS spectra of the CuAl-LDO, CuAl-LDO/TiO2 and CuAl-LDO/TiO2NTs catalysts: (A) Cu 2p, (B) Cu LMM XAES, and (C) O 1s. | ||
| Catalysts | Cu LMM XAES kinetic energy (eV) | Relative concentration ratio/% | |||
|---|---|---|---|---|---|
| Cu+ | Cu2+ | Cu0 | Cu+/(Cu2+ + Cu+)a | OII/(OI + OII) | |
| a Intensity ratio between Cu+ and (Cu+ + Cu2+) by deconvolution of Cu LMM XAES spectra. | |||||
| CuAl-LDO | 913.0 | 917.4 | — | 38.4 | 54.4 |
| CuAl-LDO/TiO2 | 914.0 | 917.2 | 920.6 | 24.1 | 62.3 |
| CuAl-LDO/TiO2NTs | 913.1 | 917.0 | 921.4 | 33.7 | 65.2 |
The O 1s spectra of the CuAl-LDO, CuAl-LDO/TiO2 and CuAl-LDO/TiO2NTs catalysts are showed in Fig. 8(C). As displayed in Fig. 8(C), the peaks at 530 eV could be assigned to the lattice oxygen species (denoted as OI), accompanied by the chemisorbed oxygen species (denoted as OII) located at 532 eV, which was closely related with the number of surface oxygen vacancies and defects of catalyst. Moreover, the peak at 533 eV for CuAl-LDO catalyst was corresponded to the adsorbed molecular water (denoted as OIII).27,28 Besides, due to the high mobility ratio, OII species were beneficial to the NO → NO2 process and favored to the “fast SCR” reaction, thus resulting in the enhancement of low temperature SCR activity.8 As listed in Table 2, the relative concentrations of OII/(OI + OII) for CuAl-LDO/TiO2NTs (65.2%) was higher than CuAl-LDO (54.4%) and CuAl-LDO/TiO2 (62.3%). It could be concluded that the CuAl-LDO/TiO2NTs owned more abundant surface oxygen than CuAl-LDO and CuAl-LDO/TiO2, which might be helpful to the improvement of catalytic activity.
| Catalysts | Reduction temperature (°C) | H2 consumptiona (mmol g−1) | Total amount of NH3 desorptionb | |
|---|---|---|---|---|
| T1 | T2 | |||
| a The H2 consumption of catalysts was calculated with CuO standard sample.b Normalized by the NH3 total desorption peak area of CuAl-LDO. | ||||
| CuAl-LDO | 190 | 240 | 1.3 | 1 |
| CuAl-LDO/TiO2 | 285 | 327 | 1.4 | 1.7 |
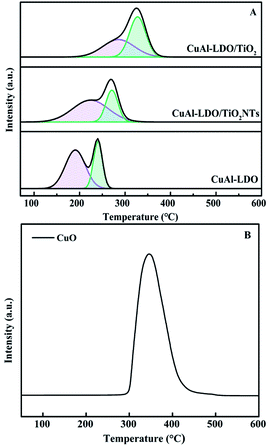
| CuAl-LDO/TiO2NTs | 224 | 271 | 1.5 | 2.7 |
3.4. In situ DRIFTS analysis
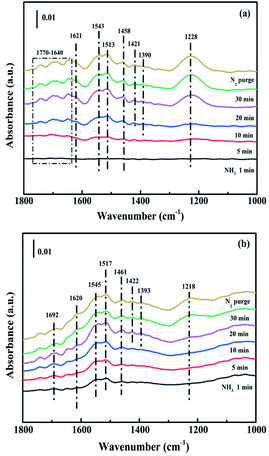
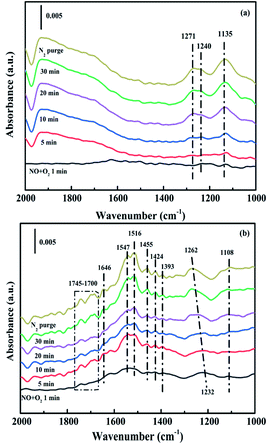
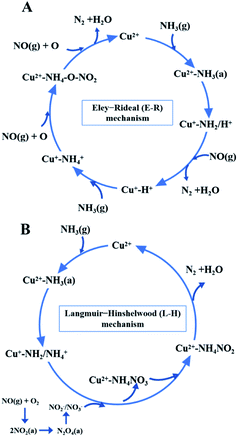
While for CuAl-LDO/TiO2NTs catalysts, the transient reaction spectra are displayed in Fig. 14(b) and (d). After pre-adsorption of NH3, the following bands emerged, NH4+ ions bounded on Brønsted acid site (1692 cm−1, 1461 cm−1 and 1422 cm−1), the symmetric and asymmetric vibration of NH3 species adsorbed on Lewis acid sites (1620 cm−1, 1545 cm−1 and 1218 cm−1), the –NH2 scissoring and wagging of N2H4 species (1517 cm−1 and 1393 cm−1).16,39,46 Further importing NO + O2, the intensity of all peaks gradually impaired, replaced by the arising of peak located at 1237 cm−1 corresponding to monodentate nitrate species. In comparison with the Fig. 13(b), there was no significant accumulation of nitrate species participating in the NH3-SCR reaction. When the reactant gases were introduced as the inverse order, the results are presented in Fig. 14(d). While NO + O2 were imported for 30 min, the corresponding species appeared as follows: the absorbed N2O4 (1745–1700 cm−1), bridged nitrate (1646 cm−1 and 1232 cm−1), bidentate nitrate (1547 cm−1 and 1516 cm−1), linear nitrite (1455 cm−1), monodentate nitrite (1424 cm−1, 1393 cm−1 and 1108 cm−1), monodentate nitrate (1262 cm−1).16,25,42,47 With an increase in the adsorption time of NH3, the bands of NOx species gradually reduced (1745–1700 cm−1, 1646 cm−1, 1547 cm−1, 1455 cm−1, 1424 cm−1, 1393 cm−1 1262 cm−1 and 1108 cm−1), accompanied by the emergence of bands located at 1619 cm−1 and 1232 cm−1, which were consistent with the asymmetric and symmetric bending vibrations of NH3 adsorbed on Lewis acid sites (1619 cm−1 and 1232 cm−1).13,48 Consequently, the NH3 species absorbed on the Lewis acid sites could react with nitrate and nitrite species on the surface of CuAl-LDO/TiO2NTs catalyst in the SCR reaction. The results indicated that CuAl-LDO/TiO2NTs catalysed the SCR reaction in both E–R mechanism and L–H mechanism. Based on In situ DRIFTS, the reaction mechanisms for CuAl-LDO/TiO2NTs catalyst were proposed, which was displayed in Fig. 15.
4 Conclusions
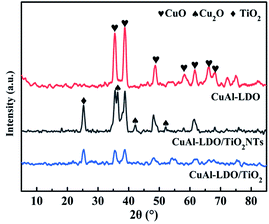
In summary, CuAl-LDO, CuAl-LDO/TiO2 and CuAl-LDO/TiO2NTs catalysts were obtained by calcining the LDHs precursor, and then applied in NH3-SCR reaction. The results demonstrated that the introduction of TiO2NTs with hollow tubular structure effectively avoided the stacking and accumulation of laminates during calcination process and enhanced the number of acidic sites on the catalyst. Consequently, the CuAl-LDO/TiO2NTs catalyst showed excellent NOx conversion, N2 selectivity as well as the good SO2 resistance. XRD results illustrated that a new phase of Cu2O was formed in the CuAl-LDO/TiO2NTs catalyst. Other characterization results indicated that the excellent deNOx performance of the CuAl-LDO/TiO2NTs catalyst depended on the synergistic effect between CuO and Cu2O, which could contribute to the larger surface area, more acidic sites, better redox performance, more abundant surface chemisorption oxygen species and stronger adsorption capacity of reactant gases. This work presents the preparation of Cu-based catalysts with wide temperature window via modifying LDHs template, which might serve as an important reference for LDHs precursor to be tailored in NH3-SCR filed.Author contributions
Yali Du: validation, formal analysis, writing – review & editing, funding acquisition. Xuezhen Liu: methodology, formal analysis, investigation, resources, data curation, writing – original draft. Jiangning Liu: writing – review & editing, formal analysis. Rongting Du: writing – review & editing. Xu Wu: conceptualization, funding acquisition, project administration, supervision.Conflicts of interest
There are no conflicts to declare.Acknowledgements
This work was supported by the National Natural Science Foundation of China (51978436), the National Natural Science Foundation of China (52000092), the Natural Science Foundation of Shanxi Province, China (201901D211445) and China Postdoctoral Science Foundation (2020M670706).References
- D. Damma, P. Ettireddy, B. Reddy and P. Smirniotis, Catalysts, 2019, 9, 349 CrossRef CAS.
- V. Praveena and M. L. J. Martin, J. Energy Inst., 2018, 91, 704–720 CrossRef CAS.
- M. Fu, C. Li, P. Lu, L. Qu, M. Zhang, Y. Zhou, M. Yu and Y. Fang, Catal. Sci. Technol., 2014, 4, 14–25 RSC.
- Q. Yan, S. Chen, L. Qiu, Y. Gao, D. O'Hare and Q. Wang, Dalton Trans., 2018, 47, 2992–3004 RSC.
- W. Wang, Z. Xiong, W. He, W. Lu and H. Shi, J. Energy Inst., 2021, 98, 322–333 CrossRef CAS.
- C. Chen, Y. Cao, S. Liu, J. Chen and W. Jia, Chin. J. Catal., 2018, 39, 1347–1365 CrossRef CAS.
- Z. Song, Y. Xing, X. Zhang, H. Zhao, M. Zhao, J. Zhao, Z. Ma and Q. Zhang, Appl. Organomet. Chem., 2019, 33, e5160 Search PubMed.
- C. Li, Z. Xiong, Y. Du, X. Ning, Z. Li, J. He, X. Qu, W. Lu, S. Wu and L. Tan, J. Energy Inst., 2020, 93, 1809–1818 CrossRef CAS.
- S. Zang, G. Zhang, W. Qiu, L. Song, R. Zhang and H. He, Chin. J. Catal., 2016, 37, 888–897 CrossRef CAS.
- Z. Fan, J.-W. Shi, C. Gao, G. Gao, B. Wang, Y. Wang, C. He and C. Niu, Chem. Eng. J., 2018, 348, 820–830 CrossRef CAS.
- K. Cheng, W. Song, Y. Cheng, H. Zheng, L. Wang, J. Liu, Z. Zhao and Y. Wei, RSC Adv., 2018, 8, 19301–19309 RSC.
- B. Hou, Y. Du, X. Liu, C. Ci, X. Wu and X. Xie, RSC Adv., 2019, 9, 24377–24385 RSC.
- S. Ali, L. Chen, Z. Li, T. Zhang, R. Li, S. H. Bakhtiar, X. Leng, F. Yuan, X. Niu and Y. Zhu, Appl. Catal. B Environ., 2018, 236, 25–35 CrossRef CAS.
- X. Gao, X. Du, L. Cui, Y. Fu, Z. Luo and K. Cen, Catal. Commun., 2010, 12, 255–258 CrossRef CAS.
- S. Suárez, J. A. Martín, M. Yates, P. Avila and J. Blanco, J. Catal., 2005, 229, 227–236 CrossRef.
- X. Yao, L. Zhang, L. Li, L. Liu, Y. Cao, X. Dong, F. Gao, Y. Deng, C. Tang, Z. Chen, L. Dong and Y. Chen, Appl. Catal. B Environ., 2014, 150–151, 315–329 CrossRef CAS.
- X. Wu, R. Wang, Y. Du, C. Zou, H. Meng and X. Xie, Mol. Catal., 2019, 467, 150–160 CrossRef CAS.
- X. Wu, H. Meng, Y. Du, J. Liu, B. Hou and X. Xie, J. Catal., 2020, 384, 72–87 CrossRef CAS.
- Q. Yan, Y. Nie, R. Yang, Y. Cui, D. O'Hare and Q. Wang, Appl. Catal. Gen., 2017, 538, 37–50 CrossRef CAS.
- R. Fan, Z. Li, Y. Wang, C. Zhang, Y. Wang, Z. Ding, X. Guo and R. Wang, RSC Adv., 2020, 10, 5845–5852 RSC.
- D. K. Pappas, T. Boningari, P. Boolchand and P. G. Smirniotis, J. Catal., 2016, 334, 1–13 CrossRef CAS.
- S.-A. Chen, J.-N. Nian, C.-C. Tsai and H. Teng, J. Air Waste Manage. Assoc., 2007, 57, 600–605 CrossRef CAS PubMed.
- Z. Cai, G. Zhang, Z. Tang and J. Zhang, ACS Appl. Nano Mater., 2021, 4, 6201–6211 CrossRef CAS.
- C. Liu, L. Chen, J. Li, L. Ma, H. Arandiyan, Y. Du, J. Xu and J. Hao, Environ. Sci. Technol., 2012, 46, 6182–6189 CrossRef CAS PubMed.
- D. Meng, W. Zhan, Y. Guo, Y. Guo, L. Wang and G. Lu, ACS Catal., 2015, 5, 5973–5983 CrossRef CAS.
- Z. He, H. Lin, P. He and Y. Yuan, J. Catal., 2011, 277, 54–63 CrossRef CAS.
- L. Dou, T. Fan and H. Zhang, Catal. Sci. Technol., 2015, 5, 5153–5167 RSC.
- Y. Geng, W. Shan, F. Liu and S. Yang, J. Hazard. Mater., 2021, 405, 124223 CrossRef CAS PubMed.
- M. Ma, R. Yang, Z. Jiang, C. Chen, Q. Liu, R. Albilali and C. He, Fuel, 2021, 303, 121244 CrossRef CAS.
- Q. Yan, Y. Gao, Y. Li, M. A. Vasiliades, S. Chen, C. Zhang, R. Gui, Q. Wang, T. Zhu and A. M. Efstathiou, Appl. Catal. B Environ., 2019, 255, 117749 CrossRef CAS.
- J. Zhang, H. Tian, Y. Yu, Z. Jiang, M. Ma and C. He, Catal. Lett., 2021, 151, 2502–2512 CrossRef CAS.
- Y. Liu, Y. Guan, C. Li, J. Lian, G. Gan, E. Lim and F. Kooli, J. Catal., 2006, 244, 17–23 CrossRef CAS.
- L. Sun, S. Cao, Y. Huang, Y. Zhang, Y. Xiao, G. Dong and Y. Su, RSC Adv., 2019, 9, 30340–30349 RSC.
- W. Yao, Y. Liu, X. Wang, X. Weng, H. Wang and Z. Wu, J. Phys. Chem. C, 2016, 120, 221–229 CrossRef CAS.
- L. Li, H. Yue, T. Ji, W. Li, X. Zhao, L. Wang, J. She, X. Gu and X. Li, Appl. Catal. Gen., 2019, 574, 25–32 CrossRef CAS.
- L. Chen, Z. Si, X. Wu and D. Weng, ACS Appl. Mater. Interfaces, 2014, 6, 8134–8145 CrossRef CAS PubMed.
- Q. Zhang, T. Zhang, F. Xia, Y. Zhang, H. Wang and P. Ning, Appl. Surf. Sci., 2020, 500, 144044 CrossRef CAS.
- J. Ma, Y. Li, J. Liu, Z. Zhao, C. Xu, Y. Wei, W. Song, Y. Sun and X. Zhang, Ind. Eng. Chem. Res., 2019, 58, 2389–2395 CrossRef CAS.
- C. Yu, B. Huang, L. Dong, F. Chen and X. Liu, Catal. Today, 2017, 281, 610–620 CrossRef CAS.
- Y. Wei, P. Zhang, J. Xiong, Q. Yu, Q. Wu, Z. Zhao and J. Liu, Environ. Sci. Technol., 2020, 54, 6947–6956 CrossRef CAS PubMed.
- H. Hu, S. Cai, H. Li, L. Huang, L. Shi and D. Zhang, J. Phys. Chem. C, 2015, 119, 22924–22933 CrossRef CAS.
- G. Zhou, B. Zhong, W. Wang, X. Guan, B. Huang, D. Ye and H. Wu, Catal. Today, 2011, 175, 157–163 CrossRef CAS.
- T. Zhang, R. Qu, W. Su and J. Li, Appl. Catal. B Environ., 2015, 176–177, 338–346 CrossRef CAS.
- L. Wei, S. Cui, H. Guo, X. Ma and L. Zhang, J. Mol. Catal. Chem., 2016, 421, 102–108 CrossRef CAS.
- Z. Zhang, L. Chen, Z. Li, P. Li, F. Yuan, X. Niu and Y. Zhu, Catal. Sci. Technol., 2016, 6, 7151–7162 RSC.
- R. Gao, D. Zhang, X. Liu, L. Shi, P. Maitarad, H. Li, J. Zhang and W. Cao, Catal. Sci. Technol., 2013, 3, 191–199 RSC.
- Y. Wen, S. Cao, X. Fei, H. Wang and Z. Wu, Chin. J. Catal., 2018, 39, 771–778 CrossRef CAS.
- Z. Liu, H. Liu, X. Feng, L. Ma, X. Cao and B. Wang, Mol. Catal., 2018, 445, 179–186 CrossRef CAS.
Footnotes |
| † Electronic supplementary information (ESI) available. See DOI: 10.1039/d2ra00316c |
| ‡ These authors contributed equally to this work. |
| This journal is © The Royal Society of Chemistry 2022 |

