 Open Access Article
Creative Commons Attribution 3.0 Unported Licence
Highly active postspinel-structured catalysts for oxygen evolution reaction†
Yuichi Okazaki a,
Seiji Odaa,
Akihiko Takamatsub,
Shogo Kawaguchic,
Hirofumi Tsukasakia,
Shigeo Moria,
Shunsuke Yagi
 d,
Hidekazu Ikeno*ae and
Ikuya Yamada
 *a
*a
aDepartment of Materials Science, Graduate School of Engineering, Osaka Prefecture University, 1-1 Gakuen-cho, Naka-ku, Sakai, Osaka 599-8531, Japan. E-mail: yamada@mtr.osakafu-u.ac.jp; ikeno@mtr.osakafu-u.ac.jp
bDepartment of Molecular Engineering, Graduate School of Engineering, Kyoto University, Kyoto Daigaku Katsura, Saikyo-ku, Kyoto 615-8510, Japan
cJapan Synchrotron Radiation Research Institute (JASRI), 1-1-1 Kouto, Sayo-cho, Sayo-gun, Hyogo 679-5198, Japan
dInstitute of Industrial Science, The University of Tokyo, 4-6-1 Komaba, Meguro-ku, Tokyo 153-8505, Japan
ePrecursory Research for Embryonic Science and Technology (PRESTO), Japan Science and Technology Agency (JST), 4-1-8 Honcho Kawaguchi, Saitama 332-0012, Japan
First published on 10th February 2022
Abstract
The rational design principle of highly active catalysts for the oxygen evolution reaction (OER) is desired because of its versatility for energy-conversion applications. Postspinel-structured oxides, CaB2O4 (B = Cr3+, Mn3+, and Fe3+), have exhibited higher OER activities than nominally isoelectronic conventional counterparts of perovskite oxides LaBO3 and spinel oxides ZnB2O4. Electrochemical impedance spectroscopy reveals that the higher OER activities for CaB2O4 series are attributed to the lower charge-transfer resistances. A density-functional-theory calculation proposes a novel mechanism associated with lattice oxygen pairing with adsorbed oxygen, demonstrating the lowest theoretical OER overpotential than other mechanisms examined in this study. This finding proposes a structure-driven design of electrocatalysts associated with a novel OER mechanism.
Introduction
The oxygen evolution reaction (OER: 4OH− → O2 + 2H2O + 4e− in alkaline conditions) plays an essential role in energy-conversion applications such as water electrolysis and rechargeable metal–air batteries.1–3 Since this reaction intrinsically involves large overpotentials causing colossal energy loss, precious-metal oxides (e.g., RuO2 and IrO2) are presently utilized as typical OER catalysts.4–6 Despite their high performance, large-scale applications are restricted because of their scarcity and high cost. Accordingly, much effort has been directed toward the development of highly active transition metal oxide catalysts consisting of earth-abundant and low-cost elements.7,8 Most of the transition metal oxide catalysts, such as spinel and perovskite, comprise tetrahedral and octahedral metal–oxygen units.1,9–11 The perovskite-structured oxides, one of the most well-studied experimentally and theoretically catalyst systems,1,12 consist of vertex-sharing octahedra, in which a single-site adsorption/reaction mechanism is widely accepted as adsorbates evolution reaction (AEM).12,13 The reactants are adsorbed on coordinatively unsaturated sites (CUS) formed by the extraction of oxygen at an octahedral vertex. Since the neighboring transition metal sites in vertex-sharing octahedra are far from each other, the bridging adsorption of adsorbates on two active sites is disturbed.Several structures in transition metal oxides possess particular geometric conditions such as smaller transition-metal interatomic distances than that of vertex-sharing octahedra in perovskite, inducing interactions between adsorbates and multiple sites on the catalyst surface. Accordingly, dual-site adsorption/reaction mechanisms that the reactant bound to the CUS is also connected to another atom in the surrounding polyhedra are manifested by experiments and theoretical calculations.5,14–17 For example, the dual-site reaction mechanism bridging B-site octahedral CUS metal and A′-site pseudo-square coordinated transition metal has been suggested in the A-site-ordered quadruple perovskite (AA′3B4O12).15,16 The dual-site reaction mechanism has been experimentally and theoretically examined in the rutile-structured RuO2.5,18 RuO2 is composed of one-dimensional edge-shared RuO6 octahedral chains gathered by sharing vertices. The reaction mechanism reported in the RuO2(110) surface involves a reaction step where an oxygen atom adsorbed on the Ru CUS combines with the oxygen atom (OBRI) bridging two Ru atoms in the octahedral chain neighboring to CUS.5 Recently, Sugawara et al. reported that CaFe2O4 exhibits higher OER activity than other Fe oxides,17 suggesting a novel reaction mechanism in which three Fe atoms participate in direct O–O bond formation based on density-functional-theory (DFT) calculations. Although the geometric feature associated with multi-site adsorption and reaction is reasonably described, the unusual 3-step reaction via simultaneous adsorption of two OH− species on Fe CUSs (FeCUS) and two electrons transfer is assumed in this mechanism, in contrast to the ordinary 4-step reaction in which one OH− and one electron are sequentially involved at each step.
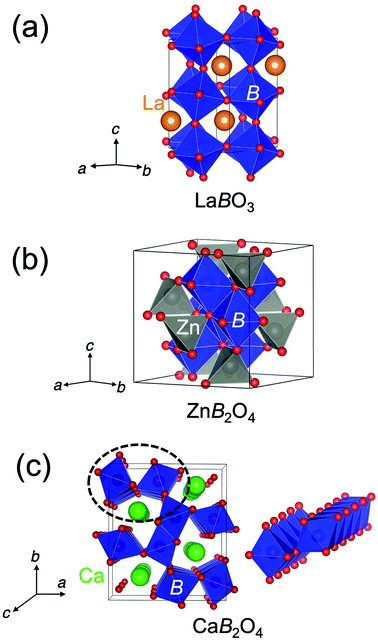
The crystal structure of CaFe2O4 consists of edge-sharing FeO6 octahedra chains like rutile. It can be classified as the postspinel structure, a high-pressure polymorph of spinel. Fig. 1 shows the crystal structures of perovskites, spinels, and postspinels. CaFe2O4-type postspinel structure has the one-dimensional framework of octahedra with shared edges, including Ca ions in the voids, distinct from spinel and perovskite with the three-dimensional octahedral framework with shared edges and corners, respectively. Considering that the OER activity of CaFe2O4 may be derived from the structural feature, the postspinel-related series of CaB2O4 (B = Cr and Mn) must exhibit higher OER catalytic activity than the spinel or perovskite oxides.
In this paper, we investigated the OER catalytic activities of postspinel-structured CaB2O4 (B = Cr, Mn, and Fe) and systematically compared activities with perovskite LaBO3 and spinel ZnB2O4. Regardless of B-site transition metals, the OER activities in CaB2O4 oxides are monotonically superior to those of ZnB2O4 and LaBO3 counterparts, which is supported by lower charge-transfer resistance in CaB2O4. We performed DFT calculations to reveal the origin of OER activity in CaFe2O4 by remodeling the regular 4-step reaction mechanism from the previously reported 3-step mechanism17 and compared with the comparison with several possible mechanisms. We eventually found a novel 4-step reaction mechanism with lower theoretical overpotential, where the adsorbed oxygen on the FeCUS and the adjacent OBRI were desorbed to generate oxygen. This finding suggests a new design principle for improving catalytic activity in multiple crystal structures of transition metal oxides.
Experimental
Material synthesis
CaCr2O4, CaMn2O4, and CaFe2O4 were obtained from the mixtures of CaCO3 (99.95%) and Cr2O3 (99.9%), MnO2 (99.99%), or Fe2O3 (99.99%) by calcining at 1473, 1473, and 1373 K, respectively, for 10–24 h for several times. ZnCr2O4 and ZnMn2O4 were synthesized from the mixtures of ZnO (99.9%) and Cr2O3 (99.9%) or MnO2 (99.9%) by heating at 1273 and 1173 K for 5 and 10 h, respectively. ZnFe2O4 was obtained using the polymerized complex method.19 A mixture of ZnO (99.9%) and Fe(NO3)3·9H2O (99.9%) at a molar ratio of 1![[thin space (1/6-em)]](https://www.rsc.org/images/entities/char_2009.gif) :
:![[thin space (1/6-em)]](https://www.rsc.org/images/entities/char_2009.gif) 2 was dissolved in nitric acid solution (∼5 M), to which a five-fold excess of citric acid and one-fold excess of 1,2-ethanediol were added to the solution with stirring. The resulting solution was heated for 573 K and maintained at this temperature for 1 h to dry. Subsequently, the dried powder was fired using a furnace at 673 K for 1 h and then 1273 K for 10 h in air with occasional grindings. LaCrO3 and LaMnO3 were also obtained using the polymerized complex method from mixtures of La(NO3)3·6H2O and Cr(NO3)3·9H2O or La(NO3)3·6H2O and Mn(NO3)3·6H2O, by combustion at 1273 and 1073 K for 5 and 10 h, respectively. LaFeO3 was synthesized from a stoichiometric mixture of La2O3 and Fe2O3 by heating at 1673 K for 10 h.
2 was dissolved in nitric acid solution (∼5 M), to which a five-fold excess of citric acid and one-fold excess of 1,2-ethanediol were added to the solution with stirring. The resulting solution was heated for 573 K and maintained at this temperature for 1 h to dry. Subsequently, the dried powder was fired using a furnace at 673 K for 1 h and then 1273 K for 10 h in air with occasional grindings. LaCrO3 and LaMnO3 were also obtained using the polymerized complex method from mixtures of La(NO3)3·6H2O and Cr(NO3)3·9H2O or La(NO3)3·6H2O and Mn(NO3)3·6H2O, by combustion at 1273 and 1073 K for 5 and 10 h, respectively. LaFeO3 was synthesized from a stoichiometric mixture of La2O3 and Fe2O3 by heating at 1673 K for 10 h.
Basic characterization
The as-synthesized samples were identified by X-ray powder diffraction (XRD) with Cu-Kα radiation (Ultima IV, Rigaku, Japan). The synchrotron XRD (SXRD) patterns were collected using a Debye–Scherrer camera installed at the BL02B2 beamline in SPring-8, Japan. The wavelength was determined as 0.49968 Å using CeO2 as a reference. The SXRD data were analyzed using the Rietveld refinement program RIETAN-FP.20 Specific surface areas were determined by Brunauer–Emmett–Teller (BET) analysis of Kr gas adsorption data (BELSORP-max, MicrotracBEL, Japan). The morphologies of all the catalysts were confirmed by scanning electron microscopy (SEM) images (TM3030, Hitachi High-Tech, Japan). X-ray absorption near edge structure (XANES) spectra of Cr, Mn, and Fe K-edges were collected in the transmission mode at the BL14B2 beamline in SPring-8. The X-ray absorption spectra were normalized by spline functions between pre-edge and post-edge regions using Athena program of the IFEFFIT package.21Electrochemical characterization
Working electrodes were prepared using the drop-casting method of inks containing catalysts on glassy carbon electrode, referred to previous papers.10 A 5 wt% proton-type Nafion suspension (Sigma-Aldrich), 0.1 M KOH aqueous solution (Nacalai Tesque, Inc., Japan), and tetrahydrofuran (THF, Sigma-Aldrich) were mixed at a ratio of 2![[thin space (1/6-em)]](https://www.rsc.org/images/entities/char_2009.gif) :
:![[thin space (1/6-em)]](https://www.rsc.org/images/entities/char_2009.gif) 1
1![[thin space (1/6-em)]](https://www.rsc.org/images/entities/char_2009.gif) :
:![[thin space (1/6-em)]](https://www.rsc.org/images/entities/char_2009.gif) 97 in volume. The catalyst ink was prepared by mixing 5 mg of catalyst, 1 mg of acetylene black (Denka Co., Ltd, Japan), and 1 mg of the THF solution. A 6.4 μL of catalyst ink was taken with stirring and drop cast onto the glassy-carbon disk electrode with 4 mm diameter.
97 in volume. The catalyst ink was prepared by mixing 5 mg of catalyst, 1 mg of acetylene black (Denka Co., Ltd, Japan), and 1 mg of the THF solution. A 6.4 μL of catalyst ink was taken with stirring and drop cast onto the glassy-carbon disk electrode with 4 mm diameter.
Electrochemical measurements were conducted using a rotating-disk electrode rotator (RRDE-3 A, BAS Inc., Japan) and a bipotentiostat (model-2325, BAS Inc., Japan). We used a Pt wire electrode and a Hg/HgO electrode (International Chemistry Co., Ltd, Japan) filled with a 0.1 M KOH aqueous solution (Nacalai Tesque, Inc., Japan) as the counter and reference electrodes, respectively. All electrochemical measurements were conducted under O2 saturation at room temperature. This fixed the equilibrium potential of the O2/H2O redox couple to 0.304 V versus (vs.) Hg/HgO. The disk potential was controlled between 0.3 and 0.9 V vs. Hg/HgO at a scan rate of 10 mV s−1. The disk potential was represented in those vs. reversible hydrogen electrode (RHE), with IR-compensation (R = 43 Ω). The capacitive effect was compensated by averaging the cathodic and anodic scans.
Chronoamperometry (CA) was conducted at 1.6 V vs. RHE, where IR-compensation was not made. The electrochemical surface area (ECSA) was determined by scanning non-faradaic region between 0.0 and 0.1 V vs. Hg/HgO, according to the literature.22 Electrochemical impedance spectroscopy (EIS) measurement was conducted using an electrochemical analyzer (760E, BAS Inc., Japan) at 1.7 V vs. RHE at frequencies ranging from 0.1 Hz to 1 MHz.
Density-functional-theory calculation
Bulk model electronic structure
Spin-polarized DFT calculations were systematically performed for spinel and postspinel oxides, namely, CaFe2O4, CaCr2O4, CaMn2O4, ZnCr2O4, ZnMn2O4, and ZnFe2O4, using the plane-wave based projector augmented wave (PAW) method as implemented in the Vienna ab initio Simulation Package (VASP).23–25 The generalized gradient approximation (GGA) parametrized by Perdew, Burke, and Ernzerhof (PBE)26 were adopted to express exchange–correlation interactions. The strong on-site coulombic interactions on the localized 3d electrons were treated with the GGA + U approach.27 The Ueff = 3.5, 4.0, and 3.9 eV were adopted for Cr, Mn, and Fe 3d orbitals, which were selected to reproduce the experimental oxidation enthalpy, as reported previously.28,29 The PAW potential data-set with radial cutoffs of 2.3 Å for Ca, Cr, Mn, Fe, Zn, and 1.52 Å for O were employed, where Ca-3s, 3p, 4s, Cr-3p, 3d, 4s, Mn-3p, 3d, 4s, Fe-3d, 4s, Zn-4s, 4p, 3d, O-2s, 2p were described as valence electrons. Table S11† summarizes the magnetic structures and nominal electron configurations considered in this work. The plane-wave cutoff energy was set to 500 eV for all calculations. The Brillouin zone was sampled using k1 × k2 × k3 mesh points according to the Monkhorst–Pack scheme.30 The mesh count for each direction was selected as the near natural number of 35 per lattice parameter (1 Å−1). The lattice constants and internal coordinates were optimized until the total energy difference and residual forces converged to less than 10−5 eV and 10−2 eV Å−1, respectively. According to literature,31–33 oxygen 2p band centers and unoccupied 3d band centers of transition metal atoms were computed from the projected density of states (DOS) as follows:
 | (1) |
 | (2) |
Slab model surface energy and theoretical overpotential
The electronic structures of OER intermediates on the (001) surface of CaFe2O4 terminated by exposed FeO5 pyramids were investigated using DFT calculations. The slab models in Fig. S6† were composed of doubled cells along the c and b axes for CaFe2O4. The number of layers and the length of the vacuum layer in the slab models were carefully determined by checking the convergences of surface energies. For the (001) plane in CaFe2O4, the slab models respectively consisted of 116 atoms with 8 layers. The lattice constants of slab models for CaFe2O4 were 9.29 Å × 6.07 Å × 43.1 Å, including 20 Å vacuum layer to prevent interactions between surfaces in slab models. For these calculations, Brillouin zones were sampled with 4 × 6 × 1 grids for CaFe2O4. We fixed the positions of 81 atoms in the middle of these models for CaFe2O4 to evaluate bare surface energies (blue areas in Fig. S6b†). The atomic positions were optimized except for atomic layers in the bottom of slab models (magenta areas in Fig. S6b†) to calculate surface energies. The other computational conditions, including the PAW data-set, Ueff values, plane-wave cutoff energies, total energy differences, and residual forces, were identical with bulk calculations.The surface energies of CaFe2O4 under the equilibrium conditions in OER were calculated according to the procedure proposed in the literature.15,18 The surface Gibbs free energy can be described for CaFe2O4 as follows:
 | (3) |
μO(pH,ϕ) = [EDFT(H2O(g)) + [ZPE-TS]H2O] − [[EDFT(H2(g)] + [ZPE-TS]H2] + 2(kBTln![[thin space (1/6-em)]](https://www.rsc.org/images/entities/char_2009.gif) aH+ − eϕ), aH+ − eϕ),
| (4) |
| μCa + 2μFe + 4μO(pH,ϕ) = EDFT(CaFe2O4) | (5) |
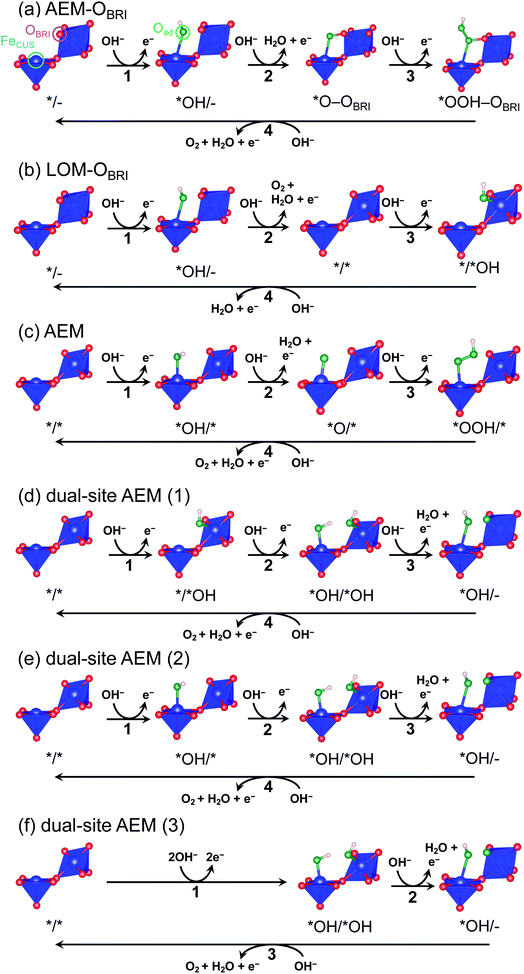
In this work, we constructed reaction mechanisms from reported AEM12,13 and lattice-oxygen-mediated mechanism (LOM)13 and conducted surface calculations for the mechanisms listed in Tables S12 and S13:† AEM–OBRI, the LOM–OBRI, AEM model, and dual-site AEM models referred by Sugawara et al.17 In these reaction steps, the *X/*Y surface state of postspinel-structured CaFe2O4 is determined as using the binding state *X for FeCUS and the binding state *Y for adjacent FeCUS with OBRI. The – bondings of *O–OBRI and *OOH–OBRI surfaces exhibit interactions between adsorbed oxygen and OBRI. For each of the individual surfaces, the free energy change ΔG*X/*Y (*X/*Y: adsorbed surfaces) was calculated using equations in Table S14.† For each of the six reaction mechanisms, the free energy change ΔGn (n: reaction steps) in the individual reaction was defined as each formula in Tables S15 and S16.† Using the largest ΔGn (n: reaction step), the value of theoretical overpotential (ηth) was calculated using the following equation:
| ηth = max{ΔG1, ΔG2, ΔG3, ΔG4}/e − 1.23 [V]. | (6) |
Results and discussion
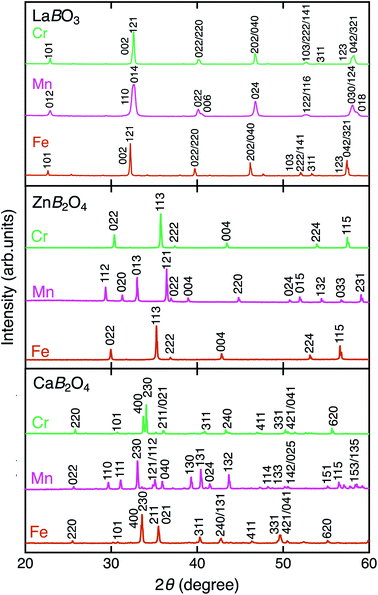
Fig. 2 shows the XRD patterns of LaBO3, ZnB2O4, and CaB2O4 (B = Cr, Mn, Fe). All samples crystallized in a single phase. CaB2O4 were assigned to orthorhombic phases, as reported previously.36–38 Rietveld refinement results obtained by using the SXRD data confirmed that the refined lattice parameters were similar to those previously reported in all samples (Fig. S1 and Tables S1–S9†). The calculated bond valence sums (BVSs) indicate trivalent states of transition metal ions, as expected from the simple ionic models of La3+B3+O32−, Zn2+B23+O42−, and Ca2+B23+O42−. Fig. 3 shows the X-ray absorption spectra at K-edges of Cr, Mn, and Fe. The K-edge absorption positions of transition metals for perovskites, spinels, and postspinels are close to those of pure trivalent metal oxide references (B23+O3) rather than aliovalent references (B2+O and B4+O2), although the differences in local structures around the B sites appeared in shapes in higher energy ranges than absorption energies. The structural and spectroscopic analyses exclude the possible effects of valence on OER activities,33 thus the effects of crystal structure on activity can be investigated in this study.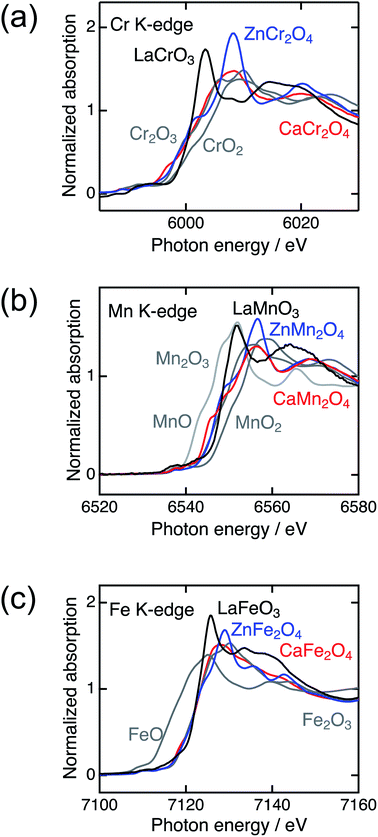 | ||
| Fig. 3 X-ray absorption spectra of transition metal K-edges for LaBO3 (black), ZnB2O4 (blue), CaB2O4 (red) (B = Cr, Mn, and Fe), and references (gray). | ||
Specific surface areas determined by the BET analysis of Kr-gas adsorption data ranged in typical values between ∼1.1 and ∼2.5 m2 g−1, as listed in Table 1. The BET specific surface areas were adopted to normalize the current densities per surface area of catalysts in the electrochemical analysis. The values of ECSA in Table 1 were observed in the region of 10–27 m2 g−1, displaying the same proportion of the maximum to the minimum, compared to that of BET surface areas. The SEM images in Fig. S2† indicate that the particle sizes roughly ranged between 0.1 and 10 μm for all. The crucial differences in grain size were not observed between CaB2O4 and references containing the same B ion. The SEM observations roughly confirmed similar morphologies among all samples, compatible with BET and ECSA analyses.
| Compound | Specific surface area (m2 g−1) | ECSA (m2 g−1) | η0.05 (V) | Specific activity (mA cmoxide−2) | Tafel slope (mV dec−1) |
|---|---|---|---|---|---|
| LaCrO3 | 2.49 | 27.3 | 0.75 | 0.004 | 230 |
| LaMnO3 | 1.52 | 26.6 | 0.51 | 0.010 | 163 |
| LaFeO3 | 1.32 | 20.5 | 0.42 | 0.015 | 78 |
| ZnCr2O4 | 1.84 | 15.3 | 0.47 | 0.008 | 248 |
| ZnMn2O4 | 1.57 | 21.3 | 0.48 | 0.005 | 101 |
| ZnFe2O4 | 1.15 | 10.9 | 0.45 | 0.009 | 103 |
| CaCr2O4 | 1.15 | 18.2 | 0.31 | 0.068 | 138 |
| CaMn2O4 | 1.32 | 17.5 | 0.39 | 0.012 | 84 |
| CaFe2O4 | 1.11 | 10.3 | 0.33 | 0.111 | 53 |
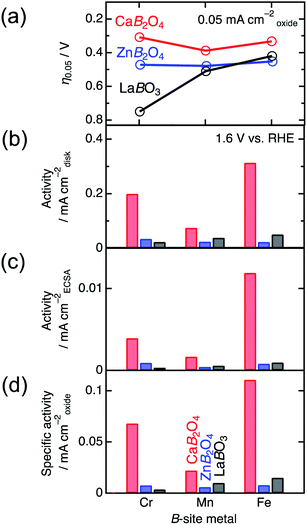
Fig. 4 shows the linear sweep voltammograms for LaBO3, ZnB2O4, and CaB2O4 (B = Cr, Mn, and Fe). Obviously, CaB2O4 series exhibited much higher activities than the LaBO3 and ZnB2O4 counterparts in the identical transition metal element. Taking Cr oxides for instance, the overpotential of CaCr2O4 was η0.05 = 0.34 V, substantially lower than those of ZnCr2O4 (0.44 V) and LaCrO3 (0.75 V) (see the inset of Fig. 4a and Table 1), where the overpotentials (η0.05) were determined at the onset potentials (Eonset V vs. RHE) exceeding the current density of 0.05 mA cmoxide−2: η0.05 = Eonset − 1.23 (V). The specific activity (a current density at 1.6 V vs. RHE) of CaCr2O4 was about 9 times higher than that of ZnCr2O4 or LaCrO3. Fig. 5 and Table 1 summarize the specific activities and overpotentials for all samples. The superiority of CaB2O4 as OER catalyst were commonly observed in the activities normalized by disk areas, ECSA, and BET surface areas (Fig. 5). Regardless of the constituent transition metals, the lower overpotentials and larger activities reveal the intrinsic superiority of the postspinel structures. Especially, CaFe2O4 exhibited about 30 times larger specific activity and 0.15 V smaller η0.05 than ZnFe2O4. The improvement from spinel-structured ZnFe2O4 to postspinel-structured CaFe2O4 was the most remarkable among all comparisons.
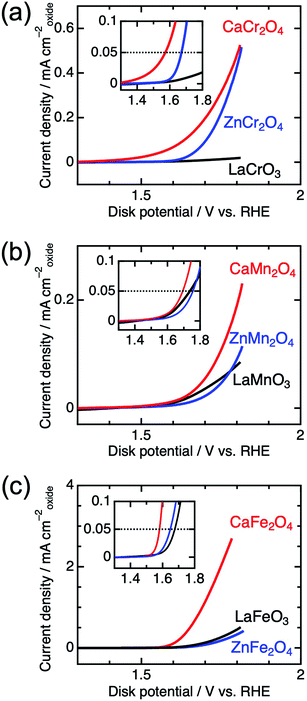 | ||
| Fig. 4 Linear sweep voltammograms for LaBO3, ZnB2O4, and CaB2O4 for B = (a) Cr, (b) Mn, and (c) Fe. The insets represent the magnified data in the vicinity of the OER onset potential. | ||
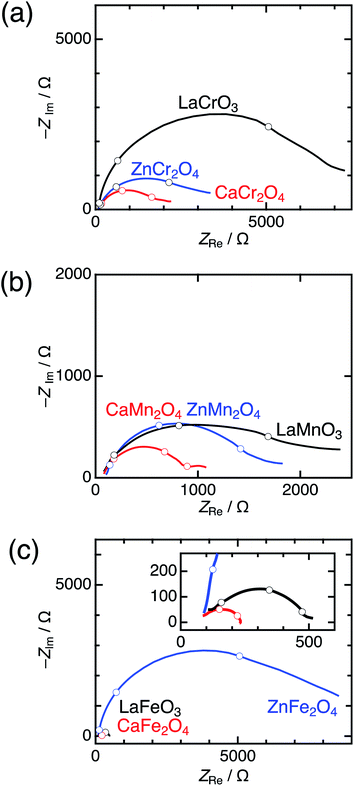
Significant differences between postspinels and other structures were observed in Tafel plots and EIS analyses. Fig. 6 shows the Tafel plots for LaBO3, ZnB2O4, and CaB2O4 (B = Cr, Mn, and Fe). The Tafel slope of CaFe2O4 (53 mV dec−1) was much smaller than that of ZnFe2O4 (102 mV dec−1) and LaFeO3 (78 mV dec−1). Clear differences in Tafel slopes between postspinel-structured oxides and counterparts were also observed in Cr and Mn oxides. Since the Tafel slope varies in dependent on the rate-determining step (RDS),39 the observed differences in Tafel slope indicate that the RDS is altered by crystal structures. Nyquist plots are displayed in Fig. 7 for LaBO3, ZnB2O4, and CaB2O4 (B = Cr, Mn, and Fe). The semicircles around 1–100 Hz attributed to charge-transfer resistance (Rct) changed depending on the crystal structure. The Rct value of CaFe2O4 (∼150 Ω) was smaller than that of LaFeO3 (∼400 Ω) and ZnFe2O4 (∼7000 Ω). CaCr2O4 (Rct = ∼2000 Ω) and CaMn2O4 (∼800 Ω) exhibited lower Rct values than LaBO3 and ZnB2O4 counterparts. The fact that the Rct values in CaCr2O4 and CaMn2O4 were larger than that in CaFe2O4 is probably associated with surface amorphizations in the formers, as shown in the HRTEM study later. The surface amorphizations disturb the charge transfer, deviating from the intrinsic nature of the crystalline surface. Consequently, the activated charge-transfer kinetics is consistently a primary origin for the enhanced OER activity in CaB2O4 for Cr, Mn, and Fe oxides.
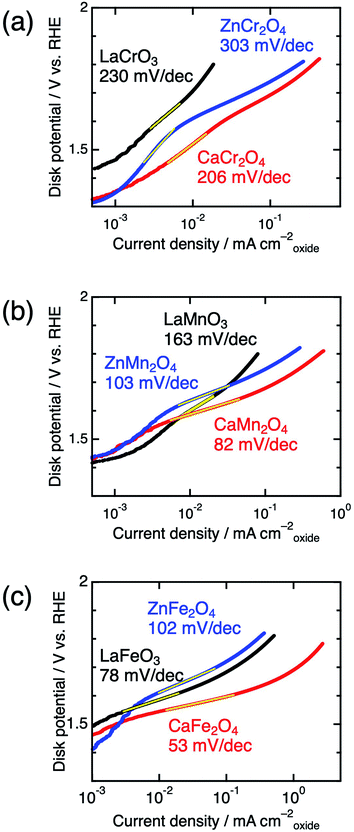 | ||
| Fig. 6 Tafel plots of LaBO3 (black), ZnB2O4 (blue), and CaB2O4 (red) for B = (a) Cr, (b) Mn, and (c) Fe. | ||
We investigated the long-term stability and surface crystalline states of CaB2O4. Fig. 8 shows the CA currents normalized by initial currents in CaCr2O4, CaMn2O4, and CaFe2O4. CaFe2O4 exhibited no substantial degradation in OER activity. This observation manifests the robustness of CaFe2O4 in OER conditions, whereas the sudden drops in initial states for CaCr2O4 and CaMn2O4 (Fig. 8) indicate instability of surface crystalline states. Fig. S3† displays HRTEM images of CaCr2O4, CaMn2O4, and CaFe2O4. CaFe2O4 retained the crystalline surface after CA, as well as the pristine and as-cast powders. In contrast, CaCr2O4 demonstrated severe surface amorphization even in the as-cast sample and further evolution of the amorphous layer after CA (Fig. 8). CaMn2O4 also possessed the amorphous surface in the as-cast sample, which is probably the cause of the initial degradation in CA. Gradual increases in current density were observed for several oxides (CaMn2O4 and CaFe2O4), but the origin was unclear at the present stage. Since CaFe2O4 did not exhibit severe amorphization, the intrinsic feature of the crystalline surface is predominantly reflected in the electrochemical analyses.
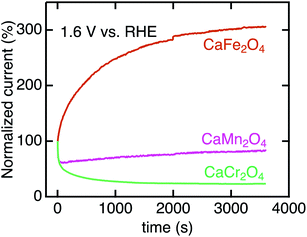 | ||
| Fig. 8 Chronoamperometry of CaB2O4 for B = Cr, Mn, and Fe normalized initial current values. The data were collected at 1.6 V vs. RHE after three CV scans. | ||
Our electrochemical experiments elucidated that the OER catalytic activities in postspinels CaB2O4 (B = Cr, Mn, and Fe) are superior to those of perovskites LaBO3 and spinels ZnB2O4, irrespective of B metal ions. The commonly observed properties in CaB2O4 suggest that the edge-sharing one-dimensional octahedra in postspinel structures predominate the reaction mechanism. We conducted DFT calculations to discuss the reaction mechanism on the surface of CaB2O4 associated with the geometric feature of the coordination polyhedra, in addition to the bulk electronic factors possibly affecting the OER catalysis. Fig. S4† shows the DOS generated from bulk-model DFT calculations for spinels and postspinels. All ZnB2O4 and CaB2O4 (B = Cr, Mn, Fe) displayed insulating band structures with band gaps of ∼1–2 eV, finding no definite difference between spinel and postspinel structures. Typical OER descriptors of O-2p band center40 and charge-transfer energy (Δ)41 were close between ZnB2O4 and CaB2O4 (Table S10†). Unlike the linear tendency in the η0.05 vs. Δ plots for the perovskite oxides,32 there was no clear trend (Fig. S5†) in the spinels and postspinels in this study. Hence, almost isoelectronic states in the bulk form cannot explain the origin of OER activity in the postspinel-structured oxides.
To evaluate credible information on the OER on postspinel, we calculated the theoretical overpotentials from the surface free-energies. In the surface-state calculations, CaFe2O4 was selected because of its robust crystalline surface in OER conditions, as demonstrated in CA and HRTEM studies. The calculations of surface states were conducted on the (001) plane with OBRI ions bridged by two Fe ions, referring to the reaction mechanism in RuO2 with one-dimensionally aligned octahedra.4,5 We originally investigated three different reaction mechanisms AEM–OBRI, LOM–OBRI, and AEM. Fig. 9 shows the surface geometries after structural relaxations. First, in the AEM–OBRI (Fig. 9a), the calculations were performed using conventional adsorbates, *OH, *O, and *OOH binding to FeCUS on the surface containing OBRI. The structural relaxation revealed the formation of additional bonds between adsorbed oxygen (Oad) and OBRI when *O and *OOH species are adsorbed (*O–OBRI and *OOH–OBRI states). These bond formations indicate that OBRI participates in the OER on the CaFe2O4 surface. Second, we examined the lattice oxygen mechanism42 (LOM–OBRI, Fig. 9b) in which OH− is adsorbed to FeCUS (step 1: */– + OH− → *OH/– + e−), and desorbed with OBRI to evolve O2 (step 2: *OH/– + OH− → */* + O2 + H2O + e−). Third, we considered the AEM mechanism, where the adsorbates are solely bound to FeCUS because of the absence of the OBRI atom (Fig. 9c). This mechanism is similar to the conventional OER mechanism in single-site adsorption.
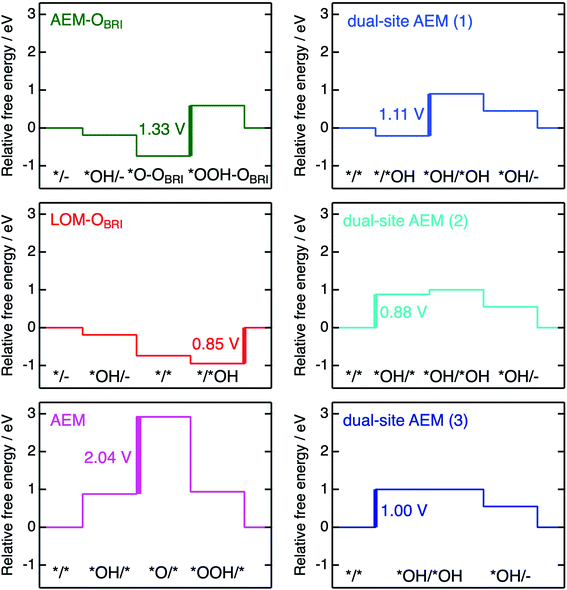
The free energies ΔG*X/*Y at each reaction step of the above-examined models are listed in Table S17† defined with formulae in Table S14.† The value of ΔG*X/*Y tended to increase in correspondence with the number of adsorbed atoms in the *X/*Y surface state. We calculated the values of energy change ΔGn of each reaction steps and ηth for the six reaction mechanisms (Table S18†) as following calculations in formulae in Tables S15 and S16.† Fig. 10 shows the energy diagrams for each reaction mechanism. In Fig. 10, the thick lines represent the potential determining steps (PDSs) with the largest ΔGn in each mechanism, accompanied by ηth values calculated from ΔGn at PDSs. The PDSs for AEM–OBRI (ηth = 1.33 V) and LOM–OBRI (ηth = 0.85 V) were assigned to step 3 (*O–OBRI + OH− → *OOH–OBRI + e−) and step 4 (*/*OH + OH− → */– + H2O + e−), respectively. In contrast, step 2 with a significant large ηth (2.04 V) was the PDS in the AEM (*OH/* + OH− → *O/* + H2O + e−). LOM–OBRI demonstrated the lowest ηth among the 4-step mechanisms. Due to the high variation in surface structures and types of adsorbed species in PDSs, we could not identify any consistency in adsorption states of PDSs among the three reaction mechanisms. The PDSs of LOM–OBRI and AEM were categorized as transforming steps from *OH to *O, whereas the PDSs of AEM–OBRI were assigned to adsorption processes of the reactant OH−. We conclude that the LOM–OBRI with the lowest ηth (0.85 V) examined in the present DFT calculation is the most probable mechanism to explain the high OER activity of postspinel-structured oxides.
We compared theoretical overpotential in the mechanisms reported in previous studies with LOM–OBRI, which is the most probable reaction mechanism among our reaction mechanisms described above. We validated two types of 4-step mechanisms, dual-site AEM (1)–(2) in Fig. 9d and e, which are reformulations of the 3-step model, and dual-site AEM (3) (Fig. 9f), proposed by Sugawara et al.17 The OH− adsorbates are sequentially bonded with two FeCUS sites in the 4-step reaction with two procedures [*/* → *OH/* → *OH/*OH → *OH/– (Fig. 9d) or */* → */*OH → *OH/*OH → *OH/– (Fig. 9e)], in contrast to the simultaneous OH− adsorption in the previous 3-step reaction in Fig. 9f (*/* → *OH/*OH → *OH/*O). In dual-site AEMs, depending on the initial position of *OH species, the PDSs were determined at adsorption of step 2 in dual-site AEM (1) (ηth = 1.11 V, */*OH + OH− → *OH/*OH + e−), and step 1 in dual-site AEM (2) (ηth = 0.88 V, */* + OH− → *OH/* + e−). The calculation using the 3-step mechanism “dual-site AEM (3)” referred to the previous study17 demonstrated simultaneous adsorptions of reactants (step 1) was assigned to the PDS (ηth = 1.00 V, */* + 2OH− → *OH/*OH + 2e−). The present calculations revealed that the PDSs in three subpaths of dual-site AEMs are assigned in adsorptions steps of OH− species to the surface, differing from the charge-transfer PDS in the previous study,17 whereas the original PDS reaction (*OH/*OH + OH− → *OH/– + H2O + e−) was stabilized in our calculations. Since the repulsive energies between the two OH− species were not considered, the theoretical overpotential (0.58 V)17 in the previous 3-step reaction mechanism would be underestimated.
Conclusion
In summary, we investigated the OER catalytic activity in the postspinel-structured oxides CaB2O4 (B = Cr, Mn, and Fe), revealing higher OER activities and smaller charge-transfer resistances than the perovskite- and spinel-structured counterparts. The DFT calculation on the surface of CaFe2O4 elucidates that a novel reaction mechanism with the lowest theoretical overpotential, where OBRI and Oad are combined to generate oxygen, is more probable than the 3-step reaction mechanism with simultaneous adsorption of OH− proposed in the previous study. Consequently, the geometric configurations around adsorption sites tolerating additional bonding are another factor to activate OER beyond the conventional single-site OER mechanism.Conflicts of interest
There are no conflicts to declare.Acknowledgements
The authors thank Hiroyuki Inoue for discussions about EIS analysis and Enago (www.enago.jp) for the English language review. The synchrotron radiation experiments were performed at SPring-8 with the approval of JASRI (proposal number 2018B1769, 2019A1476, and 2019A1650). This work was supported by JSPS KAKENHI (grant number JP16H04220, JP17K18973, JP17K19182, JP18H03835, JP20H02825, JP20H05180, and JP20H05192), Murata Science Foundation, and Takahashi Industrial and Economic Research Foundation.References
- W. T. Hong, M. Risch, K. A. Stoerzinger, A. Grimaud, J. Suntivich and Y. Shao-Horn, Energy Environ. Sci., 2015, 8, 1404–1427 RSC.
- E. Fabbri, A. Habereder, K. Waltar, R. Kötz and T. J. Schmidt, Catal. Sci. Technol., 2014, 4, 3800–3821 RSC.
- Y. Jiao, Y. Zheng, M. Jaroniec and S. Z. Qiao, Chem. Soc. Rev., 2015, 44, 2060–2086 RSC.
- R. R. Rao, M. J. Kolb, L. Giordano, A. F. Pedersen, Y. Katayama, J. Hwang, A. Mehta, H. You, J. R. Lunger, H. Zhou, N. B. Halck, T. Vegge, I. Chorkendorff, I. E. L. Stephens and Y. Shao-Horn, Nat. Catal., 2020, 3, 516–525 CrossRef CAS.
- R. R. Rao, M. J. Kolb, N. B. Halck, A. F. Pedersen, A. Mehta, H. You, K. A. Stoerzinger, Z. Feng, H. A. Hansen, H. Zhou, L. Giordano, J. Rossmeisl, T. Vegge, I. Chorkendorff, I. E. L. Stephens and Y. Shao-Horn, Energy Environ. Sci., 2017, 10, 2626–2637 RSC.
- S. Trasatti, J. Electroanal. Chem. Interfacial Electrochem., 1980, 111, 125–131 CrossRef CAS.
- J. R. Swierk, S. Klaus, L. Trotochaud, A. T. Bell and T. D. Tilley, J. Phys. Chem. C, 2015, 119, 19022–19029 CrossRef CAS.
- H. Wang, K. H. L. Zhang, J. P. Hofmann, V. A. de la Peña O'Shea and F. E. Oropeza, J. Mater. Chem. A, 2021, 9, 19465–19488 RSC.
- Q. Zhao, Z. Yan, C. Chen and J. Chen, Chem. Rev., 2017, 117, 10121–10211 CrossRef CAS PubMed.
- J. Suntivich, H. A. Gasteiger, N. Yabuuchi, H. Nakanishi, J. B. Goodenough and Y. Shao-Horn, Nat. Chem., 2011, 3, 546–550 CrossRef CAS PubMed.
- S. F. Hung, Y. Y. Hsu, C. J. Chang, C. S. Hsu, N. T. Suen, T. S. Chan and H. M. Chen, Adv. Energy Mater., 2018, 8, 1701686 CrossRef.
- J. O. M. Bockris and T. Otagawa, J. Phys. Chem., 1983, 87, 2960–2971 CrossRef CAS.
- J. Song, C. Wei, Z. F. Huang, C. Liu, L. Zeng, X. Wang and Z. J. Xu, Chem. Soc. Rev., 2020, 49, 2196–2214 RSC.
- D. Guan, K. Zhang, Z. Hu, X. Wu, J. L. Chen, C. W. Pao, Y. Guo, W. Zhou and Z. Shao, Adv. Mater., 2021, 33, 1–12 Search PubMed.
- A. Takamatsu, I. Yamada, S. Yagi and H. Ikeno, J. Phys. Chem. C, 2017, 121, 28403–28411 CrossRef CAS.
- I. Yamada, H. Fujii, A. Takamatsu, H. Ikeno, K. Wada, H. Tsukasaki, S. Kawaguchi, S. Mori and S. Yagi, Adv. Mater., 2017, 29, 1603004 CrossRef PubMed.
- Y. Sugawara, K. Kamata, A. Ishikawa, Y. Tateyama and T. Yamaguchi, ACS Appl. Energy Mater., 2021, 4, 3057–3066 CrossRef CAS.
- C. F. Dickens and J. K. Nørskov, J. Phys. Chem. C, 2017, 121, 18516–18524 CrossRef CAS.
- M. Kakihana, J. Sol-Gel Sci. Technol., 1996, 6, 7–55 CrossRef CAS.
- F. Izumi and K. Momma, Solid State Phenom., 2007, 130, 15–20 CAS.
- B. Ravel and M. Newville, J. Synchrotron Radiat., 2005, 12, 537–541 CrossRef CAS PubMed.
- C. C. L. McCrory, S. Jung, I. M. Ferrer, S. M. Chatman, J. C. Peters and T. F. Jaramillo, J. Am. Chem. Soc., 2015, 137, 4347–4357 CrossRef CAS PubMed.
- P. E. Blochl, Phys. Rev. B: Condens. Matter Mater. Phys., 1994, 50, 17953–17979 CrossRef PubMed.
- G. Kresse and J. Furthmüller, Phys. Rev. B: Condens. Matter Mater. Phys., 1996, 54, 11169–11186 CrossRef CAS PubMed.
- G. Kresse, Comput. Mater. Sci., 1996, 6, 15–50 CrossRef CAS.
- J. P. Perdew, K. Burke and M. Ernzerhof, Phys. Rev. Lett., 1996, 77, 3865–3868 CrossRef CAS PubMed.
- S. L. Dudarev, G. A. Botton, S. Y. Savrasov, C. J. Humphreys and A. P. Sutton, Phys. Rev. B: Condens. Matter Mater. Phys., 1998, 57, 1505–1509 CrossRef CAS.
- Y. Wang and G. Guo, Phys. Rev. B: Condens. Matter Mater. Phys., 2006, 73, 64424 CrossRef.
- Z. Hu and H. Metiu, J. Phys. Chem. C, 2011, 115, 5841–5845 CrossRef CAS.
- H. J. Monkhorst and J. D. Pack, Phys. Rev. B: Condens. Matter Mater. Phys., 1976, 13, 5188–5192 CrossRef.
- A. Grimaud, K. J. May, C. E. Carlton, Y. L. Lee, M. Risch, W. T. Hong, J. Zhou and Y. Shao-Horn, Nat. Commun., 2013, 4, 2439 CrossRef PubMed.
- I. Yamada, A. Takamatsu, K. Asai, H. Ohzuku, T. Shirakawa, T. Uchimura, S. Kawaguchi, H. Tsukasaki, S. Mori, K. Wada, H. Ikeno and S. Yagi, ACS Appl. Energy Mater., 2018, 1, 3711–3721 CrossRef CAS.
- I. Yamada, A. Takamatsu, K. Asai, T. Shirakawa, H. Ohzuku, A. Seno, T. Uchimura, H. Fujii, S. Kawaguchi, K. Wada, H. Ikeno and S. Yagi, J. Phys. Chem. C, 2018, 122, 27885–27892 CrossRef CAS.
- J. Rossmeisl, A. Logadottir and J. K. Nørskov, Chem. Phys., 2005, 319, 178–184 CrossRef CAS.
- I. C. Man, H.-Y. Su, F. Calle-Vallejo, H. A. Hansen, J. I. Martínez, N. G. Inoglu, J. Kitchin, T. F. Jaramillo, J. K. Nørskov and J. Rossmeisl, ChemCatChem, 2011, 3, 1085 CrossRef.
- W. H. Hartford, K. A. Lane and W. A. Meyer, J. Am. Chem. Soc., 1950, 72, 3353–3356 CrossRef CAS.
- Y. Matsumoto, M. Obata and J. Hombo, J. Phys. Chem., 1994, 98, 2950–2951 CrossRef CAS.
- C. D. Ling, J. J. Neumeier and D. N. Argyriou, J. Solid State Chem., 2001, 160, 167–173 CrossRef CAS.
- T. Shinagawa, A. T. Garcia-Esparza and K. Takanabe, Sci. Rep., 2015, 5, 13801 CrossRef PubMed.
- A. Grimaud, K. J. May, C. E. Carlton, Y. L. Lee, M. Risch, W. T. Hong, J. Zhou and Y. Shao-Horn, Nat. Commun., 2013, 4, 2439 CrossRef PubMed.
- W. T. Hong, K. A. Stoerzinger, Y.-L. L. Lee, L. Giordano, A. Grimaud, A. M. Johnson, J. Hwang, E. J. Crumlin, W. Yang and Y. Shao-Horn, Energy Environ. Sci., 2017, 10, 2190–2200 RSC.
- J. S. Yoo, X. Rong, Y. Liu and A. M. Kolpak, ACS Catal., 2018, 4628–4636 CrossRef CAS.
Footnote |
| † Electronic supplementary information (ESI) available: Structural parameters and refined profiles in Rietveld refinements are displayed for all the samples. The SEM and HRTEM images show the morphology of all samples. The calculated values and conditions of DFT calculations. See DOI: 10.1039/d2ra00448h |
| This journal is © The Royal Society of Chemistry 2022 |

