 Open Access Article
Investigation of the one-step electrochemical deposition of graphene oxide-doped poly(3,4-ethylenedioxythiophene)–polyphenol oxidase as a dopamine sensor†
P. Ramu *a,
S. P. Vimalab,
P. Sureshc,
Anandhavelu Sanmugam
 d,
U. Saravanakumare,
Raju Suresh Kumar
 f,
Abdulrahman I. Almansourf,
Natarajan Arumugam
 f and
Dhanasekaran Vikraman
 g
g
aDepartment of Electronics and Communication Engineering, Jaya Institute of Technology, Tamilnadu, India. E-mail: pramuaccet@gmail.com
bDepartment of Electronics and Communication Engineering, Sri Ramakrishna Engineering College, Coimbatore, India
cDepartment of Electronics and Communication Engineering, Vel Tech Rangarajan Dr Sagunthala R & D Institute of Science and Technology, Chennai, Tamilnadu 600062, India
dDepartment of Applied Chemistry, Sri Vanketeswara College of Engineering, Pennalur, Sriperambudur, 602117, Chennai, India
eDepartment of Electronics and Communication Engineering, Muthayammal Engineering College, Rasipuram, Tamilnadu, India
fDepartment of Chemistry, College of Science, King Saud University, Riyadh 11451, Saudi Arabia
gDivision of Electronics and Electrical Engineering, Dongguk University-Seoul, Seoul, 04620, Korea
First published on 23rd May 2022
Abstract
In this paper, we fabricated poly(3,4-ethylenedioxythiophene) (PEDOT)–graphene oxide–polyphenol oxidase (PEDOT–GO–PPO) as a dopamine sensor. The morphology of PEDOT–GO–PPO was observed using scanning electron microscopy. Cyclic voltammetry was conducted to study the oxidation–reduction characteristics of dopamine. To optimize the pH, potential and limit of detection of dopamine, the amperometric technique was employed. The found limit of detection was 8 × 10⁻⁹ M, and the linear range was from 5 × 10⁻⁸ to 8.5 × 10⁻⁵ M. The Michaelis–Menten constant (Km) was calculated to be 70.34 μM, and the activation energy of the prepared electrode was 32.75 kJ mol−1. The electrode shows no significant change in the interference study. The modified electrode retains up to 80% of its original activity after 2 months. In the future, the biosensor can be used for the quantification of dopamine in human urine samples. The present modified electrode constitutes a tool for the electrochemical analysis of dopamine.
1. Introduction
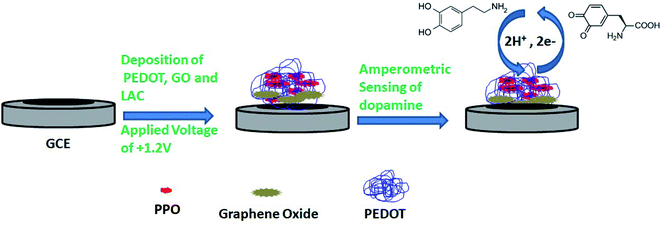
Dopamine, norepinephrine and epinephrine are well-known neurotransmitters.1 Quantification of these biogenic amines in the field of clinical chemistry is an important task because the quantity of these compounds has a direct influence on human health. Many methods are accessible for the separation and the quantification of dopamine.2,3 Recent developments have been made for the detection of dopamine based on electrochemical methods,4,5 which facilitate several unique advantages to detect neurotransmitters.6 However, the exceptionally low amounts of neurotransmitters in bodily fluids make it necessary to develop newer specific detection systems with very low limits of detection.7,8 Recently, many studies have been conducted on the topic of carbon materials and conducting polymers with enzymes leading to improvement in the electrochemical performance of electrodes.9–11 Conducting polymers such as polyaniline, polypyrrole and polythiophene derivatives are used as transducer materials for the detection of analytes. Among these conducting polymers, poly(3,4-ethylenedioxythiophene) (PEDOT) is one of the most commonly employed, possessing excellent electrochemical and optical properties.12 This polymer is easily made by the anodic oxidation of the appropriate monomer in the presence of different anionic counter-ions, even in aqueous solutions.13 Graphene oxide has unique physical and chemical properties for use in sensor technologies. Recently, carbon-based sensing platforms have been proposed with slight modifications to nanoparticles and conducting polymers. Several techniques have been developed for the deposition of carbon-based materials on transducers to create highly sensitive and selective biosensors. These have been used for various applications using electrochemical techniques.14,15 The amperometric technique is one of the most selective and sensitive methods for the determination of trace levels of neurotransmitters.16,17 Composites with enzymes are also obtained by the inclusion of the enzyme in the anionic form during the polymerization–electrodeposition process.18 Polyphenol oxidase (PPO)-modified electrodes are used for the detection of major polyphenol compounds in the food industry (e.g., in tea, wine, fruit juice and urine samples).19 Some of the recent articles are based on PEDOT/GO for electrochemical sensor application. Taylor et al. developed electrochemically deposited poly(3,4-ethylenedioxythiophene) (PEDOT)/graphene oxide (GO) on carbon fiber microelectrodes for dopamine detection.20 Si et al. fabricated PEDOT/GO on a glassy carbon electrode by electrochemical deposition. This film was utilized for the simultaneous detection of catechol and hydroquinone.21 Xin et al. developed a paper-based sensor using the electrochemical deposition of PEDOT/GO for uric acid in human saliva.22 Herein, the enzyme has an important role to play in the detection of dopamine. PPO oxidizes dopamine into o-dopaquinone, and an applied current reduces the o-dopaquinone to dopamine. The reason behind the entrapping of PPO is to improve the stability, reproducibility, limit of detection, etc., for the specific determination of polyphenol compounds, for which PPO is a very suitable enzyme.23 PPO is a member of the blue multi-copper-oxidase family. PPO provides some important advantages over other enzymes, such as its capability to catalyze electron-transfer reactions without including any additional cofactors and directly oxidize phenols and o,m,p-benzenediol compounds in the presence of molecular oxygen, as well as its good stability.24 PPO biosensors have been widely studied for the detection of major polyphenol compounds in the food industry (e.g., in tea leaf production and beverages), in bioremediation processes, to catalyze the electron transfer mechanism without any additional cofactors,25 and in enzyme-based systems for the rapid and sensitive detection of dopamine.26 The electrochemical polymerization of 3,4-ethylenedioxythiophene has been carried out by a one-pot method in the presence of graphene oxide and PPO. This led to the entrapment of the enzyme during the polymerization itself. In the future, this study may lead to potential integration with 2D material photosensors as well as the development of small optical biosensors using the sol–gel technology and the chemiluminescence detection method. Not only does this compact 2D-based optical biosensor have a high detection capability, a fast detection time, and good repeatability but it also only requires a small sample.27–34We present the novelty of using the enzyme entrapment technique at the electrode surface with a conducting polymer and graphene oxide based on the interaction with specific affinity between the conducting polymer and graphene oxide in a one-pot method. Electrochemical techniques illustrate the low cost and increased simplicity, sensitivity, selectivity and reproducibility of the method.
2. Experimental
2.1. Chemicals
Polyphenol oxidase (PPO) enzyme from mushroom, 3,4-ethylenedioxythiophene (Aldrich) and dopamine (Alfa Aesar) were purchased, and used without any purification. Phosphate buffers of various pH were prepared using dipotassium hydrogen phosphate and potassium dihydrogen phosphate. All solutions were prepared using MilliQ TKA-Lab pure water. Graphene oxide (GO) was prepared by the modified Hummer's method.352.2. Instrumentation
Electrochemical measurements such as cyclic voltammetry (CV), amperometry and electrochemical impedance spectroscopy were accomplished using a CHI760 electrochemical workstation (CH Instruments, USA). All measurements were carried out using a three-electrode assembly with platinum wire as an auxiliary electrode, silver/silver chloride (Ag/AgCl) as a reference electrode and glassy carbon with a diameter of 3 mm as a working electrode. The FT-IR spectra were recorded using a Nicolet 6700 from Japan. The surface study was carried out using scanning electron micrographs obtained from a FEG Quanta 250.2.3. Electrode fabrication
The composite materials were prepared by electropolymerizing 0.01 M 3,4-ethylenedioxythiophene in the presence of PPO, glutaraldehyde and 0.1 M SDS, and a potential of +1.2 V was applied for the deposition. After that, the prepared PEDOT–GO–PPO electrode was cleaned with buffer solution (pH 7.0) to eliminate any loosely bound cross-linked enzyme on the surface, and stored at 4 °C in the dark when not in use. As shown in Fig. 1, the amperometric sensors gave a potential that was constant with time. Initially, the background current (Io) of the PEDOT–GO–PPO biosensor in buffer without substrate was measured. A similar procedure was followed to measure the dopamine response current (Is). The actual response current was calculated by subtracting Io from Is (I = Is − Io).36 The experiments were repeated three times, and the relative error was less than 4.0%.The extraction of dopamine from human urine sample was carried out. The urine samples were deproteinized by adding 1 M perchloric acid; the mixture was vortexed and centrifuged at 2000 rpm at 5 °C for 20 min, and obeyed all the other conditions for the extraction of dopamine from the urine samples.37 After that, our conditioned urine samples were stable for 10 days when were stored at −4 °C. Dopamine was recovered from the spiked urine samples with the actual matrix, and the electrochemical analysis for the recovery of dopamine from the urine samples was studied.
3. Results and discussion
3.1. SEM and FT-IR of PEDOT–GO–PPO
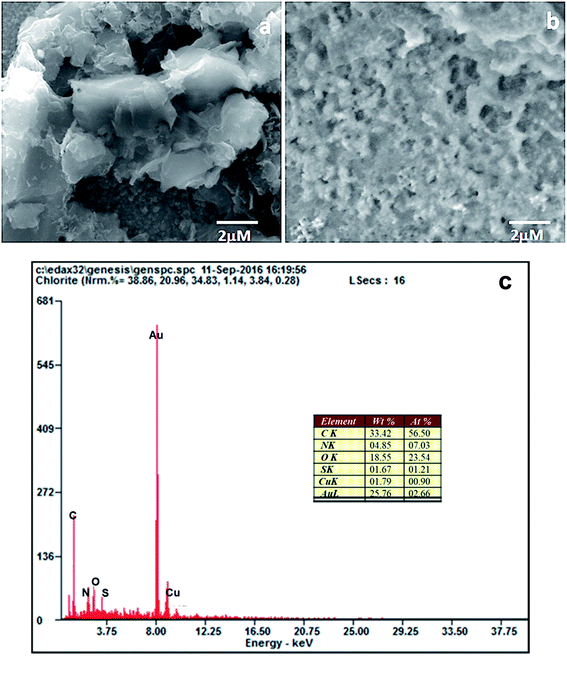
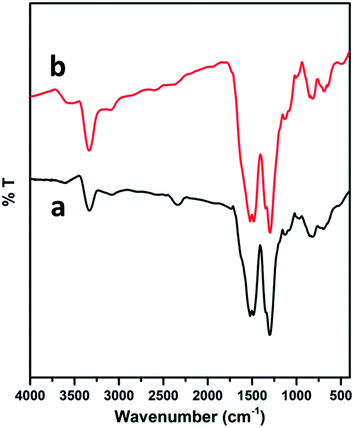
The surface modification of the electrodes was studied by scanning electron microscopy. The SEM image of the PEDOT–GO-modified electrode on a glassy carbon electrode shows high roughness, loose structure and resembles crumpled sheets. Certainly, such an exposed structure hints at a large surface area, as shown in Fig. 2a. The PPO enzyme incorporated on the PEDOT–GO-modified electrode was observed as massive non-conducting biomolecules entrapped over the surface (Fig. 2b), confirming the successful incorporation of PPO. Fig. 2c shows the EDAX spectrum of PEDOT–GO–PPO with the presence of C, N, O, S, Cu and Au. The Au presence was due to the sputtering of Au on the non-conducting sample. The Cu presence in the sample was due to the enzyme based on Cu-containing materials. The presence of the other atoms was based on the conducting polymer and the graphene oxide materials.The FT-IR peaks reveal the presence of the characteristic functional groups in PEDOT–GO (Fig. 3a), i.e. the 3401 cm−1 peak corresponds to the –O–H stretching vibration, the peak at 1645 cm−1 corresponds to the –C![[double bond, length as m-dash]](https://www.rsc.org/images/entities/char_e001.gif) O stretching vibration, the peak at 1302 cm−1 is attributed to the –C–O stretching vibration, the one at 1084 cm−1 corresponds to the –C–H sp3 bending vibration, and the peak at 863 cm−1 is attributed to the –C–S bending vibration (curve a). In curve b, comparably high intense peaks were observed in the FT-IR spectrum of PEDOT–GO–PPO (Fig. 3b) at 657 and 753 cm−1 (Cu–N symmetric stretching) due the presence of the copper-containing enzyme PPO in the matrix. The matrix confirms the incorporation of the enzyme in the conducting polymer-modified electrode.
O stretching vibration, the peak at 1302 cm−1 is attributed to the –C–O stretching vibration, the one at 1084 cm−1 corresponds to the –C–H sp3 bending vibration, and the peak at 863 cm−1 is attributed to the –C–S bending vibration (curve a). In curve b, comparably high intense peaks were observed in the FT-IR spectrum of PEDOT–GO–PPO (Fig. 3b) at 657 and 753 cm−1 (Cu–N symmetric stretching) due the presence of the copper-containing enzyme PPO in the matrix. The matrix confirms the incorporation of the enzyme in the conducting polymer-modified electrode.
3.2. Electroactivity of the PEDOT–GO–PPO-modified GCE
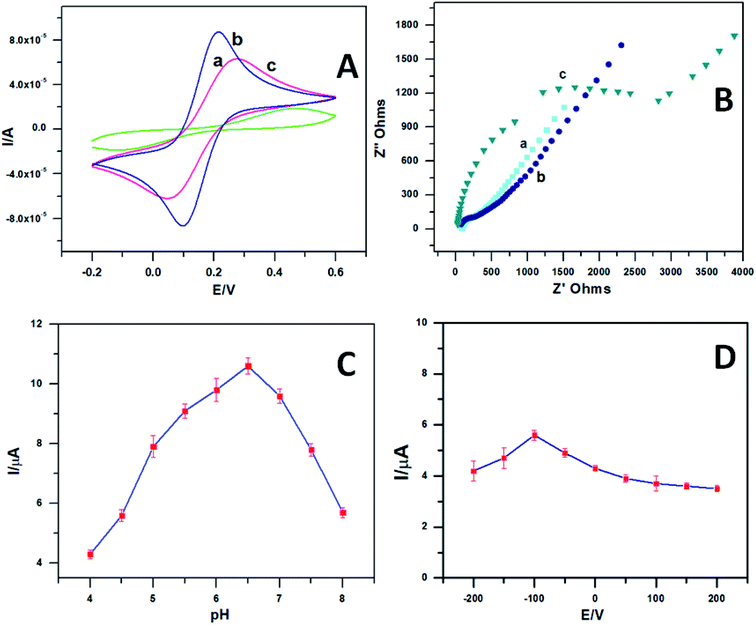
The cyclic voltammograms (Fig. 4A) of 1 mM [Fe(CN)6]3−/4− using plain GCE (curve a), PEDOT–GO (curve b) and the PEDOT–GO–PPO modifiers were noted in the presence of 0.1 mM KCl at a scan rate of 50 mV s−1. The entrapment of PPO onto the PEDOT–GO electrode considerably decreased the redox peak current of [Fe(CN)6]3−/4− compared with the other two modified electrodes. This confirms the presence of a non-conducting enzyme surface over the electrode.The impedimetric spectroscopy method predicts the ability of charge transfer on the PEDOT–GO–PPO-modified GC electrode. The EIS method monitors the charge transfer resistance (Rct) at the electrode/electrolyte interface. Fig. 4B shows the EIS diagrams for bare GC (curve a), PEDOT–GO (curve b) and PEDOT–GO–PPO (curve c) at a polarization potential of 25 mV in the frequency range of 1–100![[thin space (1/6-em)]](https://www.rsc.org/images/entities/char_2009.gif) 000 Hz. The Rct values obtained are 134, 118 and 3015 Ω, respectively. The Rct value of PEDOT–GO–PPO is very high compared to those of the other two electrodes. This result shows that non-conducting PPO enzymes are present in the bulk and on the surface for the detection of polyphenols. This might result in large enzymatic reaction pathways between the electrode and the electrolyte. This provides a suitable framework for dopamine biosensing. The EIS was evaluated, and the data of an analogous circuit were modelled for the constructed electrode in order to obtain information regarding the surface modification of the electrode with conducting materials and biomolecules. Therefore, the modified electrode agreed with the Randles equivalent circuit of Rs(Qdl(RctW)). In this circuit, Rs is the solution resistance, Qdl is the capacitance, Rct is the charge transfer resistance of the modified electrode PEDOT–GO–PPO and W is the Warburg element.
000 Hz. The Rct values obtained are 134, 118 and 3015 Ω, respectively. The Rct value of PEDOT–GO–PPO is very high compared to those of the other two electrodes. This result shows that non-conducting PPO enzymes are present in the bulk and on the surface for the detection of polyphenols. This might result in large enzymatic reaction pathways between the electrode and the electrolyte. This provides a suitable framework for dopamine biosensing. The EIS was evaluated, and the data of an analogous circuit were modelled for the constructed electrode in order to obtain information regarding the surface modification of the electrode with conducting materials and biomolecules. Therefore, the modified electrode agreed with the Randles equivalent circuit of Rs(Qdl(RctW)). In this circuit, Rs is the solution resistance, Qdl is the capacitance, Rct is the charge transfer resistance of the modified electrode PEDOT–GO–PPO and W is the Warburg element.
pH is one of the most important parameters for the amperometric response of a biosensor. Essentially, pH is the most influential parameter for biosensors. To regulate this, 0.1 mM dopamine was studied in various phosphate buffer solutions. To optimize the pH, we fixed the parameter with the response current for various applied pH values. The response currents for the biosensor at various pH values in the range of 4–8 were studied for 0.1 mM dopamine. Fig. 4C shows the effect of pH on the response current when the PEDOT–GO–PPO biosensor was used. The biosensor works well at a pH of 6.5 with maximum response current. The optimum pH was chosen for the development of a biosensor for dopamine.
The influence of potential on the response current of the PEDOT–GO–PPO biosensor containing 0.1 mM dopamine at pH 6.5 was studied. The potential was varied between 200 mV and −200 mV, and the response current was measured. Fig. 4D shows the plot between the response current and the potential. When the potential reached −100 mV, the response current approached the area of stability due to the rate limiting process of the substrate. Therefore, we exactly obtained the response current with a higher potential, and the possible interference was from other electroactive species at that specific potential. Hence, to obtain the maximum sensitivity and stability of the applied potential, −100 mV was set throughout the following experiments.
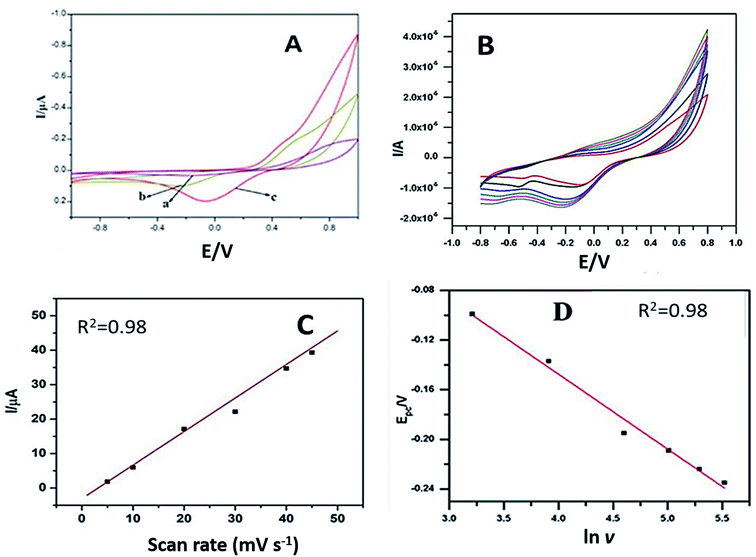
3.3. Cyclic voltammetric studies of dopamine using PEDOT–GO–PPO
Cyclic voltammograms of 50 μM dopamine were noted with plain GCE–PPO, PEDOT–PPO and PEDOT–GO–PPO at pH 6.5 and a scan rate of 50 mV s−1. Fig. 5A presents the cyclic voltammograms, and a broad redox peak with very low response current was observed for dopamine with bare GCE–PPO. The modification of PEDOT–PPO increases the redox peak currents as compared to those of bare GCE. PEDOT–GO–PPO results in a slight increase in the oxidation current and a very high increase in the reduction current. This is because of the reduction of o-dopaquinone formed from dopamine by enzymatic oxidation. The number of electrons (n) transferred in the modified electrode was calculated from the Laviron equation38 (equations are given in the ESI section†). The n value calculated from the equation was found to be 2.02. This confirms the 2 e− reduction of o-dopaquinone to dopamine at the modified electrode PEDOT–GO–PPO.The effect of scan rate on 100 μM dopamine in pH 6.5 was studied by cyclic voltammetry using the PEDOT–GO–PPO-modified GCE. The scan rate was varied in the range of 10–250 mV s−1 (Fig. 5B). The linearity between the square root of the scan rate and the cathodic peak current indicates diffusion-controlled reduction. Moreover, the electroactive area could be estimated by the Randles–Sevcik equation for the modified electrode, and it was 0.0452 cm2. The diffusion coefficient of enzymatically oxidized dopamine was obtained from the slope of the straight line obtained in the plot of Ipc versus ν1/2 (Fig. 5C).
From the slope of the Epc versus ln ν plot, b (slope) = RT/αnF, where n was 2.03 for enzymatically oxidized dopamine (Fig. 5D), and the value of the electron transfer coefficient α was found to be 0.0534 for dopamine. The standard heterogeneous rate constant, ks, for dopamine was calculated by the Laviron equation, and the ks for the electrochemical response was 0.363 s−1 for PEDOT–GO–PPO.
3.4. Effect of response current with dopamine concentration
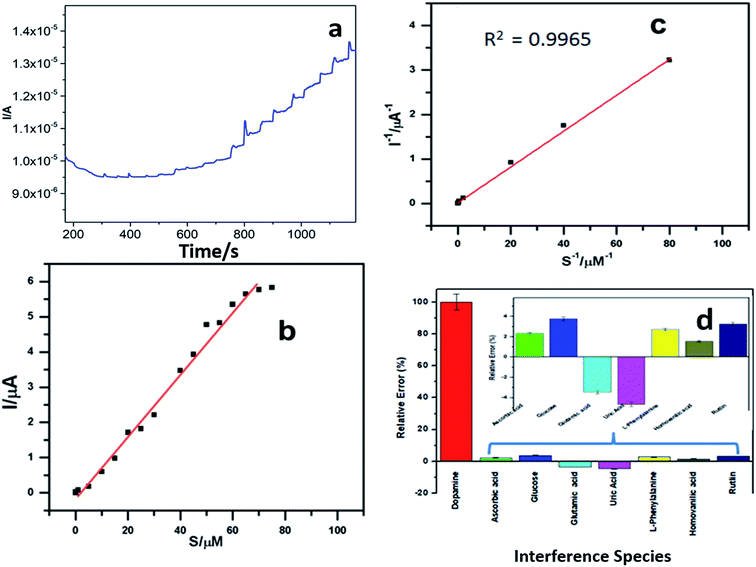
Fig. 6a shows the amperometric response current for different concentrations of dopamine in pH 6.5 buffer at −100 mV s−1 using the PEDOT–GO–PPO GCE. The relationship between the response current and dopamine concentration can be understood from the plot in Fig. 6b, and the detection limit of dopamine was estimated. The linear range of dopamine concentration was from 5 × 10⁻⁸ to 8.5 × 10⁻⁵ M. In this range, the enzyme catalytic reaction was of the first-order. After this linear range, the response current attains a steady state, and the reaction follows zero-order kinetics. The lower detection limit of determination was calculated to be 8 × 10⁻⁹, and it satisfies the demand of a convenient industrial usage sensor.The Michaelis–Menten constant (Km) was calculated using the amperometric method. The plot of inverse current and dopamine substrate concentration was used to find out the maximum current response (Imax) and Km from the intercept and slope (Fig. 6c). The Imax is 4.24 μA and the Km was found to be 70.34 μM for the PEDOT–GO–PPO-modified electrode. Since the Michaelis–Menten value is lower, the biosensor can be used to determine both low and high concentrations of dopamine since there is strong affinity of the enzyme on the electrode.39 The prepared electrode is compared with other existing electrodes40–45 in Table 1. The prepared electrode was used for real sample analysis, that is, human urine, and it shows good results towards the dopamine present in the human urine sample.
| S. No. | Modified electrode | Linear range | Limit of detection | pH | Detection technique | Ref. |
|---|---|---|---|---|---|---|
| 1 | Gold-Agaricus bisporus laccase enzyme electrode | 0.5 × 10⁻⁶ to 13.0 × 10⁻⁶ | 29 × 10−9 | 7.0 | DPV | 40 |
| 2 | Fe3O4@SiO2@vmSiO2–LAC/GCE | 1.5 × 10⁻⁶ to 75 × 10−6 | 0.177 × 10⁻⁶ | 6.0 | DPV | 41 |
| 3 | Poly(indole-5-carboxylic acid) (PIn5COOH)–PPO | 0.5 × 10⁻⁶ to 20 × 10−6 | 0.1 × 10⁻⁶ | 6.5 | Amperometric | 42 |
| 4 | C3N4-TYR | 1 × 10⁻³ to 3 × 10⁻⁸ | 3 × 10⁻⁸ | 6.8 | Fluorescent sensor | 43 |
| 5 | Tyrosinase/MWNT/GCE | 50 × 10−6 to 1000 × 10−6 | 50 × 10−6 | 7.0 | Amperometric | 44 |
| 6 | Au–CoP–Tyr-modified electrode | 2 × 10⁻⁶ to 30 × 10−6 | 0.43 × 10⁻⁶ | 8.0 | DPV | 45 |
| 7 | PEDOT–GO–PPO | 5 × 10⁻⁸ to 8.5 × 10⁻⁵ | 8 × 10⁻⁹ | 6.5 | Amperometric | This work |
The amperometric study for potential interferents such as glutamic acid, glucose, ascorbic acid, uric acid, L-phenylalanine, homovanilic acid and rutin in phosphate buffer solution (pH 6.5) of dopamine is presented in Fig. 6d. The interfering foreign molecules were added one after the other in the same solution, and the percentage of interfering agent involved in the experiment was evaluated. Very low amount of current was produced by the interfering agents as compared to that with dopamine. Since there is a negligible amount of current change of the prepared electrode, the selectivity of the modified electrode is significant towards the detection of dopamine.
3.5. Effect of temperature and stability
The effect of the temperature on the PEDOT–GO–PPO electrode was recorded with 50 μM dopamine at a temperature range of 0 to 50 °C using the PEDOT–GO–PPO biosensor at pH 6.5. The optimum temperature for the biosensor in terms of stability was investigated by changing the temperature using a controlled thermostatic bath. As the temperature increases, the response current increases up to 45 °C, and then gradually decreases (Fig. 7a). This clearly shows that the denaturation of PPO up to 45 °C was not observed. The activation energy was calculated using the Arrhenius equation46 by replacing ln k with ln I. From the linear plot obtained from the relationship of ln I versus 1/T, the activation energy was calculated. Fig. 7b shows the value of Ea for PEDOT–GO–PPO in the pH 6.5 buffer, which is 32.75 kJ mol−1.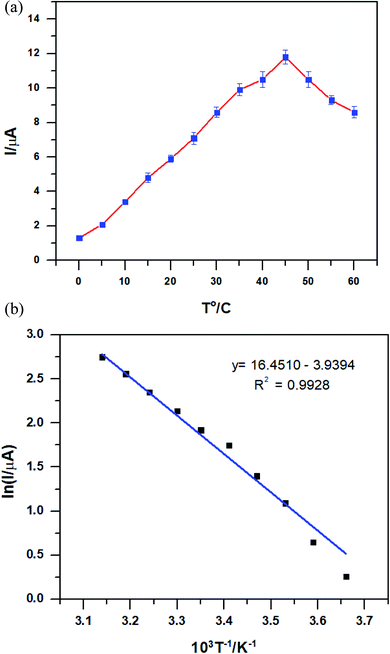 | ||
| Fig. 7 (a) The relationship between response current and temperature in 50 μM dopamine of the PEDOT–GO–PPO-modified electrodes. (b) Plot of ln I versus 1/T according to the data in (a). | ||
Stability is a key element of electrode performance, and it was investigated by measuring the response current for 0.1 mM dopamine in pH 6.5 at −100 mV every 5 days. Fig. 8a shows the stability of the electrode. The relative values were analysed and acquired from 30 consecutive measurements, indicating that the PEDOT–GO–PPO biosensor for dopamine has acceptable repeatability (Fig. 8b). After 80 days, the reaction of the bioelectrode current progressively diminishes and retains around 64% of its initial value. The stability of the PEDOT–GO–PPO biosensor possessing high response current shows the relatively good stability of the biosensor. The storage stability of the enzymatic biosensors was evaluated by tracing the electrode response in 0.1 mM dopamine, and the electrode was stored at 4 °C in the dark and subjected to measurements every 5 days. The activity was retained after 25 days with 74% of the initial value.
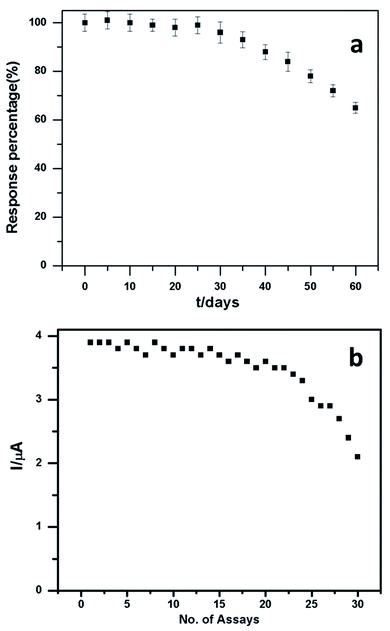 | ||
| Fig. 8 (a) The stability of the PEDOT–GO–PPO biosensor towards 50 μM dopamine. (b) Assay study of dopamine of the PEDOT–GO–PPO biosensor towards 50 μM dopamine. | ||
The performance of the fabricated biosensor was compared with the existing method of HPLC. The quantification of dopamine in human urine extract was performed. We spiked dopamine into a human urine extract sample. The human urine sample was investigated using the standard addition method. Human serum was obtained from the Jaya Institute of Technology, and human urine was supplied by an adult male student at the institute. The addition of three different dopamine concentrations was measured using the developed biosensor. The quantification and percentage of recovery were determined, and the results are presented in Table ST1.†
HPLC was performed for the determination of dopamine in the same human urine extract samples by the external standard method. Different concentrations of dopamine present in human urine were determined by the addition method. Quantification of dopamine and recovery percentages were calculated from the obtained results. The results obtained from the present method and HPLC are significantly comparable, and hence the developed biosensor is extremely good for use in the determination of dopamine in human urine samples.
4. Conclusion
In this work, we developed a PEDOT–GO–PPO film by a one-pot electrochemical synthetic method. The maximum response current was observed at pH 6.5. The relationship between the response current and dopamine concentration was studied by the amperometric method. The linear range obtained for the concentration of dopamine was from 5 × 10⁻⁸ to 3.5 × 10⁻⁴ M, and the lower limit of detection was 8 × 10⁻⁹ M. The Km was 70.34 μM and the Ea of the PPO catalytic reaction was 32.75 kJ mol−1. The storage stability of the enzymatic sensors was evaluated by tracing the electrode responses to 0.1 mM dopamine, and it showed 74% in 25 days with 5 days per measurement. The determination of dopamine in real samples (human urine sample) was performed.Ethical statement
The authors state that for investigations involving human subjects, informed consent was obtained from all human subjects.Conflicts of interest
The authors declare the absence of any conflict of interest.Acknowledgements
The project was supported by the Researchers Supporting Project (number RSP-2021/231), King Saud University, Riyadh, Saudi Arabia.References
- S. Ikemoto, Brain Res. Rev., 2007, 56, 27–78 CrossRef CAS PubMed.
- J. R. Wickens, J. C. Horvitz, R. M. Costa and S. J. Killcross, Neuroscience, 2007, 27, 8181–8183 CrossRef CAS PubMed.
- T. S. Tang, X. Chen, J. Liu and I. Bezprozvanny, Neuroscience, 2007, 27, 7899–7910 CrossRef CAS PubMed.
- (a) H. M. Zhang, N. Q. Liu and Z. Zhu, Microchem. J., 2000, 64, 277–282 CrossRef CAS; (b) H. Zhao, Y. Zhang and Z. Yuan, Anal. Chim. Acta, 2001, 441, 117 CrossRef CAS.
- C. H. Lin, C. Y. Hsiao, C. H. Hung, Y. R. Lo, C. C. Lee, C. J. Su, H. C. Lin, F. H. Ko, T. Y. Huang and Y. S. Yang, Chem. Commun., 2008, 30, 5749–5751 RSC.
- K. Gagandeep, K. Anupreet and K. Harpreet, Polym.-Plast. Technol. Mater., 2021, 60, 504–521 Search PubMed.
- S. Banerjee, M. Stephanie, Md F. Hossain and G. Slaughter, Biosensors, 2020, 10, 101 CrossRef CAS PubMed.
- L. You-Na, O. Koichi, H. Tomoko, I. Tatsuya, T. Kazuhiro, H. Toshiaki and S. Kazuaki, Talanta, 2018, 179, 569–574 CrossRef PubMed.
- R. D. Crapnell, H. Alexander, W. F. Christopher, E. Kasper, V. G. Bart, J. C. Thomas, E. B. Craig and P. Marloes, Sensors, 2019, 19, 1204 CrossRef CAS PubMed.
- E. E. Saheed, S. A. Abolanle, E. F. Omolola, B. M. Bhekie, T. I. N. Thabo, El-S. M. Sherif and E. E. Ebenso, NanoSelect, 2020, 1, 561–611 Search PubMed.
- G. Z. Faezeh, M. Hichem, A. Metin, O. D. Dilek and T. Suna, TrAC, Trends Anal. Chem., 2019, 118, 264–276 CrossRef.
- X. Guangyuan, A. J. Zahraa, D. Valentin, A. K. Paul and T.-S. Jadranka, Biosens. Bioelectron., 2018, 107, 184–191 CrossRef PubMed.
- V. K. Laure and J. L. Darren, Adv. Mater., 2019, 31, 1806133 CrossRef PubMed.
- Z. Weihua, Z. Min, L. Weifen, Y. Shangmin, N. Liting, L. Gengen, L. Haifeng and L. Weilu, J. Electroanal. Chem., 2018, 813, 75–82 CrossRef.
- E. Houda, B. Houcine, K. Sofia and T. G. Stella, Electroanalysis, 2020, 32, 1546–1558 CrossRef.
- C. Ratlam, S. Phanichphant and S. Sriwichai, J. Polym. Res., 2020, 27, 183 CrossRef CAS.
- H. Mehthab, R. K. R. Gajjala, N. Bommireddy and S. K. Palathedath, Chem. Phys. Lett., 2020, 740, 137086 CrossRef.
- R. Murugesan, M. Ramu, C. K. Byung, B. Matthieu, H. Y. Kook and C. Justin Raj, Electrochim. Acta, 2020, 354, 136669 CrossRef.
- G. Ijaz, M. Sheeraz Ahmad, S. M. Saqlan Naqvi, H. Ansar, W. Rahmat, A. F. Ammad and A. Ibrar, J. Appl. Biol. Biotechnol., 2017, 5, 072–085 CrossRef.
- I. M. Taylor, E. M. Robbins, K. A. Catt, P. A. Cody, C. L. Happe and X. T. Cui, Biosens. Bioelectron., 2017, 89, 400–410 CrossRef CAS PubMed.
- W. Si, L. Wu, Z. Yuehua, X. Mingzhu, W. Fengyun and H. Qingli, Electrochim. Acta, 2012, 85, 295–301 CrossRef CAS.
- H. Xin, S. Weishan, L. Jing, B. Ning, Y. Chunmei and G. Haiying, Anal. Chim. Acta, 2012, 85, 295–301 Search PubMed.
- U. Z. Kamal, S. A. Ayesha, A. A. Sharique and N. Ishrat, Biochem. Res. Int., 2014, 854687 Search PubMed.
- R. K. Santosh, V. L. Suhas, C. Nagasuma and R. G. Lalitha, FEBS J., 2007, 274, 4177–4187 CrossRef PubMed.
- M. David, M. Florescu and C. Bala, Biosensors, 2020, 10, 112 CrossRef CAS PubMed.
- S. Baluta, D. Zając, A. Szyszka, K. Malecha and J. Cabaj, Sensors, 2020, 20, 423 CrossRef CAS PubMed.
- Q. Lu, Z. Qi, T. Yang, C. Zhai, D. Wang and M. Zhang, ACS Appl. Mater. Interfaces, 2018, 10(15), 12947 CrossRef CAS PubMed.
- S. Aftab, I. Akhtar, Y. Seo and J. Eom, ACS Appl. Mater. Interfaces, 2020, 12(37), 42007 CrossRef CAS PubMed.
- S. Aftab, M. F. Khan, P. Gautam, H. Noh and J. Eom, Nanoscale, 2019, 11, 9518 RSC.
- S. Aftab, Samiya, M. W. Iqbal, P. A. Shinde, A. ur Rehman, S. Yousuf, S. Park and S. Chan Jun, Nanoscale, 2020, 12, 18171 RSC.
- S. Aftab, et al., Nanoscale, 2020, 12, 15687 RSC.
- S. Aftab, et al., J. Mater. Chem. C, 2021, 9, 199 RSC.
- S. Aftab, et al., Nanotechnology, 2021, 32, 285701 CrossRef CAS PubMed.
- S. Aftab, et al., Nanotechnology, 2018, 29, 045201 CrossRef PubMed.
- J. F. Erkka, G. Lijo, E. Alexander, H. Mari, P. Jenni and L. Erkki, Fullerenes, Nanotubes, Carbon Nanostruct., 2015, 23, 755–759 CrossRef.
- S. Venkatesan, M. Perumal and M. Paramasivam, Anal. Methods, 2013, 5, 6523–6530 RSC.
- A. El-Beqqali, K. Anders and M. Abdel-Rehim, J. Sep. Sci., 2007, 30, 421–424 CrossRef CAS PubMed.
- A. C. Anithaa, N. Lavanya, K. Asokan and C. Sekar, Electrochim. Acta, 2015, 167, 295–302 CrossRef.
- P. S. Todd and E. G. David, J. Chem. Educ., 2010, 87, 905–907 CrossRef.
- K. S. Reza and A. Akbar, Bioelectrochemistry, 2012, 84, 25–31 CrossRef PubMed.
- Z. Li, Y. Zheng and T. Gao, et al., J. Mater. Sci., 2018, 53, 7996–8008 CrossRef CAS.
- J. Maciejewska, K. Pisarek, I. Bartosiewicz, P. Krysiński, K. Jackowska and A. T. Bieguński, Electrochim. Acta, 2011, 56, 3700–3706 CrossRef CAS.
- L. Hao, Y. Manman, L. Juan, Z. Yalin, Y. Yanmei, H. Hui, L. Yang and K. Zhenhui, Nanoscale, 2015, 7, 12068–12075 RSC.
- S. F. Rahman, K. Min and S. H. Park, Korean J. Chem. Eng., 2016, 33, 3442–3447 CrossRef CAS.
- M. Florescu and M. David, Sensors, 2017, 17, 1314 CrossRef PubMed.
- V. Sethuraman, P. Muthuraja, M. Sethupathy and P. Manisankar, Electroanalysis, 2014, 26, 1958–1965 CrossRef CAS.
Footnote |
| † Electronic supplementary information (ESI) available. See https://doi.org/10.1039/d2ra00791f |
| This journal is © The Royal Society of Chemistry 2022 |

