 Open Access Article
In situ synthesis of TiO2/NC on cotton fibers with antibacterial properties and recyclable photocatalytic degradation of dyes†
Wei
Chen
a,
Xiaolin
Feng
b,
Danyin
Zhang
b,
Fangfang
Lu
c,
Hairong
Wang
c,
Jiacheng
Tan
b,
Qiao
Xu
ab,
Yongkun
Liu
b,
Zhihai
Cao
 *a and
Xiuping
Su
 *ab
*ab
aKey Laboratory of Advanced Textile Materials and Manufacturing Technology and Engineering Research Center for Eco-Dyeing & Finishing of Textiles, Ministry of Education, Zhejiang Sci-Tech University, Hangzhou, 310018, China. E-mail: zhcao@zstu.edu.cn; suxiuping@usx.edu.cn; suxiuping0577@163.com
bShaoxing University Yuanpei College, Shaoxing, Zhejiang 312000, China
cZhoushan Institute of Calibration and Testing for Quality and Technology Supervision, Zhoushan, Zhejiang 316000, China
First published on 8th July 2022
Abstract
A cotton fabric/titanium dioxide-nanocellulose (TiO2-Cot.) flexible and recyclable composite material with highly photocatalytic degradation of dyes and antibacterial properties was synthesized. During the preparation process, nano-TiO2 particles were synthesized through an in situ strategy and grown on cotton fiber, and were wrapped with cellulose nanocrystals (NC). The prepared TiO2-Cot. was characterized by field emission scanning electron microscopy (FESEM), X-ray diffraction (XRD) and Fourier transform infrared spectroscopy (FTIR). The SEM and EDS results showed that nano-TiO2 particles were evenly distributed on the fiber surface. The prepared TiO2@Cot. has excellent photocatalytic efficiency of 95.68% for MB and 92.77% for AR under weak ultraviolet irradiation over 6 h. At the same time, it has excellent antibacterial activity against S. aureus and E. coli. The stability and reusability of the materials were also investigated.
1. Introduction
Cotton fabric has been widely employed in the fields of home textiles, clothing, military and medical fields owing to its excellent moisture absorption and dehumidification, wearing comfort, flexibility, and environmental protection. However, due to its strong water absorption, cotton fabric can easily breed bacteria and become smelly in the course of use, is difficult to clean after being polluted, and easily ages and yellows. To solve this problem, researchers usually modify cotton fabrics by improving their hydrophobicity with a coating method1 or chemical grafting,2 but the former method causes significant deterioration in the feel of the fabric, while the latter causes significant deterioration in the strength fabric and yellowing of the fabric. In addition, due to the enhancement in its hydrophobicity, the moisture absorption and dehumidification of the fabric are no longer excellent, so the wearing comfort is reduced.Recently, many efforts have been made to improve the self-cleaning function and the ability to decompose environmental pollutants by introducing some inorganic micro-catalysts with photocatalytic and antibacterial functions onto the surface of fabrics by an in situ method due to their advantages of large surface area and high degradation rate.3 Montazer4et al. synthesized nano-Cu2O on cotton fabric using the precursor of CuSO4 and a reduction of glucose in alkali. The modified fabrics showed significant photocatalytic activity toward methylene blue (MB) and excellent antibacterial activity against S. aureus and E. coli. R. Aladpoosh5 prepared self-cleaning cotton fabric through in situ phytosynthesis of star-like Ag/ZnO particles onto the surface. The treated composite fabric exhibited photocatalytic activity along with an improvement in wettability and whiteness. Hao6et al. prepared a bifunctional cotton fabric with both photothermal and photocatalytic properties by in situ polymerization of pyrrole (Py) on the cotton and subsequent deposition of titanium dioxide (TiO2) nanoparticles. The material demonstrated good catalytic degradation of dyes. Compared with other micro-catalysts such as ZnO7 and SnO2,8 TiO2 has the unique advantages of chemical stability, strong oxidation, and non-toxic properties,9 which have always been used in the field of photocatalysis, skincare and sunscreens, antibacterial and other fields.10,11
In this paper, photocatalytic self-cleaning and antibacterial cotton fabrics were prepared by incorporating nano-TiO2 (TiO2@Cot.) through an in situ strategy. At the same time, nano-TiO2 particles were fixed on the surface of cotton fiber by nanocellulose (NC) to achieve durability and uniformity of distribution. NC can be derived from plants, marine shellfish and bacteria, and have the advantages of being flexible, degradable, hydrophilic and rich in surface groups. It has been used as an interface “bridge” between inorganic nanomaterials and polymer materials, so NC is an ideal choice in the interface chemistry of composite materials.12 Herein, the introduced TiO2 endows the cotton fabric with photocatalysis and bacteriostasis, while the existence of NC promotes the catalytic effect and stability of TiO2@Cot.
2. Experimental section
2.1 Materials
Cotton fabrics (plain weave, 134 g m−2) were bought from the Hongda weaving factory (Hebei, China). Tetrabutyl titanate, absolute ethanol, HNO3, urea, NaOH, methylene blue (MB) and acid red (AR), were purchased from Macklin Biochemical Technology Co., Ltd (Shanghai, China). Absorbent cotton was purchased from Hualu Sanitary Materials Co., Ltd (Shangdong, China). All solvents and chemicals were analytically pure and did not require further treatment.2.2 Preparation of TiO2@Cot
Preparation of the NC: the crushed absorbent cotton was dissolved in a mixed solution of 7 wt% NaOH and 12 wt% urea. After that, the prepared solution was filtered and freeze-dried at −80 °C for 48 h to obtain NC.The desized cotton fabric (Cot., 2 × 2 cm2) was put into a mixed solution of citric acid 6 wt% sodium hypophosphite 6 wt% with a volume ratio of 1![[thin space (1/6-em)]](https://www.rsc.org/images/entities/char_2009.gif) :
:![[thin space (1/6-em)]](https://www.rsc.org/images/entities/char_2009.gif) 1 and stirred for 1 h at an ambient temperature of 25 °C. Subsequently, the fabric was washed several times with deionized water and dried in a vacuum oven for 4 h. The modified cotton fabric (Cot., 2 × 2 cm2) was put into a mixed solution of 50 mL of tetrabutyl titanate and absolute ethanol (volume ratio 1
1 and stirred for 1 h at an ambient temperature of 25 °C. Subsequently, the fabric was washed several times with deionized water and dried in a vacuum oven for 4 h. The modified cotton fabric (Cot., 2 × 2 cm2) was put into a mixed solution of 50 mL of tetrabutyl titanate and absolute ethanol (volume ratio 1![[thin space (1/6-em)]](https://www.rsc.org/images/entities/char_2009.gif) :
:![[thin space (1/6-em)]](https://www.rsc.org/images/entities/char_2009.gif) 4) for 30 min. 2 g of NC was then added to the above mixture and stirred for 30 min. After that, the mixture was added dropwise to 0.04 M/L HNO3 aqueous solution and stirred for 96 h. The titanium ions on the surface of the cotton fiber were reduced in situ to titanium dioxide. Then the fabric was pre-baked in an oven at 50 °C for 5 min and further baked at 70 °C for 5 min. Finally, TiO2@Cot. was obtained after washing and drying. The reaction mechanism is shown in Fig. 1.
4) for 30 min. 2 g of NC was then added to the above mixture and stirred for 30 min. After that, the mixture was added dropwise to 0.04 M/L HNO3 aqueous solution and stirred for 96 h. The titanium ions on the surface of the cotton fiber were reduced in situ to titanium dioxide. Then the fabric was pre-baked in an oven at 50 °C for 5 min and further baked at 70 °C for 5 min. Finally, TiO2@Cot. was obtained after washing and drying. The reaction mechanism is shown in Fig. 1.
2.3 Characterization
The microscopic surface morphologies were observed by field emission scanning electron microscopy (FESEM, JSM-5610, JEOL, Japan) equipped with energy dispersive spectroscopic (EDS), operating at 3 kV acceleration voltage. A Fourier-transform infrared (FTIR) spectrometer (FTIR, Nicolet IS50, Thermo, USA) equipped with an ATR accessory was used to examine the chemical groups of the sample. All spectra were recorded in the range from 4000 to 450 cm−1 with 4 cm−1 resolution. X-ray photoelectron spectroscopy (XPS, K-Alpha Thermo, USA) data was obtained using an electronic spectrometer. The crystal phase of the samples was tested with an X-ray diffractometer (XRD, D8, Bruker, Germany). The quantitative test of TiO2 was quantified through atomic absorption spectrometry (AAS, Sollar M6, Thermo, USA) with air-acetylene flame. Separate hollow cathode lamps radiating at wavelengths of 248.3 (Ti) were used to determine the amount of Ti. The mechanical strength of the samples was tested through a universal testing machine (Instron 5943, USA) according to the GB/T18318-2011 standard. The optical properties of the samples were studied with a UV-vis spectrophotometer (Hitachi U-2900, Japan) in the wavelength range of 200–800 nm.2.4 Photocatalytic performance
Two samples of TiO2@Cot. (2 × 2 cm2) were immersed in a culture dish with 20 mL of simulated pollutants of MB solution (20 mg L−1) and AR solution (20 mg L−1) and stored in the dark to reach absorption–desorption equilibrium. After 120 min, the simulated pollutants with TiO2@Cot. were exposed to an ultraviolet source without any filter (ultraviolet 36L lightbox equipped with a 8 W mercury lamp, Karma, China) for preset times and the concentration and color changes over the whole process were monitored. The distance between the ultraviolet source and the sample was about 15 cm. We performed cycling tests of the sample by simply washing it with distilled water for the next cycle of photocatalysis. The degradation rate of the dyes was analyzed with the UV absorption spectrum. The degradation rate calculation equation is shown in eqn (1). | (1) |
C 0 is the initial concentration (ppm) of MB or AR, and Ct is the concentration (ppm) of MB or AR at time t (min).
2.5 Antibacterial properties
Gram-negative Escherichia coli (E. coli, ATCC 43895) and Gram-positive Staphylococcus aureus (S. aureus, ATCC 6538) were used as representatives of Gram-negative and Gram-positive bacteria in the antibacterial properties test. The antibacterial properties and bacteriostatic rate of the samples were evaluated. In brief, the bacterial density is about 1 × 10⁴ CFU mL−1, and the antibacterial properties of Cot. and TiO2@Cot. were tested according to the evaluation method of bacterial resistance finishing on textile materials according to AATCC 100-2004.13 We performed cycling tests of the sample by simply washing it with distilled water for the next cycle of antibacterial properties tests. The bacteriostatic rate of the sample was calculated according to eqn (2). | (2) |
where N0 is the mean colony number of the solid medium corresponding to unmodified cotton fabric, and N1 is the mean colony number of the solid medium corresponding to antibacterial TiO2@Cot.
3. Results and discussion
3.1 Microscopic surface structure
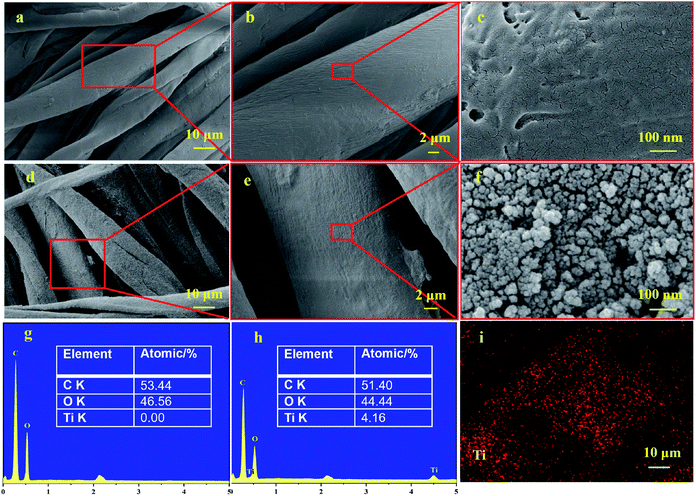
The microscopic surface structures of Cot. and TiO2@Cot. were observed by FESEM and are shown in Fig. 2. From Fig. 2a and c, the bare cotton fibers have obvious twists and the surface of fibers was smooth. While TiO2@Cot. became rough without obvious damage. Higher-resolution FESEM images in Fig. 2f show the surface of the TiO2@Cot. sample has an even distribution of NPs on the individual fibers. According to the EDS results in Fig. 2h, TiO2 has been successfully deposited on cotton fabric, and the atomic percentage of Ti on the fabric surface is about 4.16%. The mapping in Fig. 2i indicates that the TiO2 is distributed homogeneously on the surface of the cotton fabric with high density. | ||
| Fig. 2 Microstructure and elemental compositions of Cot. and TiO2@Cot. (a–c) SEM of Cot., (d–f) SEM of TiO2@Cot., (g and h) EDS of Cot. and TiO2@Cot., respectively, (i) EDS mapping of TiO2@Cot. | ||
3.2 Chemical characterization
FTIR and XPS were performed to chemically characterize the functionalized textiles TiO2@Cot. and Cot., as shown in Fig. 3. In particular, C–O stretching was seen at 1032 cm−1, adsorbed water at 1645 cm−1, CH stretching at 2898 cm−1, and OH stretching was seen at 3335 cm−1. The pristine cotton fabric shows the well-known bands associated with pure cellulose in Fig. 3a. Compared with Cot. the FTIR data of TiO2@Cot. show several peaks at different wavenumbers. The peak at 597 cm−1 was typically attributed to Ti–O–Ti.14 In addition, Fig. 3b shows a survey scan XPS spectrum of TiO2@Cot, and the spectrum revealed that the main elements on the sample surface were O, Ti and C. Fig. 3c presents the Ti (2p1/2, 2p3/2) spectra. The binding energies of Ti 2p1/2 and Ti 2p3/2 were 464.3 and 458.5 eV, respectively, indicating the typical presence of Ti4+ (TiO2).15 Therefore, the XPS and FTIR results further confirmed the formation of TiO2via the aforementioned preparation approach. | ||
| Fig. 3 ATR-FTIR and XPS spectra of Cot. and TiO2@Cot. (a) ATR-FTIR spectra of Cot. and TiO2@Cot. (b) XPS spectra of Cot. and TiO2@Cot. (c) High-resolution XPS spectra of Cot. and TiO2@Cot. | ||
3.3 Crystal phase structure analysis
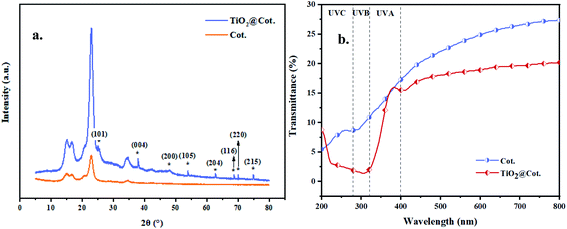
XRD spectrograms of Cot. and TiO2@Cot. were tested to analyze the crystal phase, and the results are shown in Fig. 4a. For Cot., the three peaks at 2θ = 14.93, 16.75 and 22.99° represent the crystal phase structure of cellulose crystal. While for TiO2@Cot., there are 8 new sharp diffraction peaks, located at 2θ = 25.4, 37.9, 48.2, 53.8, 62.8, 68.8, 70.4 and 75.1°. Through phase analysis, these diffraction peaks correspond to the 101, 004, 200, 105, 204, 116, 220 and 215 crystal planes formed by anatase crystallization of nano titanium dioxide. The results further proved that nano-TiO2 particles were successfully deposited on the surface of the cotton fiber. | ||
| Fig. 4 (a) XRD spectrograms of Cot. and TiO2@Cot. (b) UV-vis diffuse reflectance spectra of Cot. and TiO2@Cot. | ||
3.4 Photocatalytic and durability performance
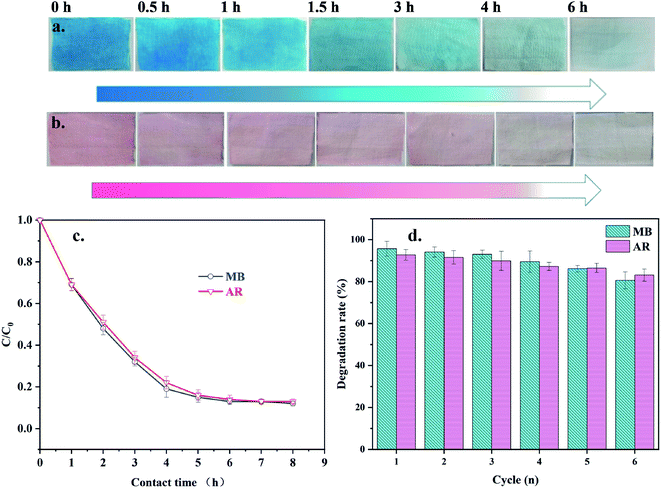
To investigate the self-cleaning effect of TiO2@Cot. on pollutants, the light removal values for the MB and AR dye pollutants by the sample were tested. The results are shown in Fig. 5. Six reaction times were set to degrade MB and AR using TiO2@Cot., which were 0.5, 1, 1.5, 3, 4, and 6 hours. The degradation rate of the dyes after light irradiation was then calculated from the corresponding absorption intensity in eqn (1). As shown in Fig. 5c, the degradation rates by TiO2@Cot. for MB and AR after 6 h reached 95.68% and 92.77%, respectively. Fig. 5a and b show the colors of TiO2@Cot. dyed with MB and AR under light, respectively. After 0.5 h of light, the dye color on the fabric obviously began to lighten and disappeared after 6 h, which means that TiO2@Cot. has the ability to photocatalytically degrade dyes. Fig. 5d shows the cycling degradation by TiO2@Cot. of dyes MB and AR. With an increase in the cycling degradation times, the ability of TiO2@Cot. to remove dyes gradually weakened. In the sixth cycle of the degradation experiment, the removal rates of MB and AR were 80.56% and 83.09%, respectively. Moreover, a comparison of the photocatalytic degradation rate of the MB dye in Table 1 shows that TiO2@Cot. has high photocatalytic efficiency and good recycling performance.| Samples | The maximum degradation rate of dye (%) | Reference |
|---|---|---|
| TiO2/porous boron nitride | 96.50% | Xie19et al. 2017 |
| Nanosheet composites | ||
| TiO2/g-C3N4 cotton fabrics | 92.50% | Wang20et al. 2019 |
| TiO2/cotton/paper | 60% | Biswas21et al. 2021 |
| TiO2 nanoparticles cotton fabrics | 91% | Muhammad22et al. 2018 |
| TiO2@Cot. | 95.68% | This work |
Nano-TiO2 can produce photogenerated electrons and holes H+ under light irradiation, while oxygen molecules adsorbed on the surface of TiO2 collide with photogenerated electrons to form superoxide radicals, and negatively charged superoxide radicals can react with water molecules to form hydroxyl radicals. These types of free radicals all show strong oxidation, so they can degrade dyes into small molecules such as alcohols and acids.16 The existence of NC can not only stabilize nano-TiO2 but also enrich dyes on the surface of nano-TiO2 and improve the degradation efficiency.
The durability of composite materials in recycling is crucial. The stability of the materials was first tested by FESEM (Fig. S2†). The results show that the surface structure of the materials before and after recycling does not obviously change. Furthermore, the content of TiO2 was quantified through AAS analysis to further investigate the durability of the samples before and after recycling. From Table 2, the contents of TiO2 per 1 gram of TiO2@Cot. before and after recycling were 25.17 ± 1.78 mg g−1 and 22.17 ± 2.06 mg g−1, respectively. The content of titanium dioxide in the samples did not decrease significantly. The above results indicate the stability and durability of the sample, which are also what makes it possible to recycle catalysts. Mechanical tests from Table 1 also further illustrate the stability and durability of the sample. The breaking strength and elongation at break of TiO2@Cot. were 271.73 N and 2.52%, respectively. After the sixth cycle of the degradation experiment, the values decreased by only 5.00% and 3.17%, respectively. While for Cot., the breaking strength and elongation at break were 276.51 N and 3.21%, decreases of 4.11% and 6.85%, respectively. The loss ratio of mechanical strength of TiO2@Cot. was lower than that of Cot., which means TiO2@Cot. shows strong UV resistance. Nano-TiO2 has high refraction and high light activity, and it can absorb ultraviolet in the medium wave region because of its small particle size, to realize resistance to ultraviolet aging by the fabric.17,18 In further experiments in this work, Fig. 4b gives the diffuse reflectance spectra results of TiO2@Cot. and Cot. As can be seen, there is a sharp decline in transmittance for wavelengths of less than 400 nm, which is evidence of the presence of TiO2. The UVB is in the range of 280−320 nm and the UVA is between 320 and 400 nm. The high quality of UVB and UVA shielding properties of TiO2@Cot. could make such samples desirable for use as optical materials and in some biomedical applications.
| Samples | TiO2/TiO2@Cot. (mg g−1) | Breaking strength (N) | Elongation at break (%) |
|---|---|---|---|
| Cot. | — | 276.51 ± 1.67 | 3.21 ± 0.12 |
| TiO2@Cot. | 25.17 ± 1.78 | 271.73 ± 1.52 | 2.52 ± 0.31 |
| TiO2@Cot. after sixth cycle | 22.17 ± 2.06 | 258.13 ± 1.24 | 2.44 ± 0.21 |
3.5 Antibacterial properties
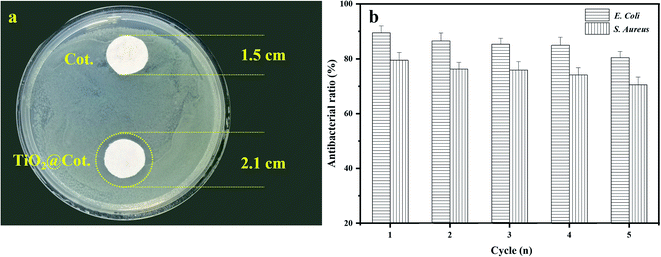
The antibacterial properties and bacteriostatic rate of TiO2@Cot were evaluated, as shown in Fig. 6. Herein, Gram-negative E. coli and Gram-positive S. aureus were used as representatives of Gram-negative and Gram-positive bacteria, respectively. Cot. and TiO2@Cot. with a diameter of 1.5 cm were placed into a culture medium containing E. coli. The bacteriostatic circles around the sample after 24 hours are shown in Fig. 6a. There was no bacteriostatic circle around Cot. on the top, but a bacteriostatic circle with a diameter of 2.1 cm appeared around TiO2@Cot., which had diffused by 3 mm compared with Cot. This proved that the latter shows an obvious antibacterial ability. Fig. 6b shows bacteriostatic rate change of TiO2@Cot. to E. coli and S. aureus with the number of recycles. The initial antibacterial ratios of TiO2@Cot. to E. coli and S. aureus were 89.47% and 79.44%, respectively. The antibacterial rates of the two bacteria decreased slightly with an increase in the number of cycles. In the fifth cycle, the antibacterial rates were 80.41% and 70.48%, respectively. The results show that TiO2@Cot. had excellent antibacterial properties against both bacteria. | ||
| Fig. 6 Antimicrobial activity of TiO2@Cot. (a) Bacteriostatic zone of TiO2@Cot. for E. coli, (b) bacteriostatic rate of TiO2@Cot. for E. coli and S. aureus. | ||
4. Conclusion
In this paper, a self-cleaning and antibacterial cotton fabric with recyclable photocatalytic degradation was achieved by incorporating nano-TiO2 through an in situ method and fixing with NC. The prepared TiO2@Cot. showed an excellent photocatalytic effect on both the dyes MB and AR, whose removal rate could reach 95.68% and 92.77%, respectively, after 6 hours of UV irradiation,. After 6 cycles, the removal rates were still as high as 80.56% and 83.09%, respectively. Furthermore, TiO2@Cot. has excellent and recyclable antibacterial properties, whose fifth antibacterial ratios of TiO2@Cot. for E. coli and S. aureus were 80.41% and 70.48%, respectively. In addition, SEM and AAS test results showed that the composite material exhibits good stability in the course of use.Conflicts of interest
There are no conflicts to declare.Acknowledgements
This research was supported by the Zhejiang Provincial Natural Science Foundation of China under Grant no. LGF21E030002, the national innovation and entrepreneurship training program for College Students no. 202110349010, and the Technology Planning Project of Zhoushan no. 2022C31068.References
- W. L. Li, H. P. Wang and Z. X. Li, Polym. Adv. Technol., 2019, 30(9), 321–2330 Search PubMed.
- J. D. Wu, C. Zhang and D. J. Jiang, RSC Adv., 2016, 6(29), 24076–24082 RSC.
- Y. B. Feng, H. Wang, G. h. Li, P. X. Cui, H. Li, Z. M. Sun, K. W. Wang, X. Zhang, Y. H. Gao, X. Y. Huang, K. Zhu, D. Pan, S. C. Man, W. Li, B. P Zhou and C. Wang, ACS Appl. Bio Mater., 2021, 4(5), 4345–4353 CrossRef CAS.
- M. Montazer, M. Dastjerdi, M. Azdaloo and M. Rad, Cellulose, 2015, 22(6), 4049–4064 CrossRef CAS.
- R. Aladpoosh and M. Montazer, Carbohydr. Polym., 2016, 141, 116–125 CrossRef CAS.
- D. D. Hao, Y. D. Yang, B. Xu and Z. S. Cai, ACS Sustainable Chem. Eng., 2018, 6, 10789–10797 CrossRef CAS.
- N. Akbari, F. N. Chianeh and A. Arab, J. Appl. Electrochem., 2021, 52(1), 189–202 CrossRef.
- Z. M. Qi, K. Wang, Y. L. Jiang, Y. P. Zhu, X. M. Chen, Q. Tang, Y. Ren, C. H. Zheng, D. W. Gao and C. X. Wang, Cellulose, 2019, 26(16), 8919–8937 CrossRef CAS.
- T. I. Shaheen, S. Zaghloul and S. S. Salem, Ind. Eng. Chem. Res., 2019, 58, 20203–20212 CrossRef CAS.
- L. H. Luo, R. J. Kendall and S. Ramkumar, J. Environ. Chem. Eng., 2020, 8(5), 103914 CrossRef.
- J. Yue, C. Wan and L. Jian, Appl. Phys., 2015, 120(1), 341–347 Search PubMed.
- W. Li, B. Li, M. Meng, Y. Cui, Y. Wu, Y. Zhang, H. Dong and Y. Feng, Appl. Surf. Sci., 2019, 487, 1008–1017 CrossRef CAS.
- Y. Zhang, Z. C. Li, L. Li, R. Ben and Y. P. Wang, Microorganisms, 2021, 9(9), 1858–1868 CrossRef CAS PubMed.
- L. Sikong, M. Masae, K. Kooptarnond, W. Taweepreda and F. Saito, Appl. Surf. Sci., 2012, 258(10), 4436–4443 CrossRef CAS.
- Y. J. Jiang, D. Yang, L. Zhang and Q. Y. Sun, Adv. Funct. Mater., 2010, 19(1), 150–156 CrossRef.
- Z. Liu, C. Zhang, X. Zhang, C. Wang and H. Wang, Chem. Eng. J., 2021, 41, 128632 CrossRef.
- T. Chen, G. Liu, F. Jin, M. Wei and Y. C. Ma, Phys. Chem. Chem. Phys., 2018, 20, 12785–12790 RSC.
- X. P. Su, W. Chen, Y. N. Han, D. C. Wang and J. M. Yao, Appl. Surf. Sci., 2021, 536(15), 147945 CrossRef CAS PubMed.
- W. J. Xie, M. W. Zhang, D. Liu, W. W. Lei, L. Sun and X. G. Wang, ACS Sustainable Chem. Eng., 2017, 5, 1392–1399 CrossRef CAS.
- Y. Y. Wang, D. Xin and Z. Ping, Ind. Eng. Chem. Res., 2019, 58(31), 14161–14169 CrossRef CAS.
- A. Biswas and N. R. Jana, ACS Appl. Nano Mater., 2021, 4, 877–885 CrossRef CAS.
- M. Zahid, E. L. Papadopoulou, G. Suarato, V. D. Binas, G. Kiriakidis, I. Gounaki, O. Moira, D. Venieri, I. S. Bayer and A. Athanassiou, ACS Appl. Bio Mater., 2018, 1, 1154–1164 CrossRef CAS.
Footnote |
| † Electronic supplementary information (ESI) available. See https://doi.org/10.1039/d2ra00992g |
| This journal is © The Royal Society of Chemistry 2022 |


