 Open Access Article
Creative Commons Attribution 3.0 Unported Licence
Revealing the different performance of Li4SiO4 and Ca2SiO4 for CO2 adsorption by density functional theory†
Wenjing Yu a,
Qian Xu*a,
Shenggang Li
 *b,
Xiaolu Xionga,
Hongwei Cheng
 a,
Xingli Zou
 a and
Xionggang Lua
aShanghai University, China
bShanghai Advanced Research Institute, China
First published on 11th April 2022
Abstract
To reveal the difference between Li4SiO4 and Ca2SiO4 in CO2 adsorption performance, the CO2 adsorption on Li4SiO4 (010) and Ca2SiO4 (100) surfaces was investigated using density functional theory (DFT) calculations. The results indicate that the bent configuration of the adsorbed CO2 molecule parallel to the surface is the most thermodynamically favorable for both Li4SiO4 and Ca2SiO4 surfaces. The Li4SiO4 (010) surface has greater CO2 adsorption energy (Eads = −2.97 eV) than the Ca2SiO4 (100) surface (Eads = −0.31 eV). A stronger covalent bond between the C atom of adsorbed CO2 and an OS atom on the Li4SiO4 (010) surface is formed, accompanied by more charge transfer from the surface to CO2. Moreover, the Mulliken charge of OS atoms on the Li4SiO4 (010) surface is more negative, and its p-band center is closer to the Ef, indicating OS atoms on Li4SiO4 (010) are more active and prone to suffering electrophilic attack compared with the Ca2SiO4 (100) surface.
1. Introduction
CO2 capture, storage and utilization (CCSU) is considered as one of the most promising technologies for reducing anthropogenic CO2 emission, which can lead to global warming. Solid inorganic sorbents have been proven to efficiently remove CO2 at high temperatures, and are more economical and effective than low-temperature amine-based materials in CO2 capture from high temperature exhaust gas.1 Lithium orthosilicate (Li4SiO4) is one of the best CO2 capture sorbents due to its significant advantages, such as large adsorption capacity, low regeneration temperature, and good adsorption and desorption cycle stability.2–4 There have been a lot of experimental studies on Li4SiO4 as an adsorbent to capture CO2, including the synthesis method,5,6 kinetic behavior7–9 and modification of Li4SiO4.10–12 However, lithium is relatively expensive and not very abundant in the earth's crust. In particular, lithium batteries have been widely used as a source of power or energy for a lot of things from portable electronics to electric vehicles. As a result, the demand for lithium is increased which leads directly to an increase of its price. Accordingly, it is very difficult to apply lithium-based ceramics on a huge scale to capture CO2 economically and sustainably. Meanwhile there are abundant resources basic silicates all over the world, especially calcium silicates (Ca2SiO4) are often found in the industrial by-products named as slags generated during iron and steel production. Furthermore, Ca2SiO4, similar to Li4SiO4, is thermodynamically favorable for CO2 capture from room temperature to 572 °C at ambient pressure, and Gibbs free energy changes for the carbonation of Ca2SiO4 and Li4SiO4 were calculated by HSC Chemistry 6.0 and shown in Fig. 1. However, the slow diffusion and reaction of carbonation between CO2 and calcium silicates is a common issue even at high temperatures in the case of no participation of water.13 It was found that the amount of CO2 captured with Ca2SiO4 is little at the temperature range from room temperature to 572 °C in our previous study. Zhao et al.14,15 applied Ca2SiO4 as the inert material to enhance the sintering resistance and cyclic stability of CaO during multiple sorption/desorption of CO2. It could be deduced that Ca2SiO4 is much inerter for carbonation compared with Li4SiO4 at the high temperatures.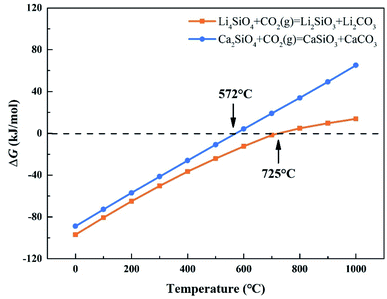 | ||
| Fig. 1 Relationship between ΔG and temperature of carbonation reaction between CO2 and Li4SiO4 and Ca2SiO4. | ||
The investigation on the effect of the electronic structure of the silicates on their carbonation reactivity should be very important for understanding deeply the different carbonation behaviors for Li4SiO4 and Ca2SiO4, and developing new approaches to improve the carbonation activity of silicates.
There are some investigations about CO2 adsorption on the surface of the oxides and silicates with the first-principles calculations. Kim et al.16 made an assessment of Li2O and Na2O surfaces for CO2 adsorption based on DFT calculations. They found that the introduction of dopant atoms larger than host metal atoms of the surfaces can negatively increase CO2 adsorption energies. Kumar et al.17 studied the CO2 adsorption on different terminations of Cr2O3 surfaces with DFT calculations and found that carboxylate species are formed on O layer terminated-(0001), and carbonate species are formed on O layer terminated-(10![[1 with combining macron]](https://www.rsc.org/images/entities/char_0031_0304.gif) 2) and Cr layer terminated-(01
2) and Cr layer terminated-(01![[1 with combining macron]](https://www.rsc.org/images/entities/char_0031_0304.gif) 2), indicating that the formation of physisorbed and chemisorbed species depends on different surface terminations. Kang et al.18 thermodynamically evaluated the CO2 capture potential of Mg2MO4 (M = Si, V, and Ge). Their results indicated that the critical temperature at which CO2 can be absorbed, increased with decreasing Pauling electronegativity of the M site.
2), indicating that the formation of physisorbed and chemisorbed species depends on different surface terminations. Kang et al.18 thermodynamically evaluated the CO2 capture potential of Mg2MO4 (M = Si, V, and Ge). Their results indicated that the critical temperature at which CO2 can be absorbed, increased with decreasing Pauling electronegativity of the M site.
There are several investigations for Li4SiO4 on its structural, electronic, lattice dynamical and thermodynamic properties. Duan19 and Tang et al.20 found the covalency properties of Li4SiO4 mainly resulting from the overlap of O 2p and Si 3p orbitals. Kong et al.21 studied the adsorption mechanism of H2O on the Li4SiO4 (010) surface. It was suggested an interaction between adsorbed H2O and Li4SiO4 (010) surface, including an electrophilic interaction of hydrogen atom in water with oxygen atoms on the surface and a nucleophilic interaction of oxygen atoms in water with Li atoms on the surface.
Ca2SiO4, as the industrial cement clinkers, has been investigated by DFT calculations extensively, and many studies focused on the hydration of Ca2SiO4 phases. Qi et al.22 investigated H2O adsorption on low-index surfaces of Ca2SiO4, indicating that electron are mainly transferred from surface atoms to H2O molecule. Wang et al.23 evaluated H2O adsorption on β-Ca2SiO4 surfaces and found a dual interaction between H2O and β-Ca2SiO4 (100) surface. Wang et al.24 also studied the relationship between reactivity and electronic structure of  -, β- and γ-Ca2SiO4 for hydration process. They found that the higher hydration reactivity of
  - and β-Ca2SiO4 compared with γ-Ca2SiO4 are attributed to the higher charge density and larger local state density of the active oxygen atoms in
  - and β-Ca2SiO4. However, there are few investigations about explanation of the different behaviors of carbonation of Ca2SiO4 and Li4SiO4 on the base of their structural and electronic properties.
Herein, we have systematically investigated the structural and electronic properties of Li4SiO4 and Ca2SiO4, and the adsorption of CO2 on the most stable surfaces of Li4SiO4 and Ca2SiO4 on the base of density functional theory calculations. We tried to reveal the relationship between the electronic structures of Li4SiO4 and Ca2SiO4 and their reactivity for CO2 adsorption on the molecular scale. The results of this investigation could converge to a proposed mechanism of CO2 capture with the orthosilicates, on which the more reactive silicates for CO2 capture can be screened out as the candidates for CO2 capture.
2. Computational details
The calculations were performed based on density functional theory (DFT), using Cambridge Series Total Energy Package (CASTEP) code.25 The exchange-correlation potential was approximated within the generalized gradient approximation (GGA)26 using the Perdew–Burke–Ernzerhof (PBE) functional.27 Dispersion-corrected calculations28 were performed with Grimme's DFT-D3 methodology.29 To model Li4SiO4 and Ca2SiO4, the unit cell (1 × 1 × 1) was applied for the calculation.In order to optimize the crystal structures, the plane wave truncation energy and k-points were tested. A cutoff-energy of 650 eV was used for plane wave expansions. The k-points meshes within Monkhorst-Pack30 framework were set as 3 × 6 × 2 and 4 × 3 × 2 for Li4SiO4 and Ca2SiO4 respectively. The Broyden–Fletcher–Goldfarb–Shenno (BFGS)31 minimization algorithm was used to optimize the primitive unit cell. The surfaces of Li4SiO4 and Ca2SiO4 were cleaved from the optimized bulk structure. All surfaces were kept stoichiometric and neutral to avoid the polarizing electric field. The thicknesses of vacuum layer were set as 15 Å to avoid the interaction between slabs. The convergence criteria were fixed, specifically: the energy change within 1 × 10⁻⁵ eV per atom, the force on the atoms within 0.03 eV Å−1, the stress on the atoms within 0.05 GPa, and the displacement of atoms within 1 × 10⁻³ Å. All the initial crystal structures and date were obtained from the Inorganic Crystal Structure Database (ICSD).32
3. Results and discussion
3.1. Structural and electronic properties of bulks
The bulk structure of Li4SiO4 with the monoclinic phase, which space group is P21/m (no. 11),33–35 was optimized. The unit cell of Li4SiO4 contains 126 atoms, including 14 [SiO4]4− tetrahedra and 56 Li atoms, as shown in Fig. 2a, which are centrally symmetrical. Meanwhile, the bulk structure of Ca2SiO4 with the monoclinic phase, which space group is P21/n (no. 14),36–38 was optimized as well. The unit cell of Ca2SiO4 consists of 28 atoms, including 4 [SiO4]4− tetrahedra and 8 Ca atoms, as shown in Fig. 2b. The calculated and experimentally measured lattice parameters of Li4SiO4 and Ca2SiO4 are presented in Table 1, and they are in good agreement, implying the simulation settings are reliable and give reasonable results.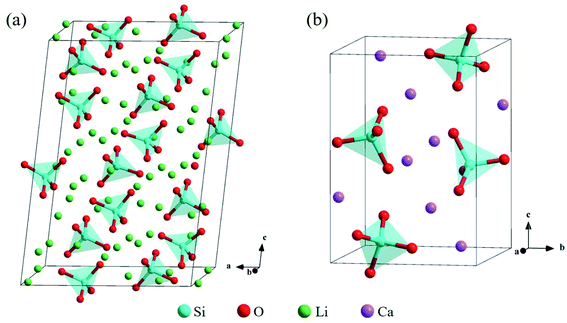 | ||
| Fig. 2 Crystal structures of (a) Li4SiO4 and (b) Ca2SiO4. The Si, O, Li and Ca atoms are shown by blue, red, green and purple spheres, respectively. | ||
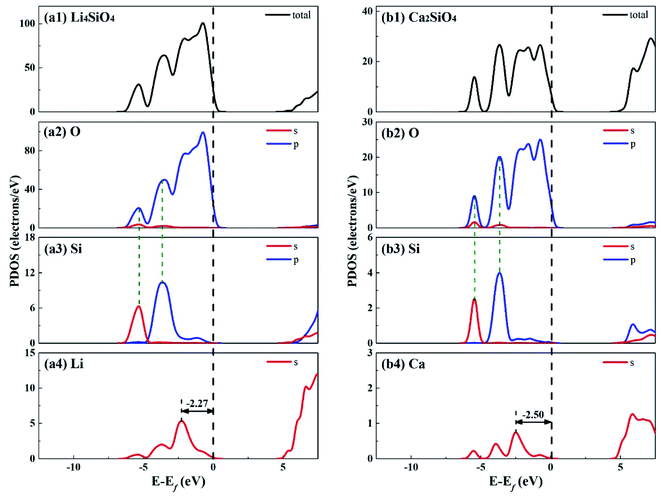
Fig. 3 shows the total density of states (TDOS) and partial density of states (PDOS) for Li4SiO4 and Ca2SiO4. Electrons occupying the orbitals below and near the Fermi level (Ef) is of great significance to the activity of the crystal materials for chemical reactions,39 so we focused on the electrons on the orbitals below and near the Ef. For Li4SiO4 and Ca2SiO4, their TDOS near the Ef is mainly contributed by the p orbitals of O atoms, suggesting that O atoms are more active and more likely serve as the electron donors. Their PDOS in the region between −6.55 ∼ −2.92 eV and −6.25 ∼ −3.02 eV are overlapped with the Si s and p bands, implying orbital hybridization and Si–O binding in the bulks of Li4SiO4 and Ca2SiO4. However, the states in the region between −3 and 0 eV, near to Ef is about 73% of the total PDOS for O p orbitals for Li4SiO4, while that for Ca2SiO4 is about 70%. It can be deduced that there are more electronic states for O p orbitals below and near to Ef in Li4SiO4 than those in Ca2SiO4, Then the electron transfer from O atoms occurs more easier in Li4SiO4 than in Ca2SiO4.
Furthermore, the first high peak position41 in the PDOS for Li s orbital of Li4SiO4, is closer to the Ef compared with that for Ca s orbital of Ca2SiO4, implying that the outer electron of Li atoms in Li4SiO4 can be transferred away easier than Ca atoms in Ca2SiO4.
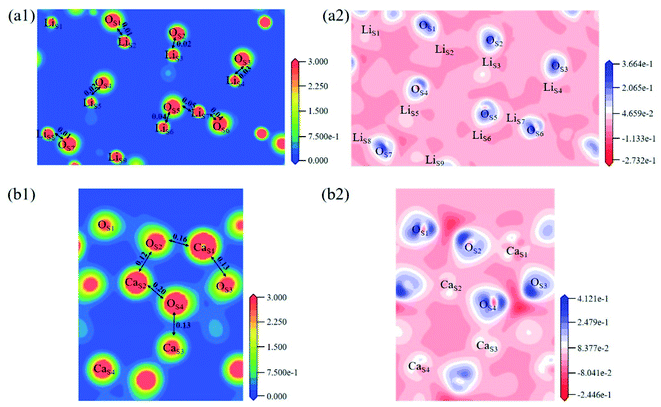
The electron density distribution can show the bonding between atoms and differential charge density can show the accumulation and depletion of electrons. In Fig. 4a, electron density between Si and O atoms is higher than surrounding and electrons accumulate in the middle of Si and O atoms, demonstrating that a covalent interaction of Si–O. And according to the charge population marked in the figure, the Si–O covalent interaction is stronger in Li4SiO4. Li/Ca–O have a certain covalent interaction and the strength of interaction of Li–O is weaker than Ca–O.
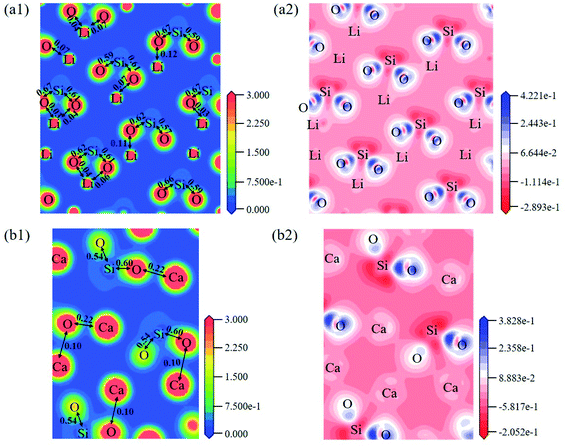 | ||
| Fig. 4 Contour maps of electron density distributions and differential charge density of (a) Li4SiO4 in the plane (010) and (b) Ca2SiO4 in the plane (100). | ||
3.2. Structural and electronic properties of surfaces
In order to find out the most stable surface, the surface energies of seven low Miller index surfaces were calculated. The surface energy (Esurf) can be calculated according to the eqn (1):42,43| Esurf = (Eslab − nEbulk)/2A | (1) |
| Surface | (100) | (010) | (001) | (110) | (101) | (011) | (111) |
|---|---|---|---|---|---|---|---|
| Li4SiO4 | 1.28 | 0.78 | 1.34 | 0.80 | 1.28 | 0.87 | 0.84 |
| Ca2SiO4 | 0.63 | 1.19 | 0.80 | 0.86 | 0.66 | 0.75 | 0.82 |
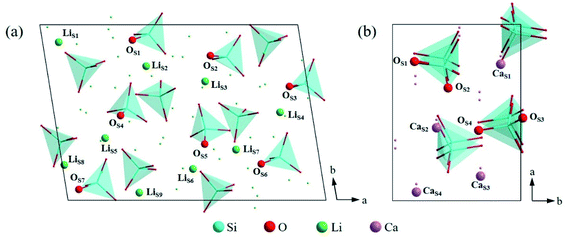 | ||
| Fig. 5 Atomic arrangement of (a) Li4SiO4 (010) surface and (b) Ca2SiO4 (100) surface from the top view. The lines and dots represent the underlying atoms and tetrahedra respectively. | ||
The electronic properties of the surfaces should differ from those of the bulks due to the dangling bonds or surface reconstruction. The electronic properties of Li4SiO4 (010) surface and Ca2SiO4 (100) surface were calculated as well. Fig. 6 shows the TDOS and PDOS of the topmost surface layers of Li4SiO4 (010) surface and Ca2SiO4 (100) surface. Although the surface TDOS resemble the bulk TDOS shown in Fig. 3 for both Li4SiO4 and Ca2SiO4, the states of OS p orbitals are shifted up in energy, and the states in the region between −3 and 0 eV are about 79% of the total PDOS for OS p orbitals for Li4SiO4 (010) surface, while that for Ca2SiO4 (100) surface is about 77%. Furthermore, p-band center of OS atoms increased to −1.725 eV from −1.936 eV of O atoms in bulk Li4SiO4, and −1.939 eV from −2.103 eV in bulk Ca2SiO4. It can be deduced that the reactivity of the surface OS atoms is enhanced compared with the O atoms in the bulks. Considering the states near to Ef and the p-band center levels, the OS atoms in Li4SiO4 (010) surface are more prone to suffer the electrophilic attacks with respect to Ca2SiO4 (100) surface.
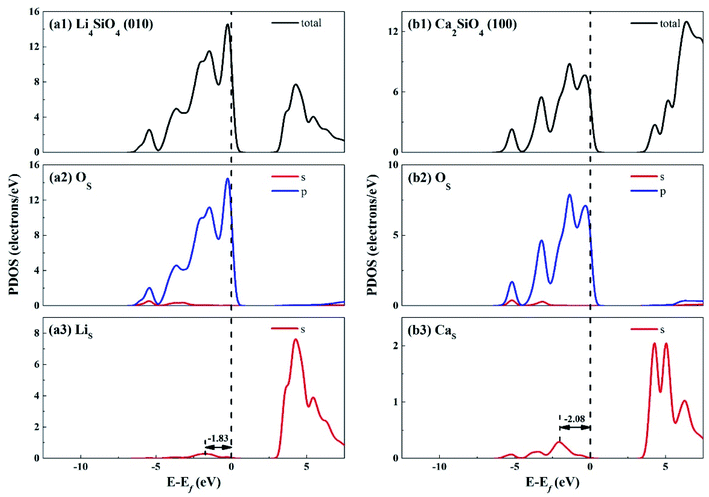 | ||
| Fig. 6 DOS analysis of the topmost surface layers of (a) Li4SiO4 (010) surface and (b) Ca2SiO4 (100) surface without CO2 adsorption. The black dashed line shows the Fermi level. | ||
The electron density and differential charge density of the topmost surface layer atoms are shown in Fig. 7. The covalent interaction between LiS and OS atoms is weaker than that in bulk, which can be seen from the charge population. While the covalent interaction between CaS and OS atoms is stronger than that in bulk.
Fig. 8 shows the Mulliken charge of atoms on the topmost surface layer. There is a considerable difference of the charge between bulk atoms (listed in ESI†) and atoms on the topmost surface layer. The positive charge of surface LiS and CaS atoms increases, and the negative charge of the OS atoms increases compared with bulk atoms. And the deviation of Mulliken charge of surface LiS atoms from the bulk atoms is relatively large, whereas the Mulliken charge of surface CaS and OS atoms differ from their bulk atoms slightly. Furthermore, the OS of Li4SiO4 (010) surface carry more negative charge than Ca2SiO4 (100) surface. According Lewis acid/base theory, OS atoms of Li4SiO4 (010) surface are more basic and easier to lose electrons.
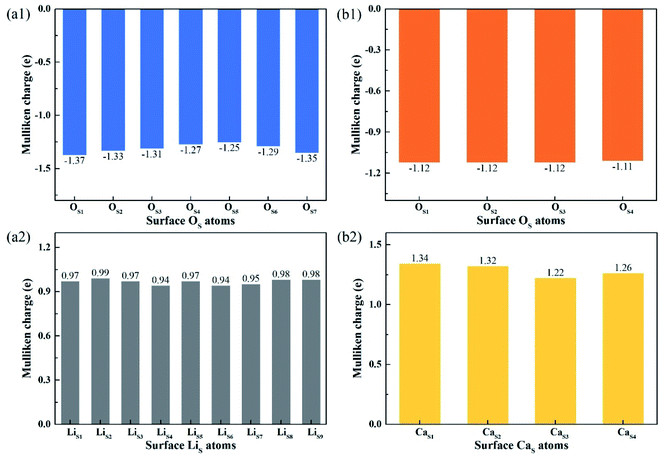 | ||
| Fig. 8 Mulliken charge analysis of atoms on the topmost surface layers of (a) Li4SiO4 (010) surface and (b) Ca2SiO4 (100) surface. | ||
3.3. CO2 adsorption on the surfaces
The adsorption energy (Eads) of a CO2 molecule on Li4SiO4 (010) surface and Ca2SiO4 (100) surface is calculated according to the eqn (2):| Eads = Eslab+CO2 − (Eslab + ECO2) | (2) |
An isolated CO2 molecule has linear configuration with the length of C–O bond of 1.18 Å. Three adsorption configurations are presented in this study when a CO2 molecule is adsorbed on the Li4SiO4 (010) surface as shown in Fig. 9. In the first configuration, the adsorbed CO2 molecule almost remains linear configuration along the normal to the Li4SiO4 (010) surface. The distance between O atom in CO2 and the nearest LiS atom is 2.17 Å, and adsorption energy is −0.37 eV. In the second configuration shown in Fig. 9b, the adsorbed CO2 molecule has a linear configuration parallel to the Li4SiO4 (010) surface, and the adsorption energy is −0.46 eV. In the third configuration shown in Fig. 9c, the adsorbed CO2 molecule is lying flat on the surface with the bent configuration. The C atom in CO2 forms a bond with a surface OS atom with the OS–C distance of 1.39 Å, and its two oxygen atoms (OC) are coordinated to the two surface LiS atoms, with the OC1–LiS1 and OC2–LiS2 distances are 2.04 and 2.01 Å, respectively. The adsorbed CO2 molecule is bent with an OC1–C–OC2 angle of 129.20° and the C–OC length of 1.27 Å. The adsorption energy is −2.97 eV. The third bent configuration of the adsorbed CO2 on the Li4SiO4 (010) surface is energetically favorable over the other two configurations.
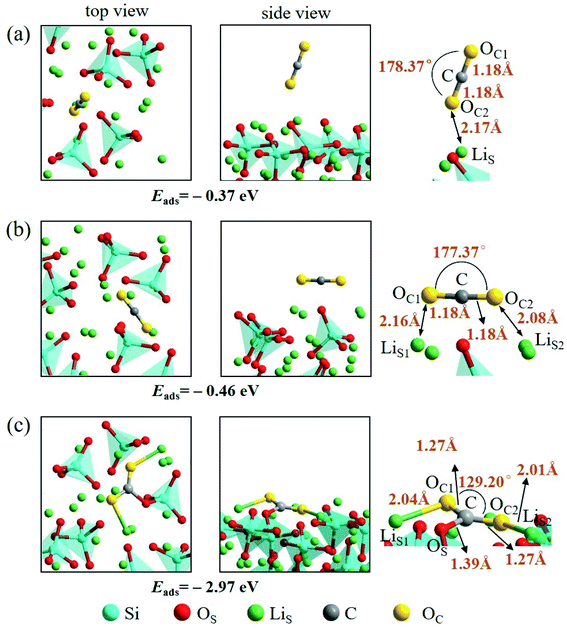 | ||
| Fig. 9 Three configurations of an adsorbed CO2 molecule on the Li4SiO4 (010) surface: (a) along the normal to the surface, (b) parallel to the surface, (c) bent configuration. | ||
There are also three adsorption configurations considered for an adsorbed CO2 molecule on the Ca2SiO4 (100) surface, as shown in Fig. 10. The first configuration, where an almost linearly CO2 is adsorbed, is in vertical orientation and tilted slightly to the Ca2SiO4 (100) surface, and the adsorption energy is −0.14 eV. The absorbed CO2 molecule is bent a little bit in the second configuration, which is in parallel orientation, and the adsorption energy is −0.28 eV. When the absorbed CO2 molecule lying on the Ca2SiO4 (100) surface in a bent configuration shown in Fig. 10c, the distance of C–OS is 1.49 Å, and OC1–C–OC2 angle is 136.26°. The bent configuration has the lowest value of adsorption energy, −0.31 eV in the third configurations.
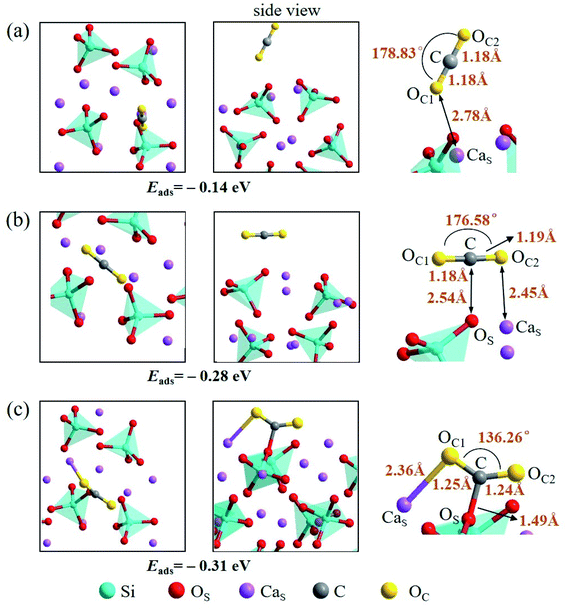 | ||
| Fig. 10 Three configurations of an adsorbed CO2 molecule on the Ca2SiO4 (100) surface: (a) along the normal to the surface, (b) parallel to the surface, (c) bent configuration. | ||
It is found that the bent configuration consisting of a CO2 molecule absorbed parallel along to the surface is the most thermodynamically stable among the three configurations considered here for both Li4SiO4 and Ca2SiO4 surfaces. Furthermore, the Li4SiO4 (010) surface has greater adsorption to CO2 than the Ca2SiO4 (100) surface due to the stronger bond between C atom in CO2 and the surface OS atom for Li4SiO4.
3.4. Partial density of state analysis
Considering that the adsorption energy of adsorbed CO2 in bent configuration is the lowest, the PDOS calculations were only performed for this configuration, as shown in Fig. 11 and 12. It can be seen that the s and p orbitals of C and OC of adsorbed CO2 molecule both move towards lower energy level and broaden compared with the isolated CO2 molecule, indicating that CO2 molecule becomes more stable after adsorption. C s and p orbitals of adsorbed CO2 are hybridized with OS p orbitals, having bonding character between C and OS atoms. The states in the region between −3 and 0 eV are about 72% for OS p orbital for Li4SiO4 (010) surface after adsorption, which is decreased from 79% before adsorption, demonstrating that PDOS of OS p orbitals is moved to lower energy level after CO2 adsorption. Furthermore, the PDOS peak of LiS s orbital become weaker and broader after adsorption.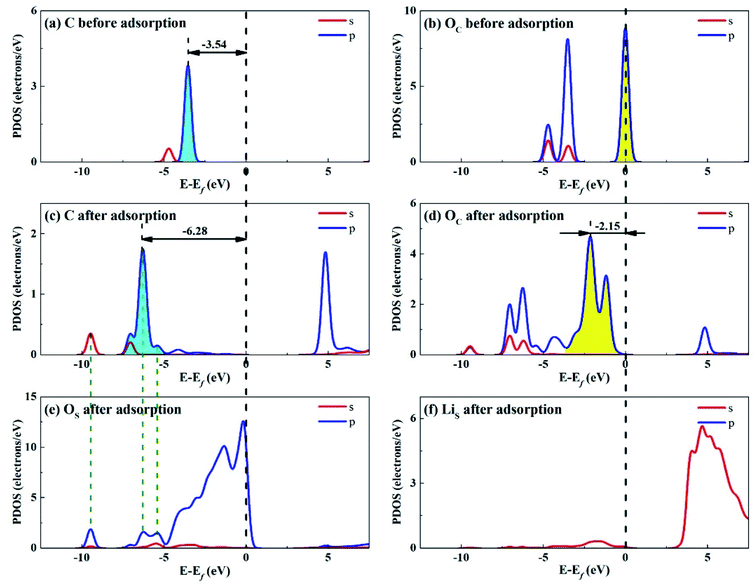 | ||
| Fig. 11 PDOS analysis of (a) C and (b) OC atoms of CO2 before adsorption, (c) C and (d) OC atoms of CO2 and (e) OS and (f) LiS atoms of Li4SiO4 (010) surface after adsorption. | ||
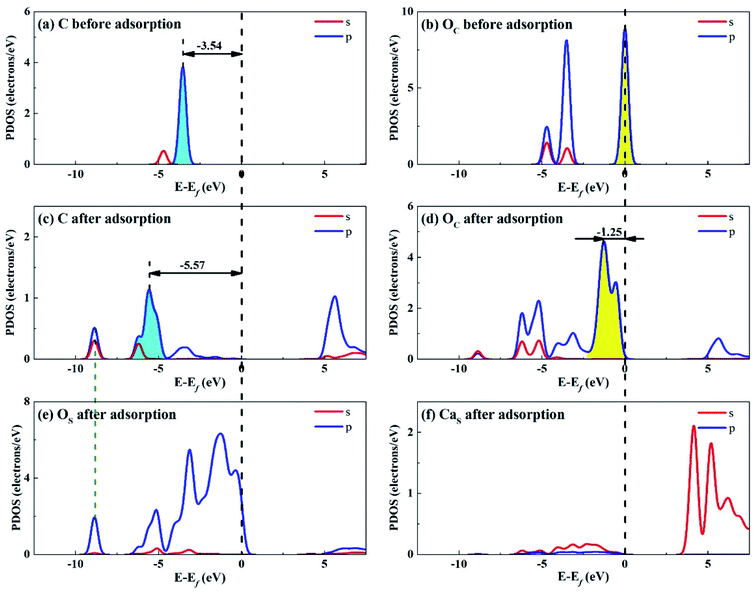 | ||
| Fig. 12 PDOS analysis of (a) C and (b) OC atoms of CO2 before adsorption, (c) C and (d) OC atoms of CO2 and (e) OS and (f) CaS atoms of Ca2SiO4 (100) surface after adsorption. | ||
Fig. 12 shows the PDOS for CO2 and Ca2SiO4 (100) surface after adsorption. Similarly, the s and p orbitals of C and OC of adsorbed CO2 move towards lower energy and broaden, but not as far as Li4SiO4 (010) surface. It can be deduced that CO2 adsorption on Li4SiO4 (010) surface is more stable. The states in the region between −3 and 0 eV are about 73% for OS p orbitals for Ca2SiO4 (100) surface. The PDOS peaks for CaS s orbital become weaker and broader after adsorption, similar to LiS s orbital.
To better elucidate the different CO2 absorption behaviors of Li4SiO4 (010) and Ca2SiO4 (100) surfaces, the p-band centers of C and OC in CO2 and OS on the surfaces with and without CO2 absorption were calculated, and the results were shown in Fig. 13. Comparing the p-band centers of OS atoms on two clean surfaces, it can be found that the p-band center of OS atoms on the Li4SiO4 (010) surface is closer to the Ef than that of Ca2SiO4 (100) surface, which means the OS atoms of Li4SiO4 (010) surface are more active and easier to transfer electrons to CO2 absorbed. When CO2 is adsorbed on the Li4SiO4 (010) surface, it is obvious that p-band centers of C, OC and OS atoms are farther away from the Ef, indicating that CO2 absorbed and OS become stable. On the other hand, energy-down shift of the p-band centers of C, OC and OS atoms of Ca2SiO4 (100) surface due to CO2 adsorption is much smaller compared with Li4SiO4 (010) surface, probably leading to its higher absorption energy and less CO2 absorption.
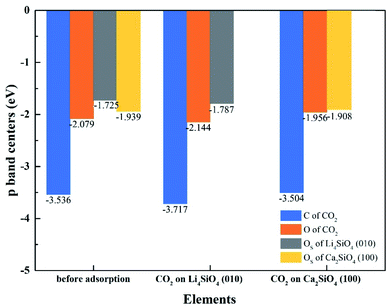 | ||
| Fig. 13 The p-band centers of C 2p and O 2p orbitals of CO2, Li4SiO4 (010) surface and Ca2SiO4 (100) surface before and after adsorption. | ||
3.5. Mulliken charge analysis
To understand the interactions and charge distributions associated with CO2 adsorbed with the most energetically favorable configurations on Li4SiO4 (010) and Ca2SiO4 (100) surfaces, a Mulliken charge anlysis was performed. The detail date of Mulliken charges for CO2 and Li4SiO4 (010) and Ca2SiO4 (100) surfaces before and after adsorption were shown in Fig. 14. For CO2 adsorbed on Li4SiO4 (010) surface, it is found that the Mulliken charge on a surface OS atom changes from −1.33e to −0.86e, while the charges on the surface LiS1 and LiS2 atoms increase from 0.93e to 0.96e, and from 0.93e to 0.95e, respectively. It can be deduced that CO2 adsorption induces the net electron loss of Li4SiO4 (010) surface. On the other side, the Mulliken charge of C atom in CO2 adsorbed decreases from 0.98e to 0.76e, and the charges of OC1 and OC2 from −0.49e to −0.78e and −0.76e, respectively, which means that CO2 adsorbed gains the charges from Li4SiO4 (010) surface.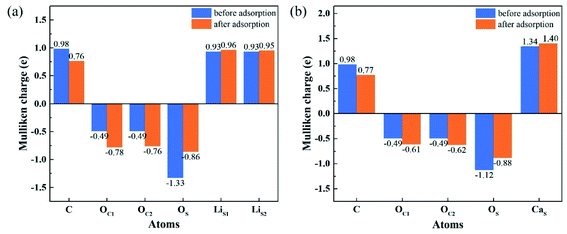 | ||
| Fig. 14 Mulliken charge analysis of adsorbed CO2 molecule and (a) Li4SiO4 (010) surface, and (b) Ca2SiO4 (100) surface before and after adsorption. | ||
In the case of CO2 adsorption on Ca2SiO4 (100) surface, it is found that charge gain for C atom in CO2 adsorbed is similar to that on Li4SiO4 (010) surface, but charges gained by OC1 and OC2 atoms are fewer. Furthermore, the Mulliken charge on an OS atom on Ca2SiO4 (100) surface changes from −1.12e to −0.88e, and the charge on the surface CaS from 1.34e to 1.40e. The net charge transfer from Ca2SiO4 (100) surface to CO2 adsorbed is much less compared to that Li4SiO4 (010) surface.
The charge population between C in CO2 adsorbed and a surface OS atom was calculated to be 0.62 and 0.45 for Li4SiO4 (010) and Ca2SiO4 (100) surfaces, respectively. It can be deduced that the C–OS covalent interaction on Li4SiO4 (010) surface is even stronger, which leads to the stronger adsorption of CO2.
4. Conclusions
A density functional theory calculation was conducted to research the CO2 adsorption on the Li4SiO4 (010) and Ca2SiO4 (100) surfaces. The bent configuration consisting of a CO2 molecule adsorbed parallel along to the surface is the most thermodynamically favorable for Li4SiO4 and Ca2SiO4 surfaces. And the adsorption energy of Li4SiO4 (010) surface is −2.97 eV, more negative than Ca2SiO4 (100) surface, −0.31 eV. Li4SiO4 (010) surface is more favorable for forming a stronger covalent bond between a surface OS atom to the C atom of CO2 adsorbed and transferring more charges to adsorbed CO2. In addition, it was found that the Mulliken charge of OS atoms on the Li4SiO4 (010) is more negative, and its p-band center is closer to the Ef, which implies OS atoms of Li4SiO4 (010) are more active and more likely serve as the electron donors with respect to Ca2SiO4 (100) surface.Conflicts of interest
There are no conflicts to declare.Acknowledgements
This work was financially supported by the Natural Science Foundation of China (No. 51574163).References
- R. Ben-Mansour, M. A. Habib, O. E. Bamidele, M. Basha, N. A. A. Qasem, A. Peedikakkal, T. Laoui and M. Ali, Appl. Energy, 2016, 161, 225 CrossRef CAS.
- M. Seggiani, M. Puccini and S. Vitolo, Int. J. Greenhouse Gas Control, 2013, 17, 25 CrossRef CAS.
- M. Kato, S. Yoshikawa and K. Nakagawa, J. Mater. Sci. Lett., 2002, 21, 485 CrossRef CAS.
- M. Kato, K. Nakagawa, K. Essaki, Y. Maezawa, S. Takeda, R. Kogo and Y. Hagiwara, Int. J. Appl. Ceram. Technol., 2005, 2, 467 CrossRef CAS.
- K. Wang, Z. Yin and P. Zhao, Ceram. Int., 2016, 42, 2990 CrossRef CAS.
- M. E. Bretado, V. G. Velderrain, D. L. Gutiérrez, V. Collins-Martínez and A. L. Ortiz, Catal. Today, 2005, 107–108, 863 CrossRef CAS.
- K. Essaki and M. Kato, J. Mater. Sci., 2005, 4, 1 Search PubMed.
- R. Rodríguez-Mosqueda and H. Pfeiffer, J. Phys. Chem., 2010, 114, 4535 CrossRef PubMed.
- M. J. Venegas, E. Fregoso-Israel, R. Escamilla and H. Pfeiffer, Ind. Eng. Chem. Res., 2007, 46, 2407 CrossRef CAS.
- S. Jeoung, J. H. Lee, H. Y. Kim and H. R. Moon, Thermochim. Acta, 2016, 637, 31 CrossRef CAS.
- I. C. Romero-Ibarra, J. Ortiz-Landeros and H. Pfeiffer, Thermochim. Acta, 2013, 567, 118 CrossRef CAS.
- V. L. Mejía-Trejo, E. Fregoso-Israel and H. Pfeiffer, Chem. Mater., 2008, 20, 7171 CrossRef.
- G. V. Tomarov, Y. V. Petrov, A. A. Shipkov, O. A. Dovgii, V. N. Semenov and A. V. Mikhailov, Therm. Eng., 2008, 55, 154 CrossRef.
- M. Zhao, J. Shi, X. Zhong, S. Tian, J. Blamey, J. Jiang and P. S. Fennell, Energy Environ. Sci., 2014, 7, 3291 RSC.
- M. Zhao, Y. Song, G. Ji and X. Zhao, Energy Fuels, 2018, 32, 5443 CrossRef CAS.
- Y. S. Kim and S. G. Kang, Appl. Surf. Sci., 2019, 486, 571 CrossRef CAS.
- A. Kumar, F. Ropital, T. de Bruin and B. Diawara, Appl. Surf. Sci., 2020, 529, 147127 CrossRef CAS.
- S. G. Kang, J. CO2 Util., 2020, 42, 101293 CrossRef CAS.
- Y. Duan and K. Parlinski, Phys. Rev. B: Condens. Matter Mater. Phys., 2011, 84, 104113 CrossRef.
- T. Tang, P. Chen, W. Luo, D. Luo and Y. Wang, J. Nucl. Mater., 2012, 420, 31 CrossRef CAS.
- X. Kong, Y. Yu, S. Ma, T. Gao, C. Xiao and X. Chen, Chem. Phys. Lett., 2018, 691, 1 CrossRef CAS.
- C. Qi, D. Spagnoli and A. Fourie, Appl. Surf. Sci., 2020, 518, 146255 CrossRef CAS.
- Q. Wang, H. Manzano, I. López-Arbeloa and X. Shen, Minerals, 2018, 8, 1 Search PubMed.
- Q. Wang, F. Li, X. Shen, W. Shi, X. Li, Y. Guo, S. Xiong and Q. Zhu, Cem. Concr. Res., 2014, 57, 28 CrossRef CAS.
- M. C. Payne, M. P. Teter, D. C. Allan, T. A. Arias and J. D. Joannopoulos, Rev. Mod. Phys., 1992, 64, 1045 CrossRef CAS.
- J. P. Perdew, K. Burke and M. Ernzerhof, Phys. Rev. Lett., 1996, 77, 3865 CrossRef CAS PubMed.
- B. Hammer, Phys. Rev. B: Condens. Matter Mater. Phys., 1999, 59, 7413 CrossRef.
- J. P. P. Ramalho, J. R. B. Gomes and F. Illas, RSC Adv., 2013, 3, 13085 RSC.
- S. Grimme, J. Antony, S. Ehrlich and H. Krieg, J. Chem. Phys., 2010, 132, 154104 CrossRef PubMed.
- D. J. Chadi, Phys. Rev. B, 1977, 16, 1746 CrossRef.
- B. G. Pfrommer, M. Côté, S. G. Louie and M. L. Cohen, J. Comput. Phys., 1997, 131, 233 CrossRef CAS.
- A. Belsky, M. Hellenbrandt, V. L. Karena and P. Lukschb, Acta Crystallogr., 2002, 58, 364 Search PubMed.
- R. Zhang, S. Ma, Q. Wang, C. Xiao, C. Zhang and T. Gao, Ceram. Int., 2020, 46, 8192 CrossRef CAS.
- Q. Guan, T. Gao, Y. Shen, S. Ma, T. Lu, X. Chen, C. Xiao and X. Long, Int. J. Mod. Phys. B, 2015, 29, 1550128 CrossRef CAS.
- D. Tranqui, R. D. Shannont and H. Y. Chen, Acta Crystallogr. B, 1979, 35, 2479 CrossRef CAS.
- C. Haitao, H. Xuefei and H. Weigang, Rare Met. Mater. Eng., 2018, 47, 729 CrossRef.
- C.-J. Chan, W. M. Kriven and J. F. Young, J. Am. Ceram. Soc., 1988, 71, 713 CrossRef CAS.
- Y. J. Kim, I. Nettleship and W. M. Kriven, J. Am. Ceram. Soc., 1992, 75, 2407 CrossRef CAS.
- A. V. Marenich, S. V. Jerome, C. J. Cramer and D. G. Truhlar, J. Chem. Theory Comput., 2012, 8, 527 CrossRef CAS PubMed.
- K. H. Jost, B. Ziemer and R. Seydel, Acta Crystallogr., 1977, 33, 1696 CrossRef.
- W. Tao, C. Zhu, Q. Xu, S. Li, X. Xiong, H. Cheng, X. Zou and X. Lu, ACS Omega, 2020, 5, 20090 CrossRef CAS PubMed.
- E. Durgun, H. Manzano, P. V. Kumar and J. C. Grossman, J. Phys. Chem. C, 2014, 118, 15214 CrossRef CAS.
- W.-B. Zhang, C. Chen and S.-Y. Zhang, J. Phys. Chem. C, 2013, 117, 21274 CrossRef CAS.
Footnote |
| † Electronic supplementary information (ESI) available. See https://doi.org/10.1039/d2ra01021f |
| This journal is © The Royal Society of Chemistry 2022 |

