 Open Access Article
Electrodeless hydrogen production from seawater using femtosecond laser pulses†
Akira Kuwahara‡
 *a,
Yuki Mizushima‡*b,
Makoto Matsuibc,
Tomoki Kozukad and
Nobuyuki Mase
 cd
cd
aDepartment of Applied Energy, Nagoya University, Aichi 464-8603, Japan. E-mail: akuwahara@energy.nagoya-u.ac.jp
bDepartment of Mechanical Engineering, Shizuoka University, Shizuoka 432-8561, Japan. E-mail: mizushima.yuhki@shizuoka.ac.jp
cGreen Energy Research Division, Research Institute of Green Science and Technology, Shizuoka University, Shizuoka 432-8561, Japan
dDepartment of Engineering, Shizuoka University, Shizuoka 432-8561, Japan
First published on 24th March 2022
Abstract
This study presents the first experimental evidence of direct H2 production from seawater without harmful gas emissions (e.g., CO2, Cl2), which uses multiphoton ionization water splitting with a femtosecond pulse laser. According to H2 analysis using a gas chromatograph, the H2 production rate in seawater was 70 μmol h−1, which was approximately 3.3 times more than the ultrapure water case reported in the literature. This positive effect derives from focusing through the cuvette wall and the more significant Kerr effect in seawater. Such ion enhancement was observed in the case of seawater and diluted seawater compared with the ultrapure water case, but excessive salt can lead to ion suppression and adverse effects. These differences in salinity suggest appearances of nonlinear optical effects near the focal point and ionization of metallic elements with low ionization potential and are discussed in relation to results of bubble visualization, gas composition analysis, and pressure measurement in gaseous products.
Introduction
Recently, hydrogen energy has garnered great attention from researchers for its energy security and decarbonization. The demand for hydrogen (H2) production is expected to increase with the growth of electricity generation and electric mobility using hydrogen fuel.1 More than 95% of hydrogen currently in use is produced through a process called the steam methane reforming (SMR) process.2–4 In the SMR process, CO2 is generated, and it needs to be efficiently separated from natural gas.5 In this regard, green H2 production from water, for example, electrolysis water splitting, photoelectrochemical water splitting, and water radiolysis have been developed.6–12While the cost of H2 production by water splitting will decline with renewable energy becoming more prevalent, the economic desalination technique of seawater is still under development due to the high costs of the cation exchange membrane and catalyst layer. Electrochemically active anions interfere and compete with the catalysis in seawater.13 In addition, toxic Cl2 gas forms at anode, which requires regular gaseous waste management system. The corrosion of tank and pipes by Cl2 also increases maintenance costs. Thus, a direct and selective water splitting of seawater into H2 and O2, in which chlorine ions are not involved in the process, is a potentially attractive breakthrough.14
Herein we present a game-changing solution for direct H2 production from seawater using multiphoton ionization water splitting (MPI-WS) with a femtosecond pulse laser. The ionization reaction triggered by multiphoton absorption of H2O molecules (the ionization potential of 6.5 eV) produces H2 and O2 gas.15,16 This approach not only provides optical breakdown and rapid process without desalination but also does not emit CO2 and Cl2 gases selectively. The demonstration of the developed MPI-WS system was conducted using artificial seawater as water sample. We analyzed the amount of H2 production by a gas chromatograph (GC) with a dielectric-barrier discharge ionization detector (BID). The analyses highlight that the femtosecond laser radiation produces more H2 gas than the ultrapure water case.16 The difference in the cell shape between a rectangular and cylindrical cell and curvature particularly affected gas production. Next, bubble generation from ultrapure water, seawater, and concentrated seawater were visualized by a high-speed camera to make comparison among the processes. Such results support the gas analysis results based on the sizes of the regions and bubble growth due to the nonlinear optical effect. Additionally, the differences in salinity are discussed with gas composition analysis and pressure measurement in gaseous products. The compact yet simple equipment configuration requiring only a water tank allows easy on-site installation that overcomes transportation difficulties.17,18
Experimental
Hydrogen production
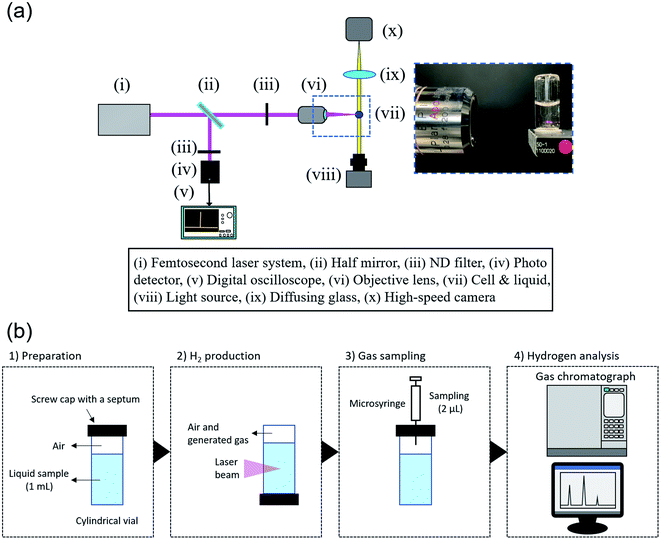
The experimental apparatus of H2 production is depicted in Fig. 1(a). Two types of reaction cells, rectangular and cylindrical, were used. For the reproductive experiment, a standard rectangular vial (F15-UV-10, GL Science) with a volume of 5 mL. In contrast, a cylindrical vial (11231047S, Shimadzu) with a volume of 2 mL was selected. A liquid sample of ultrapure water or artificial seawater was poured into the vial, which was then sealed with a screw cap and PTFE silicone septum. The volumes in a rectangular and cylindrical cell are 1 mL and 4 mL, respectively, and the sample volumes were set so that the initial gas volume is the same (1 mL). The vial was placed in upside-down position so that the generated gas would not accumulate on the seal side, and the liquid sample was irradiated with femtosecond pulse laser beams. A femtosecond pulsed laser (Maitai, Spectra Physics) with a regenerative amplifier (Spitfire, Spectra Physics) was used. The collimated laser beam, of which the full-width half-maximum is approximately 3.8 mm, was focused into the liquid sample using an objective lens (EPI L Plan Apo 10×, NA = 0.28, f = 20.0, Mitsutoyo). Artificial seawater (MARINE ART SF-1, Tomita Pharmaceutical) was used as seawater sample. Its nutritional information is listed in Table S1.† A 2.5 times concentrated sample was prepared using 10 L of ultrapure water. The salt concentrations in samples were measured with a salinity meter (TS-391, AS ONE).Hydrogen analysis
The analysis procedure is displayed in Fig. 1(b). After laser irradiation, 2 μL of gas sample was collected with a microsyringe (1701N, Hamilton). The gas sample was analyzed by a gas chromatograph (GC-2010 plus, Shimadzu) with a BID, where an analytical column (MICROPACKED ST, Shinwa Chemical Industries) was used. The amount of hydrogen gas generated was calculated using the calibration line obtained from H2 gas of known concentrations from the peak area, considering the volume in the cell. A typical chromatogram observed in the gas chromatograph and calibration line is shown in Fig. S1.†Time-resolved visualization of generated bubbles
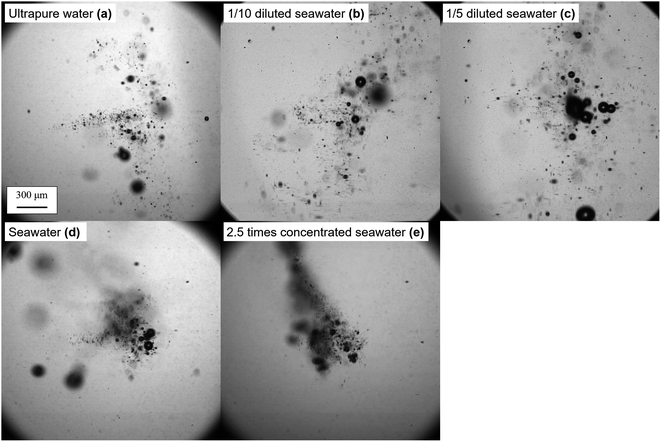
The experimental apparatus for visualization of generated bubbles is depicted in Fig. 1(b). A continuous white light source (KTS-100RSV, Kenko) and high-speed camera (FASTCAM SA-X2, Photron) were used for shadowgraph method. The lifetime of generated bubbles ranges from microseconds to a few seconds, which is much longer than laser ablation per pulsed laser beam. Therefore, in these experiments, the frame rate was set to 1000 fps, and the exposure time was 1/25![[thin space (1/6-em)]](https://www.rsc.org/images/entities/char_2009.gif) 000 s. For Fig. 4(a), (d) and (e), the spatial resolution is 4.2 μm pixel−1 and the vertical and horizontal sizes were 5.12 mm. For Fig. 4(b) and (c), the spatial resolution is 2.2 μm pixel−1 and vertical and horizontal ones were 1.67 mm.
000 s. For Fig. 4(a), (d) and (e), the spatial resolution is 4.2 μm pixel−1 and the vertical and horizontal sizes were 5.12 mm. For Fig. 4(b) and (c), the spatial resolution is 2.2 μm pixel−1 and vertical and horizontal ones were 1.67 mm.
Results and discussion
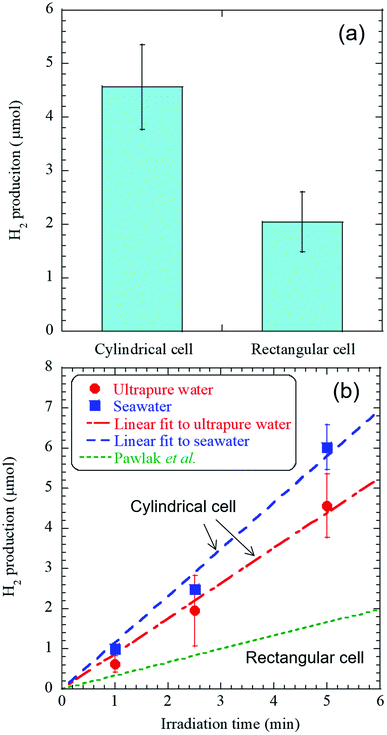
The experimental conditions of the femtosecond pulsed laser are listed in Table 1. The radiation times of 1, 2.5, and 5 minutes were set in a shorter range than in the previous study because of the high detection sensitivity of GC-BID.16 H2 of 0.6–6 μL was detected after 1–5 minutes of laser irradiation. Other generated species in the cylindrical cell detected using a mass spectrometer are presented in Table S2 and Fig. S2.† Here only the irradiation time was changed to about 3 hours from the above H2 production experiments to minimize the residual liquid in the cell after laser irradiation. Notably, HCl gas was observed, not Cl2 gas, and its volume fraction was approximately 7 × 10⁻⁴%. These analyses demonstrated that the developed method could substantially suppress the chlorine evolution reaction (CER) by roughly four orders of magnitude compared to the latest research on electrolysis, in which the yield of Cl2 gas by CER was reported to be 13%.19Fig. 2(a) shows the comparison of H2 production from ultrapure water between a rectangular and cylindrical cell at the radiation times of 5 minutes and Fig. 2(b) shows the linear dependence between the amount of hydrogen gas, and the time of femtosecond laser irradiation. First, the comparison of the experimental configurations between this study and the previous study is listed in Table S3.† Here there is a slight difference in the NA value of an objective lens, but H2 production used a rectangular cell is in good agreement with that in the previous work within the error bar, and the difference in the NA value does not affect H2 production (Fig. 2(a)).16 Then, the H2 productions from both ultrapure water and seawater linearly increase with the radiation time (Fig. 2(b)). The high significance of our work is demonstrated through two important findings: (i) H2 production using ultrapure water in this study was approximately 2.5 times higher than that in the previous work where a rectangular cell was used.16 The use of cylindrical cell caused the enhancement of the H2 production due to the effect of curvature;20 and (ii) laser irradiation to seawater produced approximately 1.3 times more H2 gas than ultrapure water, where the production rate in seawater was 70 μmol h−1. This finding indicates that a decrease in H2 production by the salt component did not occur in seawater.
Fig. 3 shows the salinity dependence on the amount of hydrogen gas at the radiation times of 5 minutes, and here in addition to ultrapure water and seawater, we prepared 1/10 and 1/5 diluted seawater, and 2.5 times concentrated seawater. While H2 production from seawater was more than those from diluted seawater samples, H2 production decreased considerably in the presence of excess salt. The findings prove that salinity has a positive effect on H2 production to some extent.
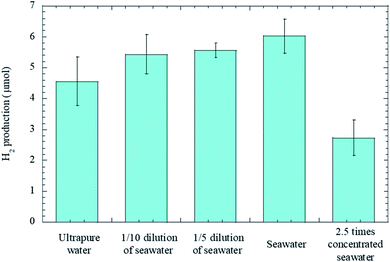 | ||
| Fig. 3 Bar chart displaying the salinity dependence on the amount of hydrogen gas. Error bars represent three standard deviations. | ||
The effect of the salinity on bubble generation was then visualized through a high-speed camera. The typical digital images of generated bubbles in ultrapure water, 1/10 diluted seawater, 1/5 diluted seawater, seawater, 2.5 times concentrated seawater are shown in Fig. 4 (see videos for bubble generation in ESI†). The bubbles generated in ultrapure water dispersed. Conversely, the bubbles generated in the seawater were densely populated, indicating the enhanced bubble growth. The single bubble collapsed and dissolved into liquid in the sparse regime; however, when the bubbles were close to each other, they coalesced into a larger bubble. The bubble nuclei distribution at the foci of the femtosecond pulse is lengthened/shortened along its optic axis21 by the Kerr effect,22 which depends on the liquid's nonlinear refractive index (n2).23 Through observation, the salinity seems to have an advantage over the bubble growth.
The time evolutions of the inner pressure in cells, which filled with ultrapure water, seawater, 2.5 times concentrated seawater are shown in Fig. 5, in which Δp on the vertical axis presents the increase from the initial pressure of the atmospheric pressure. The details of the pressure measurements are described in ESI.† While the inner pressure for all samples increased almost linearly until 30 minutes, the absolute pressure values showed the exact magnitude correlation as H2 production shown in Fig. 3, not the growth of bubbles shown in Fig. 4. These results suggest plasma products in bubbles generated in 2.5 times concentrated seawater include chemical species that are not gaseous in a stable state and are re-dissolved in water within the lifetimes of microseconds to a few seconds. Indeed, bubble growth does not necessarily indicate an increase in gaseous products in a stable state. Therefore, although seawater has a positive effect on bubble growth, excessive salt (∼7%) does not necessarily enhance H2 production due to surface ion suppression, that is, the interference of Na, Mg, Ca, and other metals with low ionization potential.24
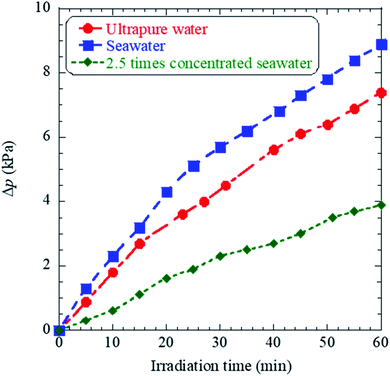 | ||
| Fig. 5 Graph showing time evolutions of the inner pressure during femtosecond laser irradiation of ultrapure water, seawater, and 2.5 times concentrated seawater. | ||
Here we discuss hydrogen evolution reaction (HER) triggered by multiphoton absorption. The photolysis reactions by femtosecond laser pulses have been studied by Reuther et al.15 and Meader et al.,25 and include
| H2O + nhν → H2O* → H* + OH* | (1) |
| H2O + nhν → H+ + e− + OH | (2) |
| e− → eaq− | (3) |
| H* + OH* → H2O | (4) |
| 2H* → H2 | (5) |
| 2OH* → H2O2 | (6) |
Kierzkowska-Pawlak et al. revealed that the initial multiphoton absorption and sequent H2 production depend on the pulse energy, and the threshold pulse energy of hydrogen production was estimated to be approximately 0.0017–0.0028 mJ.16 Our experiments were performed with a moderate pulse energy of approximately 0.5 mJ to increase the overall H2 production while decreasing the H2 production per pulse. For high values of the pulse energy (>0.3 mJ), H2O2 decreases with the decomposition of H2O2, resulting in generating O2. This is due to H2O2 accumulations in the plasma volume generated by successive laser pulses. The overall reaction taking into account the decomposition of H2O2 has been proposed as:
| (X + 1)H2O → XH2 + H2O2 + ((X − 1)/2)O2 | (7) |
The results of the chemical composition analysis using a mass spectrometer indicate the formation of O2, as shown in Table S2 and Fig. S2.† Furthermore, the partial pressure of O2 generated from seawater increased compared with that generated from ultrapure water, suggesting accelerated decomposition of H2O2. According to the reaction (7), as the pulse energy was the same value for both samples, H2O2 decomposition enhancement implies that the energy density in seawater is enhanced compared with that in ultrapure water. As shown in Fig. 2(a) and (b), the curvature of the cylindrical cell affects H2 production strongly, and a larger n2 of the aqueous solution also provides H2 enhancement. In the literature, the n2 values of ultrapure water and physiological saline (included 0.9% NaCl) have been reported to be (1.3 ± 0.6) × 10−13 and (1.8 ± 1.3) × 10−13 esu, respectively,26 and that of seawater would be greater. These understandings are consistent with the result of H2O2 decomposition enhancement.
The H2 production capability of the MPI-WS system using femtosecond laser pulses is estimated to be 0.3 g kW h−1, considering the experimental conditions of the pulse energy (0.5 mJ per pulse) and repetition of femtosecond laser pulses (1 kHz). Our preliminary results are even comparable with leading plasma methods, e.g., corona (2 g H2 kW h−1),27 cost reduction of ion exchange membranes, and catalysts owing to direct H2 production from seawater can have a critical advantage. Furthermore, the light efficiency was evaluated by measuring the transmittance of laser beams with a power meter. The experimental apparatus and light efficiency for 30 minutes are shown in Fig. S3 and Table S4,† respectively. The light efficiency in seawater was evaluated to be 49% from the transmittance of the incident laser beam, and this value was higher than that reported by Reuther et al.15 The efficiency decreases with an increase of pulse energy, as the probability of multiphoton absorption increases exponentially with an increase of pulse energy. Note that H2 production per pulse saturates and the total H2 production would not show a significant increase.
Conclusions
In conclusion, we propose a direct H2 production method from seawater by MPI-WS incorporating an optical breakdown method. Notably, the differences in the curvature and nonlinear refractive index reduce the reaction area of laser ablation and gas production that result in ion enhancement. The reactions related to HER are also supported by H2O2 decomposition enhancement and the Kerr coefficient in an aqueous solution. H2 production from seawater is estimated to be 0.3 g kW h−1. In addition, emissions of Cl2 gas are absent owing to the direct laser radiation on H2O molecules. Our optical breakdown method is simple but potentially paves the way to a green society. Although the concept has been proved in this study, the optimization in both optical and chemical influences is due, and the optical configuration, e.g., the number of optical lenses, optical lens (the numerical aperture), the curvature of a cylindrical cell, is practical.20 Experimental studies on understanding the H2 production mechanism in the picosecond-to-femtosecond time scale and improving H2 production and energy efficiency are suggested in the future.Author contributions
AK and YM: conceptualization, methodology, investigation writing – original draft preparation, supervision, MM: conceptualization, writing – reviewing and editing, TK: investigation, NM: investigation, writing – original draft preparation.Conflicts of interest
There are no conflicts of interest to declare.Acknowledgements
This study was supported in part by JSPS KAKENHI Grant numbers JP20K14647, JP21H01858, JP21H01974, and the Research Institute of Green Science and Technology Fund for Research Project Support (2020-RIGST-21E02) National University Corporation Shizuoka University.References
- I. Dincer and C. Acar, Int. J. Hydrogen Energy, 2015, 40, 11094 Search PubMed.
- R. K. Parsapur, S. Chatterjee and K. W. Huang, ACS Energy Lett., 2020, 5, 2881 Search PubMed.
- S. Bock, R. Zacharias and V. Hacker, RSC Adv., 2019, 9, 23686 Search PubMed.
- G. Voitic and V. Hacker, RSC Adv., 2016, 6, 98267 Search PubMed.
- S. Arora and R. Prasad, RSC Adv., 2016, 6, 108668 Search PubMed.
- Z. P. Ifkovits, J. M. Evans, M. C. Meier, K. M. Papadantonakis and N. S. Lewis, Energy Environ. Sci., 2021, 14, 4740 Search PubMed.
- S. Martha, P. C. Sahoo and K. M. Parida, RSC Adv., 2015, 5, 61535 Search PubMed.
- Z. Wang, B. Xiao, Z. Lin, Y. Xu, Y. Lin, F. Meng, Q. Zhang, L. Gu, B. Fang, S. Guo and W. Zhong, Angew. Chem., Int. Ed., 2021, 60, 23388 Search PubMed.
- G. Liao, C. Li, X. Li and B. Fang, Cell Rep. Phys. Sci., 2021, 2, 100355 Search PubMed.
- Y. Liu, G. Xu, D. Ma, Z. Li, Z. Yan, A. Xu, W. Zhong and B. Fang, J. Cleaner Prod., 2021, 328, 129745 Search PubMed.
- Y. Liu, S. Shen, Z. Li, D. Ma, G. Xu and B. Fang, Mater. Charact., 2021, 174, 111031 Search PubMed.
- Y. Zhang, X. Wang, F. Luo, Y. Tan, L. Zeng, B. Fang and A. Liu, Appl. Catal., B, 2019, 256, 117852 Search PubMed.
- S. Dresp, F. Dionigi, M. Klingenhof and P. Strasser, ACS Energy Lett., 2019, 4, 933 Search PubMed.
- S. Horikoshi, L. Takahashi, K. Sueishi, H. Tanizawa and N. Serpone, RSC Adv., 2021, 11, 31590 Search PubMed.
- A. Reuther, A. Laubereau and D. N. Nikogosyan, J. Phys. Chem., 1996, 100, 16794 Search PubMed.
- H. K. Pawlak, J. Tyczkowski, A. Jarota and H. Abramczyk, Appl. Energy, 2019, 247, 24 Search PubMed.
- M. Abdalla, S. Hossain, O. B. Nisfindy, A. T. Azad, M. Dawood and K. A. Azad, Energy Convers. Manage., 2018, 165, 602 Search PubMed.
- N. Gray, S. McDonagh, R. O'Shea, B. Smyth and J. D. Murphy, Adv. Appl. Energy, 2021, 1, 100008 Search PubMed.
- H. Abe, A. Murakami, S. Tsunekawa, T. Okada, T. Wakabayashi, M. Yoshida and M. Nakayama, ACS Catal., 2021, 11, 6390 Search PubMed.
- J. Song, J. Guo, Y. Tian, B. Xue, Y. Lu and R. Zheng, Appl. Opt., 2018, 57, 1640 Search PubMed.
- V. Loriot, E. Hertz, O. Faucher and B. Lavorel, Opt. Express, 2009, 17, 13429 Search PubMed.
- Y. Mizushima and T. Saito, Appl. Phys. Lett., 2018, 107, 114102 Search PubMed.
- A. Couairon and A. Mysyrowicz, Phys. Rep., 2007, 441, 47 Search PubMed.
- J. A. Olivares and R. S. Houk, Anal. Chem., 1986, 58, 20 Search PubMed.
- V. K. Meader, M. G. John, C. J. Rodrigues and K. M. Tibbetts, J. Phys. Chem. A, 2017, 121, 6742 Search PubMed.
- B. A. Rockwell, W. P. Roach, M. E. Rogers, M. W. Mayo, C. A. Toth, C. P. Cain and G. D. Noojin, Opt. Lett., 1993, 18, 1792 Search PubMed.
- F. Rehman, A. S. W. Majeed and B. W. Zimmerman, Energy Fuels, 2013, 27, 2748 Search PubMed.
Footnotes |
| † Electronic supplementary information (ESI) available. See DOI: 10.1039/d2ra01337a |
| ‡ These authors contributed equally. |
| This journal is © The Royal Society of Chemistry 2022 |

