 Open Access Article
Bipolar fluorinated covalent triazine framework cathode with high lithium storage and long cycling capability†
Xiudong Chen‡
 *ac,
Hang Zhang‡d,
Ping Yana,
Bo Liu
 *b,
Xiaohua Caoa,
Changchao Zhan
 a,
Yawei Wanga and
Jin-Hang Liu*a
aSchool of Chemistry and Chemical Engineering, Jiangxi Province Engineering Research Center of Ecological Chemical Industry, Jiujiang University, Jiujiang, Jiangxi 332005, China. E-mail: chenxiudong_@126.com; ljh2016HUST@126.com
bCollege of Mathematics and Physics, Jinggangshan University, Ji'an, Jiangxi 343009, China. E-mail: liubo@jgsu.edu.cn
cState Key Laboratory of Organic–Inorganic Composites, Beijing University of Chemical Technology, Beijing 100029, China
dInstitute for Superconducting and Electronic Materials, Australian Institute for Innovative Materials, University of Wollongong, Innovation Campus, Squires Way, North Wollongong, NSW 2522, Australia
First published on 13th April 2022
Abstract
Organic materials with adjustable structures and wide sources are expected to become potential candidates for commercial cathodes of lithium-ion batteries (LIBs). However, most organic materials have unstable structures, poor conductivity, and are easily soluble in electrolytes, resulting in unsatisfactory lithium storage performance. Covalent–organic frameworks have attracted extensive attention due to their stable frame structures, adjustable pore structures and functionalized official groups. Herein, a fluorinated covalent triazine framework (FCTF) is synthesized by a simple ion-thermal method. Compared with the fluorine-free covalent triazine frameworks (CTFs), the introduction of fluorine improves the lithium storage performance of CTF. When used as a cathode for lithium ion batteries, FCTF can retain a reversible capacity of 125.6 mA h g−1 after 200 cycles at a current density of 100 mA g−1. Besides, it also delivers 106.3 mA h g−1 after 400 cycles at a current density of 200 mA g−1 with 0.03% decrease per cycle (from 40 to 400 cycles).
1. Introduction
Energy consumption in modern society is increasing. Due to the increasing depletion of fossil fuels and concerns about global warming, the use of renewable energies is crucial.1,2 Benefitting from the hard work of many researchers, a variety of energy storage systems have emerged, such as alkaline zinc–manganese batteries, lithium ion batteries (LIBs), sodium ion batteries, potassium ion batteries, lithium–sulfur batteries, and fuel cells.3–6 LIBs were commercialized in the early 1990s, mainly using graphite as the anode material and using layered oxides as commonly cathode materials.7 Currently, the theoretical capacities of commercial graphite anode and cathode materials are only 372 mA h g−1 and 150–200 mA h g−1, respectively, which are far from what are expected for next-generation LIBs.8 The development of electrode materials for LIBs with high energy and power density has become a key research issue, particularly for high-performance cathode materials. A series of inorganic electrode material (such as metal lithium oxides) are used as advanced cathode electrode materials for LIBs. Most of these works focus on developing the doping of different metals to improve theoretical capacity and cycling stability. However, the types of inorganic molecules for these studies are limited, and there are serious concerns about possible environmental pollution and limited resources, especially for metal-containing electrodes.Organic electrodes consist of natural chemical elements (such as C, H, O, N, S), providing an alternative method for developing greener and more sustainable energy storage equipment.9,10 Organic electrodes have the advantages of designability and flexibility. So far, various organic electrode materials (including organic sulfur compounds, organic radical compounds, organic carbonyl compounds, conductive polymers) have been extensively studied.11–13 Covalent–organic frameworks (COFs) are usually two-dimensional (2D) porous materials composed of light elements (C, N, B, etc.). COFs have tunable structures with different functional groups and a variety of covalent bone components.14,15 Since Yaghi et al. first designed and synthesized 2D COF-1 via the dehydration condensation of 1,4-benzenediboronic acid with excellent crystal shapes in 2005,16 COFs have been widely explored in gas storage/separation, catalysis, and photoelectric conversion mainly due to their porosity and structural diversity.17–21 In addition, though still rarely investigated for LIBs, COFs are regarded as promising organic electrode candidates since the dissolution problem of the organic electrodes in organic electrolytes can be greatly hindered in the COF network due to their strong and extended framework. Among them, covalent triazine frameworks (CTFs) are porous organic materials with stable structure, mainly constructed by the trimerization of nitrile to generate a triazine ring.22,23 CTFs have a great deal of unique characteristics, such as high chemical stability and rich N, which have amazing heteroatomic effects and great application value. The stable structure of CTFs leads to a long service life and good economic benefits.
Considering practicality, the high stability of the material is important to maintain its economic value and material properties.24 Therefore, the stable CTF structure may be helpful for many large-scale applications of energy storage. Herein, we report a simple synthetic strategy to prepare a fluorinated covalent triazine framework (FCTF) as a cathode material for LIBs. FCTF undergoes a unique faradaic reaction when discharging and charging as it can be present in a n/p-doped condition. Due to the unique reaction system, FCTF can exhibit good capacity at high voltage and experience a little capacity decrease.
2. Experimental section
Tetrafluoroterephthalonitrile, 1,4-terephthalonitrile, poly(vinylidene difluoride) (PVDF, 99%) and acetylene black (AB, >99%) were purchased from J&K scientific. A LiPF6 electrolyte (1 M in a mixed ethylene carbonate/diethyl carbonate solution, 1![[thin space (1/6-em)]](https://www.rsc.org/images/entities/char_2009.gif) :
:![[thin space (1/6-em)]](https://www.rsc.org/images/entities/char_2009.gif) 1, w/w) was brought from Guotai Huarong Chemical New Material Co., Ltd. The other reagents and chemicals were all from Sinopharm Chemical Reagent Co., Ltd (Shanghai, China). All the chemicals were utilized in their received status without further purification.
1, w/w) was brought from Guotai Huarong Chemical New Material Co., Ltd. The other reagents and chemicals were all from Sinopharm Chemical Reagent Co., Ltd (Shanghai, China). All the chemicals were utilized in their received status without further purification.
2.1 Synthesis of FCTF and CTF
FCTF and CTF were synthesized by self-polymerization under the catalysis of ZnCl2.25 In a typical experiment, ZnCl2 and tetrafluoroterephthalonitrile (C8F4N2) (5![[thin space (1/6-em)]](https://www.rsc.org/images/entities/char_2009.gif) :
:![[thin space (1/6-em)]](https://www.rsc.org/images/entities/char_2009.gif) 1 in molar) were transferred into a quartz ampoule after mixing under an inert atmosphere. Then, the ampoule was evacuated and sealed before heated for 40 h (400 °C). The powder was acquired and then stirred in diluted HCl for one day. After washing with water and tetrahydrofuran, the powder was dried at 120 °C for 10 h in vacuum to obtain FCTF. CTF was synthesized in the same way except 1,4-terephthalonitrile (C8H4N2) was used.
1 in molar) were transferred into a quartz ampoule after mixing under an inert atmosphere. Then, the ampoule was evacuated and sealed before heated for 40 h (400 °C). The powder was acquired and then stirred in diluted HCl for one day. After washing with water and tetrahydrofuran, the powder was dried at 120 °C for 10 h in vacuum to obtain FCTF. CTF was synthesized in the same way except 1,4-terephthalonitrile (C8H4N2) was used.
2.2 Fabrication of FCTF and CTF electrodes
Both FCTF and CTF electrodes were obtained by distributing their powder blends with acetylene black, and poly(vinylidene fluoride) binder (8![[thin space (1/6-em)]](https://www.rsc.org/images/entities/char_2009.gif) :
:![[thin space (1/6-em)]](https://www.rsc.org/images/entities/char_2009.gif) 1
1![[thin space (1/6-em)]](https://www.rsc.org/images/entities/char_2009.gif) :
:![[thin space (1/6-em)]](https://www.rsc.org/images/entities/char_2009.gif) 1, w/w) in a NMP (1-methyl-2-pyrrolidinone) solution, respectively. After that, the acquired slurry was coated on an aluminum foil and dried at 80 °C for more than 8 h in a vacuum oven.
1, w/w) in a NMP (1-methyl-2-pyrrolidinone) solution, respectively. After that, the acquired slurry was coated on an aluminum foil and dried at 80 °C for more than 8 h in a vacuum oven.
2.3 Material characterization
TEM and SEM characterizations were conducted by JEM-2010F and JSM-6700F, respectively, to survey the morphologies of the materials. Structural information of the as-synthesized products was investigated on a Fourier transform infrared spectrometer (Nicolet 380 FTIR spectrometer), XRD (Cu Kα radiation, Rigaku D/max-2550 V), TGA (NETZSCH STA 409 PG/PC in N2), and Raman spectroscopy (Renishaw in plus, excitation wavelength: 785 nm, spot size: ∼1.2 μm, excitation power: 3 mW).2.4 Electrochemical measurements
A lithium foil was sliced into disks (12 mm in diameter) and used as the counter electrode. A 1 M LiPF6 solution in the mixed solvent of EC (ethylene carbonate) and DEC (dimethyl carbonate) (1![[thin space (1/6-em)]](https://www.rsc.org/images/entities/char_2009.gif) :
:![[thin space (1/6-em)]](https://www.rsc.org/images/entities/char_2009.gif) 1, w/w) was chosen as the electrolyte. The mass loading of the electrode was 1.3 mg cm−2 with an electrolyte volume of 30 μL mg−1 in every cell. A polyethylene membrane was used as the separator. The capacities are based on the total mass of the FCTF or CTF as well as current densities. Cyclic stability was tested on a LAND-CT2001 system in the voltage range of 1.5–4.5 V. Cyclic voltammetry (CV) was performed on a CHI760E electrochemical workstation. All the electrochemical tests were conducted at 25 °C.
1, w/w) was chosen as the electrolyte. The mass loading of the electrode was 1.3 mg cm−2 with an electrolyte volume of 30 μL mg−1 in every cell. A polyethylene membrane was used as the separator. The capacities are based on the total mass of the FCTF or CTF as well as current densities. Cyclic stability was tested on a LAND-CT2001 system in the voltage range of 1.5–4.5 V. Cyclic voltammetry (CV) was performed on a CHI760E electrochemical workstation. All the electrochemical tests were conducted at 25 °C.
2.5 Computational methods
All calculations were executed based on the density functional theory (DFT) within the Generalized Gradient Approximation and Perdew–Burke–Ernzerhof (GGA-PBE) method as implemented in the Vienna Ab initio Simulation Package (VASP).26,27 An energy cutoff of 500 eV was applied for the plane-wave expansion of electronic wave functions. The structures were fully relaxed until the convergence criteria of the forces on each atom and energy were less than 0.02 eV Å−1 and 10−5 eV, respectively. The Brillouin zone was sampled with 3 × 3 × 1 and 5 × 5 × 1 Monkhorst–Pack mesh k-point grid for structural optimizations and electronic structure calculations, respectively. To account for the weak van der Waals (vdW) interaction between the FCTF interlayers, the vdW-D2 scheme was employed to describe the FCTF systems.283. Results and discussion
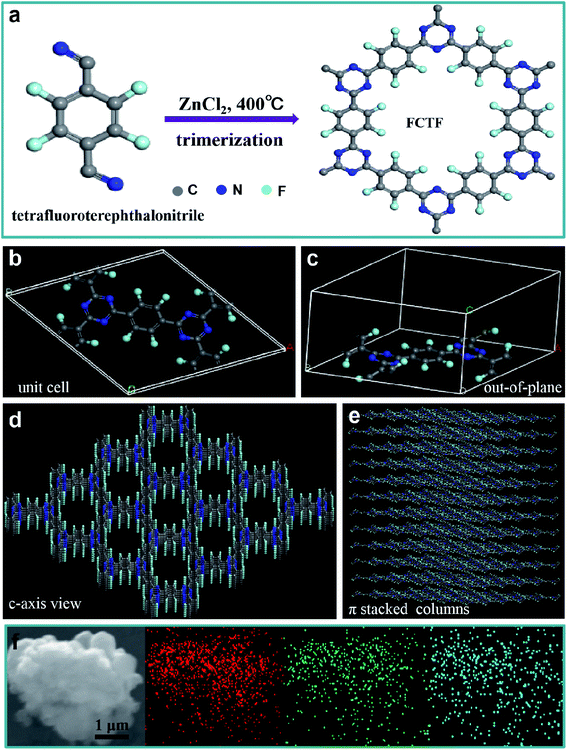
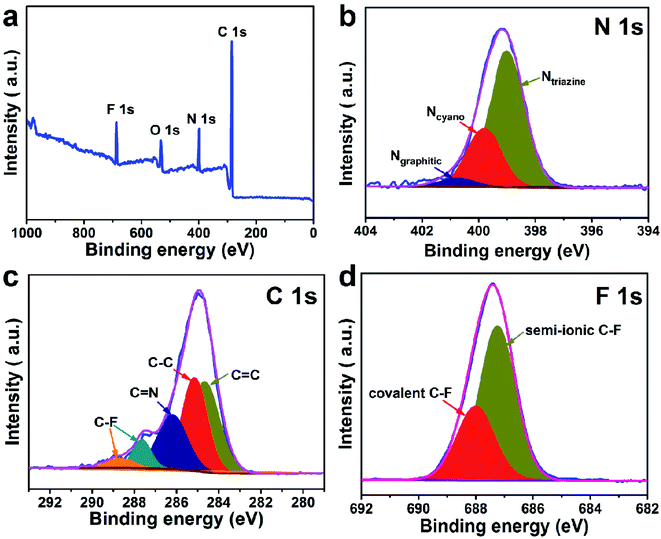
The preparation process of CTF and FCTF are schematically illustrated in Fig. 1a and S1.† Under the catalysis of ZnCl2, CTF and FCTF were successfully synthesized by the self-polymerization of C8H4N2 and C8F4N2, respectively. The morphological features of the synthesized materials were characterized by scanning electron microscopy (SEM) and transmission electron microscopy (TEM). As displayed in Fig. S2 and S3,† CTF displays a bulky, rough and opaque two-dimensional morphology with a lateral size of 2–3 μm. Similar to CTF, the FCTF was synthesized by the same method and has the analogous morphology. The optimized structure of the single-layer FCTF is displayed in Fig. 1b and c. Our calculated optimized lattice constant is a = b = 14.65 Å, which is in good agreement with the experimentally reported value of 14.58 Å. The FCTF holds a hexagonal planar structure along the c-axis view (Fig. 1d). The multi-layered structure of FCTF, consisting of a parallel-stacked structure held by π–π interactions, is shown in Fig. 1e. Fig. 1f shows the element mapping of FCTF and it can be observed that carbon, nitrogen and fluorine are evenly distributed.The chemical structural information of the material was further obtained via FTIR spectroscopy, Raman spectroscopy, XRD, XPS, and TGA measurements. As displayed in Fig. 2a, a peak at 2250 cm−1 on the FTIR spectra of the two monomers (C8H4N2 and C8F4N2) can be attributed to the intense carbonitrile groups.22 Interestingly, the peak at 2250 cm−1 disappeared and two peaks located at 1580 cm−1 and 1310 cm−1 can be attributed to the vibration of triazine rings on the spectra of CTF and FCTF, which confirmed the successful occurrence of the trimerization reaction.23,29 From the Raman analysis (Fig. 2b), two strong signals at 1350 and 1570 cm−1 are assigned to the D peak and G peak, respectively. The D/G peak intensity ratio (ID/IG) of CTF is 0.81, which is slightly smaller than that of FCTF (0.83), indicating that FCTF has higher defects. It can be seen from the XRD test that both CTF and FCTF have broad peaks around 25°, which indicates their amorphous structure (Fig. 2c).23,30 The reason for the amorphous structure may be the excessive ZnCl2 added during the synthesis process, which will hinder the periodic nucleation in the vertical direction, thereby greatly reducing the crystallinity and forming an amorphous structure.30 It is worth noting that it has been proven that the amorphous CTF material is advantageous for electrolyte immersion and improving energy storage, while the crystalline CTF material can only retain weak specific capacity.23 Moreover, the XPS spectrum of FCTF shows signals at 688.4, 399.5, and 287.6 eV, which are assigned to F 1s, N 1s and C 1s, respectively (Fig. 3a). As indicated, the N 1s spectrum can be divided into three peaks at 398.7 eV (Ntriazine), 399.8 eV (Ncyano), and 400.9 eV (Ngraphitic) (Fig. 3b). The C 1s spectrum (Fig. 3c) illustrates the deconvolution peaks of C–F (289.0, and 287.6 eV), C![[double bond, length as m-dash]](https://www.rsc.org/images/entities/char_e001.gif) N (286.1 eV), C–C (285.1 eV), and C
N (286.1 eV), C–C (285.1 eV), and C![[double bond, length as m-dash]](https://www.rsc.org/images/entities/char_e001.gif) C (284.2 eV). Besides, the F 1s spectrum shows two peaks at 687.5 (semi-ionic C–F) and 688.2 eV (covalent C–F) (Fig. 3d). From the TGA analysis (Fig. S4†), a weight loss of less than 8% was observed during the temperature change from room temperature to 600 °C, indicating that both CTF and FCTF have high thermal stability.
C (284.2 eV). Besides, the F 1s spectrum shows two peaks at 687.5 (semi-ionic C–F) and 688.2 eV (covalent C–F) (Fig. 3d). From the TGA analysis (Fig. S4†), a weight loss of less than 8% was observed during the temperature change from room temperature to 600 °C, indicating that both CTF and FCTF have high thermal stability.
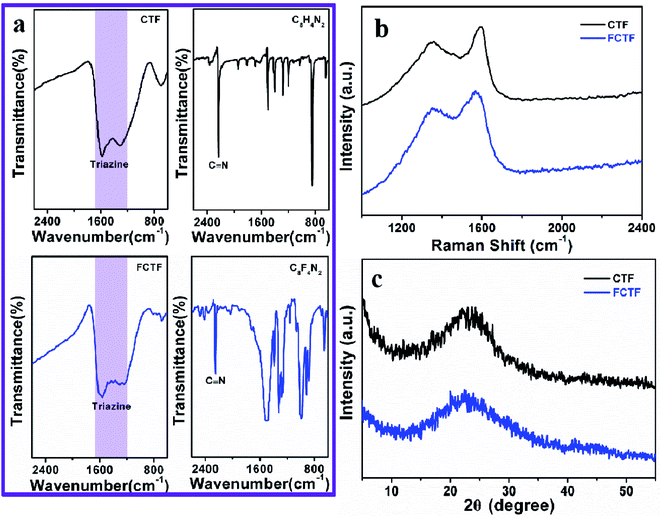 | ||
| Fig. 2 (a) FTIR spectra of CTF, FCTF and their monomers. (b) Raman spectrum of CTF and FCTF. (c) XRD pattern of CTF and FCTF. | ||
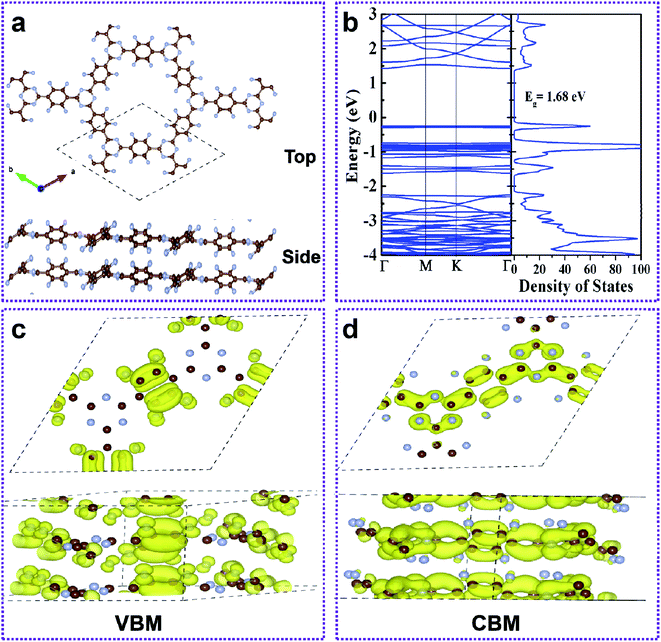
The FCTF and CTF layers are connected by weak interaction forces, which may have many stacking modes. Here, the two most likely stacking modes (AA stacking, AA and AB stacking, AB) were considered (Fig. S5†). The AA is modelled by stacking one CTF layer over another and keeping a certain distance between them along the z-direction. The AB is achieved by offsetting one layer of the CTF relative to the other in the basal plane.31 The top and side views of the AA-stacked bilayer FCTF are shown in Fig. 4a. To determine the energetically more stable stacking mode between AA and AB, we calculated the binding energy (Eb) by the following equation for evaluation.
| Eb = E(bilayer FCTF) − 2E(monolayer FCTF), | (1) |
The formation of the double layer FCTF and CTF is energetically more favorable when Eb is negative. The calculated Eb of bilayer FCTF and CTF for AA are 0.54 eV and 0.11 eV, respectively, which are lower than the Eb of AB. Therefore, the AA sequence is energetically more beneficial than AB. In addition to this, we found that the binding energy of bilayer FCTF is more negative than that of bilayer CTF (Fig. S6†). Next, we have inquired into the electronic properties of the AA double layer FCTF. The balance interlayer distance of the double layer FCTF is calculated to be 3.60 Å, which is consistent with the experimentally reported value of 3.56 Å.32 To investigate the electronic property of double layer FCTF, the electronic band structure and DOS of bilayer FCTF are calculated. The high-level SCAN meta-GGA functional is used to access the band gap because the GGA-PBE function usually underestimates the band gap. The bilayer FCTF is a direct band gap semiconductor at the Γ point with a band gap of 1.68 eV (Fig. 4b), which is lower than the bilayer CTF (Fig. S7†). The reduction in the band gap is mainly attributed to the fluoride ion charge transfer. To illustrate the flat-band nature of the CBM and VBM of bilayer FCTF, we have examined the band-decomposed charge density of those states marked in Fig. 4c and d, respectively. From the charge density plot, it is seen that the wave functions corresponding to the VBM and CBM states are highly localized. The localized nature of wave functions gives rise to the flat-band nature of the VBM and CBM states.33 The bilayer CTF system also has similar calculation results (Fig. S8†).
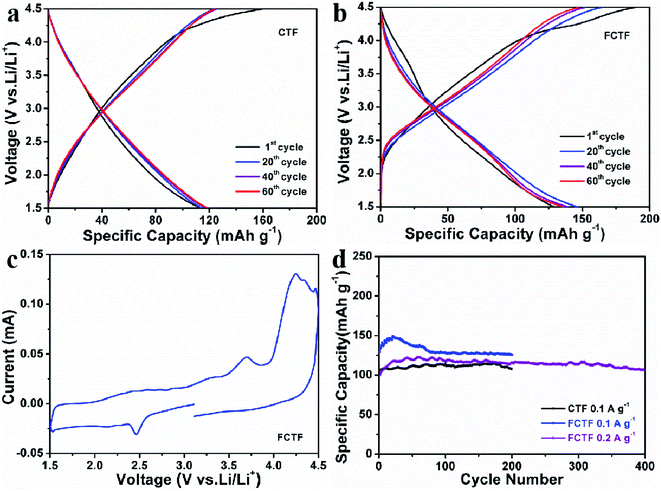
Discharging/charging and CV measurements were performed when CTF and FCTF were utilized as cathodes for LIBs. The 1st reversible specific capacity of CTF is 119 mA h g−1, and the curves of 20, 40 and 60 cycles are very close (Fig. 5a). Similar curve shape and almost identical reversible capacity entail excellent reversible electrochemical behaviors for the CTF electrode. The 1st reversible specific capacity of FCTF is 129 mA h g−1 and it retains 136 mA h g−1 after 60 cycles (Fig. 5b). Moreover, the CV curve of the FCTF can be divided into two parts (Fig. 5c). In the voltage from 1.5 V to 3 V, it is mainly the n-doping mechanism, which can be attributed to the reversible electrochemical reaction of the redox reaction between the triazine rings and Li+.23,34 In the part from 3 V to 4.5 V, when LiPF6 is used as the electrolyte, a p-doping reaction kicked in where only the triazine rings are oxidized and combined with the anion (PF6−) to maintain charge balance.15 This bipolar redox-active energy storage system indicates that FCTF played the roles of a p-dopable polymer and n-dopable polymer simultaneously. The electrochemical performance of FCTF is much better than that of CTF materials, as displayed in Fig. 5d. The reversible capacity of 125.6 mA h g−1 after 200 cycles at a current density 100 mA g−1 can be obtained when FCTF is employed as a cathode for LIBs. The excellent lithium storage performance of FCTF may be attributed to its unique pore structure, which facilitates the rapid transport of lithium ions, thereby enhancing the electrochemical performance.35–37 In addition, the negative charge of the fluorine atoms in the FCTF can promote Li accessibility and enhance the dynamic behavior of electrodes, thereby increasing the electrochemical performance during the discharge and charge processes. Under the same test conditions, the CTF only delivers a capacity of 107.5 mA h g−1 after 200 cycles. This shows that the introduction of F enhances the electrochemical activity of CTF materials. It can be seen that the capacity slowly increased during the first several cycles of the FCTF electrode, which may be attributed to the better wetting of the electrolyte and the activation process of the material. In addition, FCTF also delivers 106.3 mA h g−1 after 400 cycles at a current density of 200 mA g−1 with 0.03% decrease per cycle (from 40 to 400 cycles). The rate capabilities of the FCTF and CTF electrode were further explored at varied current densities (Fig. S9†). At the currents of 0.05 and 2 A g−1, the reversible capacities of FCTF are 164.9 and 36.7 mA h g−1, respectively, which are larger than those values (135.1 and 32.8 mA h g−1) of CTF.
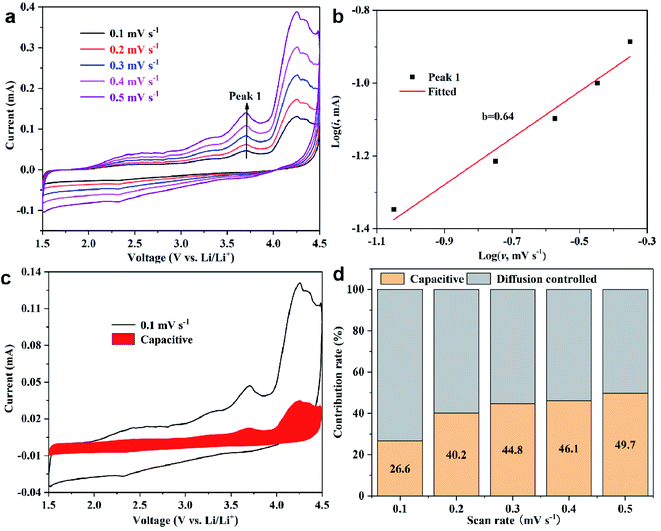
To explore the ion kinetics of FCTF, the quantitative capacitance and diffusion effects of the electrodes were further examined by CV measurements at different scan rates. Fig. 6a shows the CV curves of the scan rate increasing from 0.1 to 0.5 mV s−1. The relationship between the current (i) and the scan rate (v) can be described by the equation i = avb, where a and b are parameters. A value of b that is close to 1 indicates that the electrode is dominated by capacitive contribution, and a value close to 0.5 is dominated by ion diffusion control.38,39 The plots of log(i) versus log(v) for peak is presented in Fig. 6b. The b-values determined by the slope of the peak is 0.64. The results demonstrate that both ion diffusion-controlled process and capacitive behavior happen within the FCTC electrode in the charging and discharging process. They endow the electrode materials with high capacity and fast charge transfer, respectively.40 Moreover, the current response can be divided into diffusion-controlled and capacitive contributions: i = k1v + k2v1/2. Through careful calculations (Fig. 6c and d), it is found that the ion diffusion-controlled process is generally higher than the capacitive controlled, which is favorable for the high reversible capacity of the FCTF.
4. Conclusion
In summary, a bipolar fluorinated covalent triazine framework was synthesized by the self-polymerization of tetrafluoroterephthalonitrile. When utilized as the cathode materials for LIBs, FCTF acted as a p/n dopable polymer cathode simultaneously. Compared with CTF, the lithium organic battery system based on FCTF has better electrochemical performance (125.6 mA h g−1 after 200 cycles at 100 mA g−1 and 106.3 mA h g−1 after 400 cycles at 200 mA g−1 with only a 0.03% decrease per cycle). This indicates that the triazine frameworks have great potential as cathode electrodes, thereby cutting back the use of transition metals which are harmful to the environment.Conflicts of interest
There are no conflicts to declare.Acknowledgements
This work was supported by the National Natural Science Foundation of China (22065017, 12004145, 22163003), China Postdoctoral Science Foundation (BX2021029, 2021M700353), the opening Foundation of State Key Laboratory of Organic–Inorganic Composites, Beijing University of Chemical Technology (oic-202201011), the Jiangxi Provincial Natural Science Foundation (20202BABL213012, 20212BAB214032), Education Department of Jiangxi Province Natural Science Foundation of China (GJJ211801), Ji'an Science and Technology Plan Project (20211-015311). All the computations were performed on the high-performance computing platform of Shanghai University and Jinggangshan University.References
- S. Yun, Y. Zhang, Q. Xu, J. Liu and Y. Qin, Nano Energy, 2019, 60, 600–619 CrossRef CAS.
- K. S. Kang, Y. S. Meng, J. Bréger, C. P. Grey and G. Ceder, Science, 2006, 311, 977–980 CrossRef CAS.
- Y. Pang, J. S. Wei, Y. G. Wang and Y. Y. Xia, Adv. Energy Mater., 2018, 8, 1702288 CrossRef.
- Y. M. Sun, N. A. Liu and Y. Cui, Nat. Energy, 2016, 1, 16071 CrossRef CAS.
- Z. C. Xiao, D. B. Kong, Q. Song, S. K. Zhou, Y. B. Zhang, A. Badshaha, J. X. Liang and L. J. Zhi, Nano Energy, 2018, 46, 365–371 CrossRef CAS.
- M. D. Tikekar, S. Choudhury, Z. Tu and L. A. Archer, Nat. Energy, 2016, 1, 16114 CrossRef CAS.
- Y. Liu, Z. B. Wang, Y. J. Zhong, M. Tade, W. Zhou and Z. P. Shao, Adv. Funct. Mater., 2017, 27, 1701229 CrossRef.
- P. Roy and S. K. Srivastava, J. Mater. Chem. A, 2015, 3, 2454–2484 RSC.
- X. D. Chen, H. Zhang, C. Ci, W. W. Sun and Y. Wang, ACS Nano, 2019, 13, 3600–3607 CrossRef CAS.
- Z. P. Song, Y. M. Qian, M. L. Gordin, D. H. Tang, T. Xu, M. Otani, H. Zhan, H. S. Zhou and D. H. Wang, Angew. Chem., Int. Ed., 2015, 54, 13947–13951 CrossRef CAS PubMed.
- Y. W. Wu, R. H. Zeng, J. M. Nan, D. Shu, Y. C. Qiu and S.-L. Chou, Adv. Energy Mater., 2017, 7, 1700278 CrossRef.
- C. Zhang, Y. Qiao, P. X. Xiong, W. Y. Ma, P. X. Bai, X. Wang, Q. Li, J. Zhao, Y. F. Xu, Y. Chen, J. H. Zeng, F. Wang, Y. H. Xu and J. X. Jiang, ACS Nano, 2019, 13, 745–754 CrossRef CAS.
- Q. Zhao, Y. Lu and J. Chen, Adv. Energy Mater., 2017, 7, 1601792 CrossRef.
- K. Y. Geng, T. He, R. Y. Liu, S. Dalapati, K. T. Tan, Z. P. Li, S. S. Tao, Y. F. Gong, Q. H. Jiang and D. L. Jiang, Chem. Rev., 2020, 120, 8814–8933 CrossRef CAS.
- R. Y. Liu, K. T. Tan, Y. F. Gong, Y. Z. Chen, Z. E. Li, S. L. Xie, T. He, Z. Lu, H. Yang and D. L. Jiang, Chem. Soc. Rev., 2021, 50, 120–242 RSC.
- A. P. Cote, A. I. Benin, N. W. Ockwig, M. O'Keeffe, A. J. Matzger and O. M. Yaghi, Science, 2005, 310, 1166 CrossRef CAS PubMed.
- Z. L. Li, H. Li, X. Y. Guan, J. J. Tang, Y. R. Yusran, Z. Li, M. Xue, Q. R. Fang, Y. S. Yan, V. Valtchev and S. L. Qiu, J. Am. Chem. Soc., 2017, 139, 17771–17774 CrossRef CAS PubMed.
- H. Y. Liu, J. Chu, Z. L. Yin, X. Cai, L. Zhuang and H. X. Deng, Chem, 2018, 4, 1696 CAS.
- X. D. Chen, W. W. Sun and Y. Wang, ChemElectroChem, 2020, 7, 3905–3926 CrossRef CAS.
- X. D. Chen, Y. S. Li, L. Wang, Y. Xu, A. M. Nie, Q. Q. Li, F. Wu, W. W. Sun, X. Zhang, R. Vajtai, P. M. Ajayan, L. Chen and Y. Wang, Adv. Mater., 2019, 31, 1901640 CrossRef PubMed.
- L. Zhao, X. X. Tang, L. P. Lv, S. Q. Chen, W. W. Sun and Y. Wang, ChemSusChem, 2021, 14, 3283–3292 CrossRef CAS PubMed.
- P. Kuhn, M. Antonietti and A. Thomas, Angew. Chem., Int. Ed., 2008, 47, 3450–3453 CrossRef CAS.
- K. Sakaushi, G. Nickerl, F. M. Wisser, D. Nishio-Hamane, E. Hosono, H. Zhou, S. Kaskel and J. Eckert, Angew. Chem., Int. Ed., 2012, 21, 7850–7854 CrossRef.
- S. N. Talapaneni, T. H. Hwang, S. H. Je, O. Buyukcakir, J. W. Choi and A. Coskun, Angew. Chem., Int. Ed., 2016, 55, 3106–3111 CrossRef CAS PubMed.
- F. Xu, S. H. Yang, G. S. Jiang, Q. Ye, B. Q. Wei and H. Q. Wang, ACS Appl. Mater. Interfaces, 2017, 9, 37731–37738 CrossRef CAS.
- P. E. Blöchl, Phys. Rev. B: Condens. Matter Mater. Phys., 1994, 50, 17953–17979 CrossRef.
- J. P. Perdew, K. Burke and M. Ernzerhof, Phys. Rev. Lett., 1996, 77, 3865–3868 CrossRef CAS PubMed.
- S. Grimme, J. Comput. Chem., 2004, 25, 1463–1473 CrossRef CAS PubMed.
- H. Zhang, W. W. Sun, X. D. Chen and Y. Wang, ACS Nano, 2019, 13, 14252–14261 CrossRef CAS PubMed.
- P. Kuhn, A. Thomas and M. Antonietti, Macromolecules, 2009, 42, 319–326 CrossRef CAS.
- B. Liu, T. Y. Gao, P. G. Liao, Y. F. Wen, M. J. Yao, S. Q. Shi and W. Q. Zhang, Phys. Chem. Chem. Phys., 2021, 23, 18784–18793 RSC.
- S. Q. Ren, M. J. Bojdys, R. Dawson, A. Laybourn, Y. Z. Khimyak, D. J. Adams and A. I. Cooper, Adv. Mater., 2012, 24, 2357–2361 CrossRef CAS.
- B. Ball, C. Chakravarty and P. Sarkar, J. Phys. Chem. C, 2019, 123, 30155–30164 CrossRef CAS.
- R. X. Yuan, W. B. Kang and C. H. Zhang, Materials, 2018, 11, 937 CrossRef PubMed.
- Y. Zhang, X. X. Wang, F. Q. Luo, Y. Tan, L. X. Zeng, B. Z. Fang and A. H. Liu, Appl. Catal., B, 2019, 256, 117852 CrossRef CAS.
- L. F. Lu, B. Wang, D. Wu, S. H. Zou and B. Z. Fang, Nanoscale, 2021, 13, 3709–3722 RSC.
- B. Z. Fang, L. Daniel, A. Bonakdarpour, R. Govindarajan, J. Sharman and D. P. Wilkinson, Small, 2021, 17, 2102288 CrossRef CAS.
- T. Brezesinski, J. Wang, S. H. Tolbert and B. Dunn, Nat. Mater., 2010, 9, 146–151 CrossRef CAS PubMed.
- M. R. Lukatskaya, O. Mashtalir, C. E. Ren, Y. Dall'Agnese, P. Rozier, P. L. Taberna, M. Naguib, P. Simon, M. W. Barsoum and Y. Gogotsi, Science, 2013, 341, 1502–1505 CrossRef CAS.
- D. Chao, C. Zhu, P. Yang, X. Xia, J. Liu, J. Wang, X. Fan, S. V. Savilov, J. Lin, H. J. Fan and Z. X. Shen, Nat. Commun., 2016, 7, 12122 CrossRef CAS.
Footnotes |
| † Electronic supplementary information (ESI) available. See https://doi.org/10.1039/d2ra01582j |
| ‡ X. D. C. and H. Z. contributed equally to this work. |
| This journal is © The Royal Society of Chemistry 2022 |

