 Open Access Article
Structure, thermostability and magnetic properties of cubic Ce2−xTi2O7 pyrochlore obtained via sol–gel preparation
Jiandi Lia,
Aijun Gong *ab,
Xingyan Lia,
Yanfei Hea,
Jinsheng Lia,
Yuzhen Baia and
Rongrong Fanc
aCollege of Chemistry and Biological Engineering, University of Science and Technology Beijing, Beijing 100083, China. E-mail: gongaijun5661@ustb.edu.cn
bBeijing Key Laboratory for Science and Application of Functional Molecular and Crystalline Materials, University of Science and Technology Beijing, Beijing 100083, China
cKunshan Hexin Mass Spectrometry Technology Co, Ltd, Jiangsu 215300, China
First published on 30th May 2022
Abstract
Lanthanum-based titanates have been attracting considerable interest by virtue of their structural operability and hence diverse physical properties. The preparation of lanthanum-based titanates with novel crystal structure is a fascinating task. In this work, we report the preparation of a cubic Ce2−xTi2O7 pyrochlore using the sol–gel method. The crystal structure, thermostability and magnetism were studied via the temperature dependence of X-ray powder diffraction, X-ray photoelectron spectroscopy and magnetization measurements. It has been revealed that the as-prepared Ce2−xTi2O7 pyrochlore possesses a cubic symmetry (space group: Fd![[3 with combining macron]](https://www.rsc.org/images/entities/char_0033_0304.gif) m), however there is an 18(1)% vacancy of Ce ions in the as-prepared samples. No distinct phase transition and thermal expansion anomaly were observed in the investigated temperature range from 300 K to 700 K. Intriguingly, lattice defects may favor the transformation of Ce valence from +3 to +4 and an unusual weak magnetic ordering state emerged up to 400 K. The persistence of magnetism at such high temperatures is rare and mysterious for cerium titanates. Our findings provide the possibility of adjusting the crystal structure and magnetic properties of cerium titanates, anticipated to the development of lanthanum-based oxides.
m), however there is an 18(1)% vacancy of Ce ions in the as-prepared samples. No distinct phase transition and thermal expansion anomaly were observed in the investigated temperature range from 300 K to 700 K. Intriguingly, lattice defects may favor the transformation of Ce valence from +3 to +4 and an unusual weak magnetic ordering state emerged up to 400 K. The persistence of magnetism at such high temperatures is rare and mysterious for cerium titanates. Our findings provide the possibility of adjusting the crystal structure and magnetic properties of cerium titanates, anticipated to the development of lanthanum-based oxides.
Introduction
Pyrochlores have attracted considerable interest by virtue of their structural operability, which leads to diverse physical properties,1–3 such as good thermal stability,1 ionic conductivity,2 ferroelectricity,3 magnetism4 and catalysis.5 The general chemical formula of pyrochlores is A2B2O7, where A represents lanthanide or alkaline or Pb/Bi cation and B the 3d transition metal cation such as Ti or Nb.6 Ideally, the A2B2O7-based perovskites show a cubic structure (space group: Fd![[3 with combining macron]](https://www.rsc.org/images/entities/char_0033_0304.gif) m), where the cation A coordinates with 8 O anions and B coordinates with 6 anions. The shape of the BO6-octahedron is very sensitive to the chemical composition and external physical field (temperature, magnetic and pressure).7 This gives large space to manipulate the structure of A2B2O7 together with the properties using chemical and physical methods.8 For instance, a typical pyrochlore Gd2Ti2O7 demonstrates an insulating behavior, whereas Gd2Zr2O7 is a good oxide-ion conductor.9,10
m), where the cation A coordinates with 8 O anions and B coordinates with 6 anions. The shape of the BO6-octahedron is very sensitive to the chemical composition and external physical field (temperature, magnetic and pressure).7 This gives large space to manipulate the structure of A2B2O7 together with the properties using chemical and physical methods.8 For instance, a typical pyrochlore Gd2Ti2O7 demonstrates an insulating behavior, whereas Gd2Zr2O7 is a good oxide-ion conductor.9,10
Lanthanum-based pyrochlore/perovskite oxides have become one of the most investigated materials in the past 50 years.11,12 It has been found that multiple A/B element substitutions may result in lattice distortions and structural transformations, especially the combination of A/B with different valences.13 For example, both LaMnO3 and CaMnO3 demonstrate insulating behaviour, whereas La1−xCaxMnO3 solid solutions exhibit conductive and giant magnetoresistance effects in intermediate compositions.14,15 This mechanism has remained controversial until now. One of assumption is due to the various valence of cation La3+ and Ca2+ the cation Mn may be distributed in the time and space dimensions with different valence of Mn3+ and Mn4+.21–24 As magnetic ordering emerges, the transformation from Mn3+ to Mn4+ triggered a double exchange interaction of Mn3+–O2−–Mn4+, and the magnetoresistance effects were observed accordingly. The preparation of pyrochlore/perovskite oxides with novel structures is a fascinating task and provides an opportunity to find new physical phenomena.
Among cerium pyrochlores, Ce2Ti2O7 possesses a cubic structure (space group: Fd![[3 with combining macron]](https://www.rsc.org/images/entities/char_0033_0304.gif) m).16 The oxygen non-stoichiometry (i.e. deficiency and excess) can bring about a change in the charges of the cations Ce and Ti, which may induce intriguing physical properties.17 Oxygen deficiency in the sample can be achieved by heat treatment in a reducing atmosphere and the excess with an oxidizing one.18 Interestingly, the oxygen deficiency or excess may exist in the crystal structure with an ordered state, which leads to the adjustment of the Ce content, the charge of Ce ions and the electronic structure.19 The conductivity and magnetism can make a difference at the macroscale. However, the detailed structural evolution of Ce2Ti2O7 with temperature remains unclear and the magnetisation of Ce2Ti2O7 is always restricted to low temperature, generally less than 200 K.20
m).16 The oxygen non-stoichiometry (i.e. deficiency and excess) can bring about a change in the charges of the cations Ce and Ti, which may induce intriguing physical properties.17 Oxygen deficiency in the sample can be achieved by heat treatment in a reducing atmosphere and the excess with an oxidizing one.18 Interestingly, the oxygen deficiency or excess may exist in the crystal structure with an ordered state, which leads to the adjustment of the Ce content, the charge of Ce ions and the electronic structure.19 The conductivity and magnetism can make a difference at the macroscale. However, the detailed structural evolution of Ce2Ti2O7 with temperature remains unclear and the magnetisation of Ce2Ti2O7 is always restricted to low temperature, generally less than 200 K.20
Herein, we report the successful preparation of the novel cubic Ce2−xTi2O7 sample using the conventional sol–gel method. Crystal structure, thermostability and magnetic properties were comprehensively investigated via the temperature dependence of XRD patterns, X-ray photoelectron spectroscopy (XPS) and magnetization measurements. The as-prepared Ce2−xTi2O7 possessed a conventional cubic symmetry (space group: Fd![[3 with combining macron]](https://www.rsc.org/images/entities/char_0033_0304.gif) m); however, there was an 18% vacancy of Ce ions in the as-prepared samples. Neither the distinct phase transition nor the thermal expansion anomaly was observed with the investigated temperatures. Intriguingly, lattice defects might favor the transformation of Ce valence from +3 to +4, and an unusual weak magnetic ordering state emerged up to 400 K.
m); however, there was an 18% vacancy of Ce ions in the as-prepared samples. Neither the distinct phase transition nor the thermal expansion anomaly was observed with the investigated temperatures. Intriguingly, lattice defects might favor the transformation of Ce valence from +3 to +4, and an unusual weak magnetic ordering state emerged up to 400 K.
Experimental
Ce2−xTi2O7 was prepared by the conventional sol–gel method as follows: 10 mL water was added to a mixture of 6.8 mL tetrabutyl titanate and 10 mL glacial acetic acid under strong stirring to obtain a clear Ti precursor solution. Ti precursor solution was taken and a rare earth nitrate solution (1.64 g) was added to the corresponding stoichiometry. About 3 mL of aqueous solution of citric acid (4 mol L−1) was finally added to the above mixture. As evaporation continued with stirring, the solution gradually precipitated and became a gel subsequently. The gel was dried at 120 °C for 12 h to obtain a foam-loose porous dry gel. The powder was ground and placed in the rover furnace for 2 h at 200 °C to remove the organic crosslinking, then raised to 400 °C in an air atmosphere and maintained for 2 h, and then 800 °C for 4 h, cooling with the furnace, grinding to be used.The room temperature X-ray powder diffraction (XRD) experiment was carried out on a Rigaku diffractometer with Cu Kα radiation (λ = 1.5406 Å). The step size was 0.01° and the scanning rate was 0.4° min−1. Temperature dependent XRD patterns were collected on a PANalytical diffractometer (Cu Kα, λ = 1.5406 Å) from 25 to 700 °C with a step size of 0.01° and a scanning rate of 4° min−1. In order to precisely control the temperature, the warming rate was set at 5 °C min−1, and the holding time was about 5 min at each temperature point. All the Rietveld refinements of the XRD data were performed on a FULLPROF package.21 The magnetization vs. applied magnetic field (M–H) curves were analyzed using the physical property measurement system (PPMS) (Quantum Design, Inc., USA) in 300–400 K. The warming rate was 5 °C min−1 and the maximum magnetic field was from −20 to 20 kOe. Thermogravimetric and differential thermal analysis (TG and DTA) were performed on a Rigaku TG-DTA 8122 under air at a heating rate of 5 °C min−1. Inductively coupled plasma mass spectrometry (ICP-MS) was performed on a PE Avio 2000.
Results and discussions
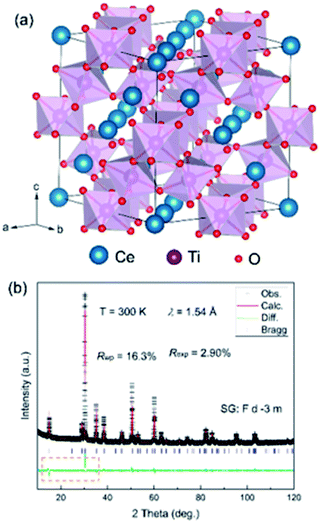
Fig. 1a shows the crystal structure with an ideal cubic symmetry (space group: Fd![[3 with combining macron]](https://www.rsc.org/images/entities/char_0033_0304.gif) m). There are four non-equivalent crystallographic sites: Ce (0,0,0), Ti (0.5,0.5,0.5), O (0.125,0.125,0.125) and O (x,0.125,0.125). Ti ions have the hexa-coordination of O and demonstrate a TiO6 octahedron. As shown in Fig. 1b, the as-prepared Ce–Ti–O sample is of good quality with negligible impurities. All the peak reflections are well indexed to those reported for pyrochlore Sm2Ti2O7.22 In addition, there are no noticeable Bragg peaks at low angles, which are usually considered to represent the chemical ordering of the defect ordering of Ce/O vacancy, which rule out the existence of a super structure in the as-prepared Ce–Ti–O samples. As the samples were thermally treated under air conditions, the XRD patterns demonstrated some excess oxygen in the as-prepared samples and the chemical formula approached that of the pyrochlore, Ce2Ti2O7.
m). There are four non-equivalent crystallographic sites: Ce (0,0,0), Ti (0.5,0.5,0.5), O (0.125,0.125,0.125) and O (x,0.125,0.125). Ti ions have the hexa-coordination of O and demonstrate a TiO6 octahedron. As shown in Fig. 1b, the as-prepared Ce–Ti–O sample is of good quality with negligible impurities. All the peak reflections are well indexed to those reported for pyrochlore Sm2Ti2O7.22 In addition, there are no noticeable Bragg peaks at low angles, which are usually considered to represent the chemical ordering of the defect ordering of Ce/O vacancy, which rule out the existence of a super structure in the as-prepared Ce–Ti–O samples. As the samples were thermally treated under air conditions, the XRD patterns demonstrated some excess oxygen in the as-prepared samples and the chemical formula approached that of the pyrochlore, Ce2Ti2O7.
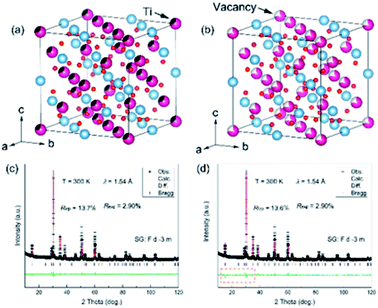
To better determine the crystal structure of the Ce–Ti–O sample, Rietveld refinement was carried out on the room temperature (RT) XRD pattern. All the Bragg angles of the peaks could be determined with the Fd![[3 with combining macron]](https://www.rsc.org/images/entities/char_0033_0304.gif) m structure, indicating a pyrochlore structure of Ce2Ti2O7. The lattice parameter a was found to be 10.2116(2) Å and the unit cell volume V was 1064.845(27) Å3. However, the calculated intensities showed obvious differences when compared with the experimental ones, which indicated that lattice distortions might be involved in the ideal structural model. As the occupation of oxygen could not be well detected by XRD, such large differences might be correlated to the defects of Ce and Ti. In this case, two models were proposed tentatively: one was the disordered anti-site defects of Ti for Ce and the other one was the disordered Ce vacancy (Fig. 2a and b). Intriguingly, the refinements of RT-XRD patterns were much better with these two models, and the reliability factors were almost the same (Fig. 2c and d). The Ce vacancy was determined to be near 18(1)% and the percentage of anti-site defects of Ti was near 28(1)%. This implies that the average electron concentration decreased at the Ce site. If there were Ti anti-site defects at Ce sites then Ti ions can show a mixed valence of Ti3+ (3d1) and Ti4+ (3d0) for Ce2−xTixTi2O7.
m structure, indicating a pyrochlore structure of Ce2Ti2O7. The lattice parameter a was found to be 10.2116(2) Å and the unit cell volume V was 1064.845(27) Å3. However, the calculated intensities showed obvious differences when compared with the experimental ones, which indicated that lattice distortions might be involved in the ideal structural model. As the occupation of oxygen could not be well detected by XRD, such large differences might be correlated to the defects of Ce and Ti. In this case, two models were proposed tentatively: one was the disordered anti-site defects of Ti for Ce and the other one was the disordered Ce vacancy (Fig. 2a and b). Intriguingly, the refinements of RT-XRD patterns were much better with these two models, and the reliability factors were almost the same (Fig. 2c and d). The Ce vacancy was determined to be near 18(1)% and the percentage of anti-site defects of Ti was near 28(1)%. This implies that the average electron concentration decreased at the Ce site. If there were Ti anti-site defects at Ce sites then Ti ions can show a mixed valence of Ti3+ (3d1) and Ti4+ (3d0) for Ce2−xTixTi2O7.
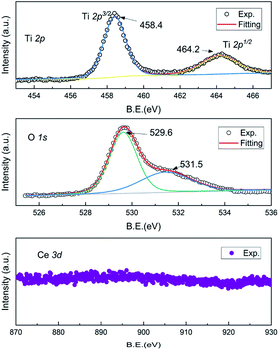
As shown in Fig. 3, X-ray photoelectron spectroscopy (XPS) patterns were investigated to shed light on the valences of Ce, Ti and O ions of the as-prepared Ce–Ti–O pyrochlore. They showed that the Ti 2p spectrum included 2p3/2 and the 2p1/2 doublet separated by a distance of about 5.8 eV.23 No other low valence peak emerged in the XPS spectrum. Such a doublet was well consistent with the Ti4+ ions of other titanate-based perovskites. In this case, Ce vacancy should be taken into consideration. The effective composition investigated by the inductively coupled plasma mass spectrometry (ICP-MS) was as follows: Ce![[thin space (1/6-em)]](https://www.rsc.org/images/entities/char_2009.gif) :
:![[thin space (1/6-em)]](https://www.rsc.org/images/entities/char_2009.gif) Ti = 0.7(1)
Ti = 0.7(1)![[thin space (1/6-em)]](https://www.rsc.org/images/entities/char_2009.gif) :
:![[thin space (1/6-em)]](https://www.rsc.org/images/entities/char_2009.gif) 1.1(1), which was near that determined by the Rietveld refinements of Ce
1.1(1), which was near that determined by the Rietveld refinements of Ce![[thin space (1/6-em)]](https://www.rsc.org/images/entities/char_2009.gif) :
:![[thin space (1/6-em)]](https://www.rsc.org/images/entities/char_2009.gif) Ti = 0.88
Ti = 0.88![[thin space (1/6-em)]](https://www.rsc.org/images/entities/char_2009.gif) :
:![[thin space (1/6-em)]](https://www.rsc.org/images/entities/char_2009.gif) 1. The main peak of O 1s located at 529.6 eV corresponded to the oxygen lattice of Ce-oxides, and another shoulder was observed near 531.5 eV.24,25 This peak might be entangled in the unusual coordination due to the Ce vacancy. To balance the total valence, the valence transition from Ce3+ to Ce4+ should exist in the as-prepared Ce2−xTi2O7. Thereby, the oxygen defects would appear. The signal of Ce ions was very weak in the XPS spectrum, and the real valence was difficult to extract. This also supported that the valence of the Ce ion was complicated, and the electronic structure became obscure in the cubic symmetry.
1. The main peak of O 1s located at 529.6 eV corresponded to the oxygen lattice of Ce-oxides, and another shoulder was observed near 531.5 eV.24,25 This peak might be entangled in the unusual coordination due to the Ce vacancy. To balance the total valence, the valence transition from Ce3+ to Ce4+ should exist in the as-prepared Ce2−xTi2O7. Thereby, the oxygen defects would appear. The signal of Ce ions was very weak in the XPS spectrum, and the real valence was difficult to extract. This also supported that the valence of the Ce ion was complicated, and the electronic structure became obscure in the cubic symmetry.
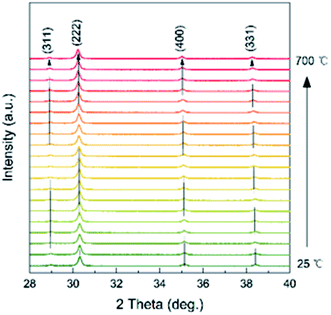
Temperature dependence of the XRD of the as-prepared Ce2−xTi2O7 was studied to analyze the structural transition and phase stability with respect to temperature. As shown in Fig. 4, the peak reflections are of good quality at each temperature. The peak intensity shows a slight difference, and there is no obvious change in the background, which indicates that the samples are well crystalline and did not become amorphous upon heating up to 700 °C. As shown in Fig. 5, the as-prepared Ce2−xTi2O7 sample shows good thermal stability. Although the thermogravimetric and differential thermal analysis (TG and DTA) showed that there was a slight difference near 450 °C, the change was very small and it might be involved in the transformation of the local structure.
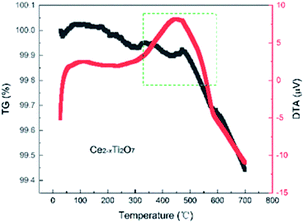 | ||
| Fig. 5 Thermogravimetric and differential thermal analysis (TG and DTA) of the as-prepared Ce2−xTi2O7 under air at a heating rate of 5 °C min−1. | ||
In addition, there was a negligible change in the shape of the peaks, and no other new peak reflections emerged from 25 to 700 °C. The cubic phase was stable, and no phase transition was thus observed. It should be noted that the high-temperature XRD experiments were performed under air conditions and thus the oxygen concentration was almost saturated for the as-prepared samples. This was consistent with the XPS spectrum of O ions. Although the peak position distinctly moved toward low angles with temperature, it was conventionally attributed to the change in the lattice parameters upon heating. To better observe the structural change, Rietveld refinements were conducted on all the XRD patterns, as shown in Fig. 6.
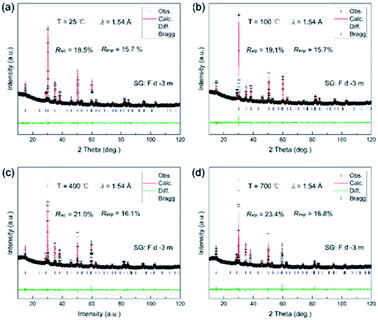 | ||
| Fig. 6 Rietveld refinements of the XRD patterns of Ce2−xTi2O7 at (a) 25 °C, (b) 100 °C, (c) 400 °C and (d) 700 °C. | ||
All the XRD patterns can be well refined using the cubic structural model with Ce vacancy. Fig. 6b shows the refined profile at 100 °C to confirm whether the sample is hydrated. It is clearly observed that the XRD patterns are well refined and similar to that of the RT patterns. Temperature dependence of the lattice parameter a and the unit cell volume V is shown in Fig. 7. The comparison of lattice parameters also indicate that there is no anomaly near 100 °C (boiling point of water), well consistent with the TG and DTA curves. The positive thermal expansion (PTE) behaviors were distinctly observed along the a-direction upon heating with an average coefficient of thermal expansion (CTE) of about 11.2 × 10⁻⁶ K−1 (25–700 °C). The CTE of the unit cell volume is 3 times as large as that of the a-axis, 33.8 × 10⁻⁶ K−1 (25–700 °C). As the lattice expanded on heating, the interplanar spacing increased and the Bragg angles of the peaks moved accordingly to the low regions.
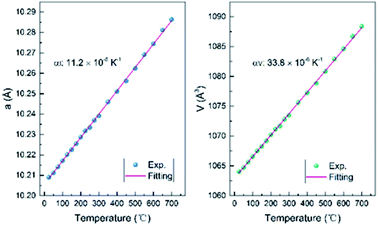 | ||
| Fig. 7 Temperature dependence of the lattice parameter a and the unit cell volume V from 25 to 700 °C for Ce2−xTi2O7. | ||
Fig. 8 shows the magnetization vs. applied magnetic field (M–H) curves from −20 kOe to 20 kOe for the as-prepared Ce2−xTi2O7 sample. It is observed that the magnetization increases monotonously with the application of the magnetic field. In the high-field region, the curve exhibits paramagnetic-like linear profiles up to 20 kOe. However, in the lower-field region, the curve shows slight bends near 500 Oe and a hysteresis loop is observed (inset of Fig. 8). This indicates that the magnetic state of Ce2−xTi2O7 is not simply paramagnetic. They might be ferromagnetic or ferrimagnetic at this temperature. As shown in the structural analysis above, Ti3+ (3d1) can be ruled out to drive magnetization and Ti4+ (3d0) is in a diamagnetic state. If Ti3+ made contributions to the magnetization, it might favor the antiferromagnetic state due to the super exchange interaction among Ti–O–Ti.26,27 Thus, the magnetization shown here is mainly derived from Ce ions. This implies that there were unpaired 4f electrons of Ce ions, e.g. Ce3+.
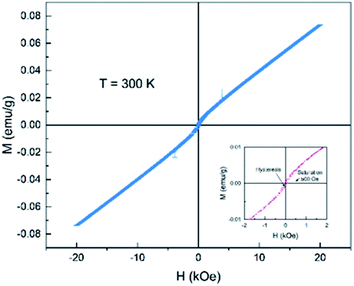 | ||
| Fig. 8 Magnetization vs. applied magnetic field (M–H) curve of Ce2−xTi2O7 measured at 300 K. The inset shows the enlarged area from −2 kOe to 2 kOe. | ||
The Ce vacancy brought about the imbalance of the total valence state of Ce2−xTi2O7, which is compensated by the transformation of the valence of Ce ions from +3 to +4. The double exchange interaction emerges as the valence of Ce4+ transforms to Ce3+ by virtue of O2−, which might be easier to occur on the surface with more oxygen defects. As a result, the RT ferromagnetism was observed, similar to that documented for the CeO2 nanoparticles.28,29 Interestingly, this weak magnetic state was thermally stable and could persist up to 400 K (Fig. 9). It should be noticed that such high-temperature magnetism was rare in cerium titanates, which indicated the potential electromagnetic applications in the future.
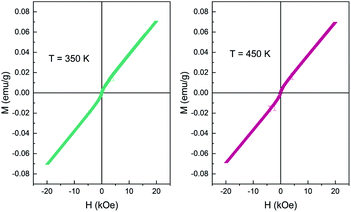 | ||
| Fig. 9 Magnetization vs. applied magnetic field (M–H) curve of Ce2−xTi2O7 measured at 350 K and 400 K. | ||
Conclusion
In summary, a cubic Ce2−xTi2O7 pyrochlore was successfully prepared via a sol–gel method. The crystal structure, thermal stability and magnetic properties were systematically investigated via the temperature dependence of XRD experiments, XPS spectrum and magnetization measurements. It revealed that the as-prepared Ce2−xTi2O7 possessed a cubic symmetry (space group: Fd![[3 with combining macron]](https://www.rsc.org/images/entities/char_0033_0304.gif) m); however, there was an 18(1)% vacancy of Ce ions in the as-prepared samples. Neither the distinct phase transition nor the thermal expansion anomaly was observed in the investigated temperature. Intriguingly, the lattice defects may favor the transformation of the Ce valence from +3 to +4, and an unusual weak magnetic ordering state emerged up to 400 K.
m); however, there was an 18(1)% vacancy of Ce ions in the as-prepared samples. Neither the distinct phase transition nor the thermal expansion anomaly was observed in the investigated temperature. Intriguingly, the lattice defects may favor the transformation of the Ce valence from +3 to +4, and an unusual weak magnetic ordering state emerged up to 400 K.
Conflicts of interest
There are no conflicts to declare.Acknowledgements
This study was financially supported by the Fundamental Research Funds for the Central Universities of China (no. FRF-BR-20-03B) and the National Key R&D Program of China (no. 2017YFF0106006).Notes and references
- A. Aguadero, D. Pérez-Coll, C. De la Calle, J. Alonso, M. Escudero and L. Daza, J. Power Sources, 2009, 192, 132–137 CrossRef CAS.
- M. S. Islam, J. Mater. Chem., 2000, 10, 1027–1038 RSC.
- I. Grinberg, D. V. West, M. Torres, G. Gou, D. M. Stein, L. Wu, G. Chen, E. M. Gallo, A. R. Akbashev and P. K. Davies, Nature, 2013, 503, 509–512 CrossRef CAS PubMed.
- V. Pardo and W. E. Pickett, Phys. Rev. B: Condens. Matter Mater. Phys., 2009, 80, 054415 CrossRef.
- R. Voorhoeve, D. Johnson, J. Remeika and P. Gallagher, Science, 1977, 195, 827–833 CrossRef CAS PubMed.
- H. Zhu, P. Zhang and S. Dai, ACS Catal., 2015, 5, 6370–6385 CrossRef CAS.
- S. Ishiwata, M. Azuma, M. Takano, E. Nishibori, M. Takata, M. Sakata and K. Kato, J. Mater. Chem., 2002, 12, 3733–3737 RSC.
- M. Azuma, S. Carlsson, J. Rodgers, M. G. Tucker, M. Tsujimoto, S. Ishiwata, S. Isoda, Y. Shimakawa, M. Takano and J. P. Attfield, J. Am. Chem. Soc., 2007, 129, 14433–14436 CrossRef CAS PubMed.
- P. Moon and H. Tuller, Solid State Ionics, 1988, 28, 470–474 CrossRef.
- A. K. Gupta, G. Arora, D. S. Aidhy and S. Ritesh, ACS Appl. Mater. Interfaces, 2020, 12, 45558–45563 CrossRef CAS PubMed.
- P. H. T. Ngamou and N. Bahlawane, Chem. Mater., 2010, 22, 4158–4165 CrossRef CAS.
- X. Li and H. Gao, RSC Adv., 2018, 8, 11778–11784 RSC.
- M. Baldini, T. Muramatsu, M. Sherafati, H.-k. Mao, L. Malavasi, P. Postorino, S. Satpathy and V. V. Struzhkin, Proc. Natl. Acad. Sci. U. S. A., 2015, 112, 10869–10872 CrossRef CAS PubMed.
- R. Mahendiran, S. Tiwary, A. Raychaudhuri, T. Ramakrishnan, R. Mahesh, N. Rangavittal and C. Rao, Phys. Rev. B: Condens. Matter Mater. Phys., 1996, 53, 3348 CrossRef CAS PubMed.
- C. Rao and A. Cheetham, Science, 1996, 272, 369–370 CrossRef CAS.
- C. Ritter, M. Ibarra, J. De Teresa, P. Algarabel, C. Marquina, J. Blasco, J. Garcia, S. Oseroff and S. Cheong, Phys. Rev. B: Condens. Matter Mater. Phys., 1997, 56, 8902 CrossRef CAS.
- H. Hwang, S. Cheong, P. Radaelli, M. Marezio and B. Batlogg, Phys. Rev. Lett., 1995, 75, 914 CrossRef CAS PubMed.
- A. Barnabe, F. Millange, A. Maignan, M. Hervieu, B. Raveau, G. Van Tendeloo and P. Laffez, Chem. Mater., 1998, 10, 252–259 CrossRef CAS.
- G. Ma, Y. Liu, J. Yang, Q. Xie and H. He, J. Am. Ceram. Soc., 2015, 98, 3930–3934 CrossRef.
- J. Goral and J. Greedan, J. Magn. Magn. Mater., 1983, 37, 315–321 CrossRef.
- J. Rodríguez-Carvajal, CEA/Saclay, France, 2001 Search PubMed.
- M. Rabanal, A. Várez, U. Amador, E. A. y. Dompablo and F. García-Alvarado, J. Mater. Process. Technol., 1999, 92, 529–533 CrossRef.
- C. Lu, A. Kuang and G. Huang, J. Appl. Phys., 1996, 80, 202–206 CrossRef CAS.
- D. Chen, D. He, J. Lu, L. Zhong, F. Liu, J. Liu, J. Yu, G. Wan, S. He and Y. Luo, Appl. Catal., B, 2017, 218, 249–259 CrossRef CAS.
- K. Wang, Y. Chang, L. Lv and Y. Long, Appl. Surf. Sci., 2015, 351, 164–168 CrossRef CAS.
- J. Garcia-Barriocanal, J. Cezar, F. Y. Bruno, P. Thakur, N. Brookes, C. Utfeld, A. Rivera-Calzada, S. Giblin, J. Taylor and J. Duffy, Nat. Commun., 2010, 1, 1–7 Search PubMed.
- L. Errico, M. Rentería and M. Weissmann, Phys. Rev. B: Condens. Matter Mater. Phys., 2005, 72, 184425 CrossRef.
- V. Fernandes, P. Schio, A. De Oliveira, W. Ortiz, P. Fichtner, L. Amaral, I. Graff, J. Varalda, N. Mattoso and W. Schreiner, J. Phys.: Condens. Matter, 2010, 22, 216004 CrossRef CAS PubMed.
- Y. Liu, Z. Lockman, A. Aziz and J. MacManus-Driscoll, J. Phys.: Condens. Matter, 2008, 20, 165201 CrossRef.
| This journal is © The Royal Society of Chemistry 2022 |

