 Open Access Article
Creative Commons Attribution 3.0 Unported Licence
Study of the microstructure of chitosan aerogel beads prepared by supercritical CO2 drying and the effect of long-term storage
Chun-gong Li,
Qi Dang,
Qinqin Yang,
Dong Chen,
Hongliang Zhu,
Jiachen Chen,
Runjin Liu and
Xiang Wang *
*
Key Laboratory of Biorheological Science and Technology, Ministry of Education, College of Bioengineering, Chongqing University, Chongqing 400044, PR China. E-mail: xwangchn@vip.sina.com
First published on 21st July 2022
Abstract
In order to investigate the pore properties and effect of storage time on the microstructure of CO2-dried aerogels, chitosan aerogel beads were obtained from chitosan hydrogels with an initial concentration in the range of 1.5–3.0 wt% through SCCO2 drying and freeze-drying (as a comparison). The SCCO2-dried chitosan aerogels showed a three-dimensional network structure, and had higher BET surface area (200 m2 g−1) and higher crystallinity (0.62/XRD, 0.80/ATR-FTIR) than the freeze-dried aerogels. The stability of the microstructure of the SCCO2-dried chitosan aerogel beads during 10 months was studied. The BET surface area of the aerogel beads at each concentration declined by 30.5% at 2 months, 56.7% at 6 months and 67.2% at 10 months. Accelerated aging tests of the chitosan aerogel beads were carried out to study the effect of humidity on the chitosan aerogel beads. The average diameter of the chitosan aerogel decreased from 2.3 mm to 0.9 mm when stored at 65 °C with 90% relative humidity (RH). In contrast, there was no obvious change during storage at 65 °C with 20% RH. The amount of adsorbed water increased from 4% to 12% at 65 °C with 90% RH for 96 h, and the bound water content of the aerogel beads gradually increased. This study demonstrates that SCCO2-dried chitosan aerogel beads could be better at maintaining their mesoporous structure, and the adsorption of water from the surrounding air had a significant effect on the microstructure and shrinkage of the chitosan aerogel beads.
Introduction
Aerogels are highly porous and sponge-like solid materials with high specific surface areas, ultralow thermal conductivities and extremely low densities.1,2 During the last decade(s), aerogels produced from biopolymers have attracted increasing interest not only due to the wide applications of porous functional materials but also due to the dream of renewable and sustainable feedstock.3,4 Chitosan, the second-most abundant and the only cationic biopolymer in nature,3 has become a hot topic in academic research due to its outstanding properties, such as biocompatibility,5 biodegradability,6 non-toxicity,7 antioxidant activity8 and antibacterial activity.9 Besides, chitosan has various chemical functional groups containing amino (–NH2) and hydroxyl (–OH) moieties, which is beneficial to the formation of aerogels via covalent crosslinks between –NH2 groups or hydrogen bonding and the entanglement of chains stimulated by pH changes or antisolvents.10 Therefore, there are a variety of potential applications for chitosan aerogels, including drug delivery systems,11 thermal and acoustic insulation,12 catalysis,13 sensing,14 CO2 capture,15 water purification,16 and hemoperfusion.17The formation of chitosan aerogels usually goes through the following stages: chitosan dissolution, gelation and formation of the hydrogel, solvent exchange and solvent removal by a drying method.3 It has been confirmed that the preparation steps of the gel determine the formation of the porous framework, in which drying is the pivotal step to transform the wet gel into a porous solid. Supercritical drying is one of the widely used drying methods to produce aerogels, which involves crossing the critical point of the solvent by increasing the temperature and pressure, minimizing the damage to the microstructure (microporous structure) caused by the surface tension of the solvent.12 Supercritical carbon dioxide (SCCO2) is by far the most common solvent due to its appropriate conditions of critical pressure and temperature (31 °C, 7.38 MPa), which can prevent the degradation of the biopolymers.4 Freeze-drying is another common method to prepare aerogels, which involves crossing the liquid–gas phase boundary by freezing, with the ice crystals acting as templates of the pores,3 in which the size of ice crystals is directly related to the freezing speed, affecting the microstructure of the obtained aerogels. Ciftci et al. prepared lupin hull cellulose nanofiber aerogels by slow freeze-drying with a regular freezer and fast freeze-drying with liquid nitrogen or SCCO2 drying, and the results demonstrate that the SCCO2 drying method led to a 3D nanoporous network structure with a lower density and higher specific surface area and porosity compared with freeze-drying.18 Similar results have been found with other biological macromolecular aerogels, such as alginate19 and pectin.20 Therefore, it is necessary to investigate the microstructure of chitosan aerogels prepared by different drying methods.
After the formation of aerogels, they might have to undergo long-term storage in some actual applications; hence, it is critical for their further application to explore the changes in aerogel properties with storage time, which is easily overlooked in the application of biopolymer aerogels. It has been reported that the optical, barrier and mechanical properties have significant changes with the storage time of chitosan films, which involves the rearrangement of polymer chains during storage.21 The specific surface area under storage of alginate aerogels prepared with SCCO2 decreased obviously after 3 months.19 However, not much attention has been paid to the effect of storage time on the properties of chitosan aerogels, especially on their microstructure.
In this study, chitosan hydrogel beads were prepared with different initial concentrations of chitosan in the range of 1.5 wt% to 3 wt%, and were then dried by SCCO2 drying, fast freeze-drying and slow freeze-drying methods to obtain aerogel beads. In addition, the morphology, BET surface area and crystallization of the chitosan aerogel beads were evaluated by SEM, BET analysis, XRD and ATR-FTIR spectroscopy. Furthermore, the pore size distribution and BET surface area of SCCO2-dried chitosan aerogel beads were investigated after storage at room temperature in a sealed vessel for 10 months to evaluate the effect of storage time on the microstructure of SCCO2-dried aerogels, which provided adequate proof for further applications.
Experimental section
Materials
Chitosan (viscosity: 100–200 mPa s−1) with a deacetylation degree above 95.0% was purchased from Aladdin Reagent Co., Ltd. (Shanghai, China). Ethyl alcohol (AR), acetate acid (AR), sodium hydroxide (NaOH, AR) and normal saline were supplied by Chuandong Co., Ltd. (Chongqing, China).Preparation of chitosan hydrogel beads
The synthetic procedures of the chitosan aerogel beads are shown in Fig. 1. The chitosan reagent was proportionately dissolved in a 1% (v/v) acetic acid solution to obtain 1.5 wt%, 2.0 wt%, 2.5 wt%, and 3 wt% chitosan solutions at room temperature, and the bubbles in the sol were removed by vacuum degassing. The obtained chitosan sol was then dipped into a 0.2 M NaOH solution using a constant current pump with stirring to produce chitosan hydrogel beads. After setting for 2 h, the chitosan hydrogel beads were washed with deionized water until neutral pH for the next step of drying to produce the aerogel beads.Preparation of chitosan aerogel beads by SCCO2 drying
The chitosan hydrogel beads were soaked in 30%, 50%, 70%, and 100% (v/v) ethanol for 1 h and set in 100% ethanol for 24 h to make sure that the water in the chitosan hydrogel beads was completely replaced with ethanol. Then, SCCO2 drying was used to remove the ethanol from the alcogels, which was carried out using a Leica EM CPD300 Critical Point Dryer (Leica, Germany). Specifically, the chitosan alcogel beads were placed into the pressure vessel and sealed after being added to an excess amount of ethanol (40 mL). Then, the temperature of the pressure vessel was cooled from room temperature (25 °C) to the set temperature (15 °C), and the pressure was increased to 50 bar by flowing CO2 into the pressure vessel. After that, ethanol was extracted via CO2 circulation for 15 cycles at 50 bar for 1 h. Finally, the temperature was increased to 35 °C and the pressure vessel was depressurized to atmospheric pressure to obtain the SCCO2-dried aerogel beads. The chitosan aerogel beads were collected from the pressure vessel and stored in a hermetic glass vessel at room temperature for further characterization.Preparation of aerogel beads by freeze-drying
Before the freeze-drying process, chitosan hydrogel beads were placed in a vessel and frozen by fast freezing with an excess amount of liquid nitrogen in a short time or by slow freezing with a regular freezer at −18 °C for 24 h. After that, the frozen chitosan hydrogel beads were transferred to a freeze dryer and sublimated at −60 °C and 15 Pa for 48 h to obtain fast freeze-dried aerogel beads and slow freeze-dried aerogel beads. Finally, the chitosan aerogel beads were kept in a hermetic glass vessel at room temperature for further analysis.Storage of the SCCO2-dried aerogel beads
A known amount of SCCO2-dried aerogel beads at different concentrations were placed in hermetic glass vessels. All samples were stored in the dark at room temperature (average 24 °C and 60% relative humidity) and were sampled for analysis after storage for 2 months, 6 months and 10 months.Accelerated aging test
Accelerated aging tests of the chitosan aerogel beads were carried out to study the effect of humidity on the aerogel beads. 3 wt% aerogel beads were stored at 65 °C and 90% relative humidity or 65 °C and 20% relative humidity. Then, the average diameters of aerogel beads stored for 0.5 h, 1 h, 2 h, 3 h, 12 h, 24 h and 96 h were measured, and the corresponding aerogel beads were sampled for thermogravimetric (TG) analysis.Characterization
The morphologies of the chitosan aerogel beads were observed by scanning electron microscopy (SEM, Zeiss EVO18) after coating with gold. The specific surface area, pore volume and pore size of the chitosan aerogel beads were characterized by Brunauer–Emmett–Teller (BET) measurement and Barrett–Joyner–Halenda (BJH) measurement using a surface area analyzer (Quadrasorb 2 MP, Quantachrome Instruments, USA). The crystallinity of the chitosan aerogel beads was determined using either an XRD diffractometer (Empyrean, Spectris Pte. Ltd, Netherlands) or a Fourier-transform attenuated total reflection infrared (ATR-FTIR) spectrometer (Nicolet iN10, Thermo, US). The XRD patterns were measured in the region of 2θ = 5°–45° at a scanning speed of 10° min−1 with Cu Kα radiation at 40 kV and 40 mA. The crystallinity indices (CrI) of the chitosan aerogel beads and the chitosan reagent were determined by XRD using the following equation:
 | (1) |
Results and discussion
Morphology
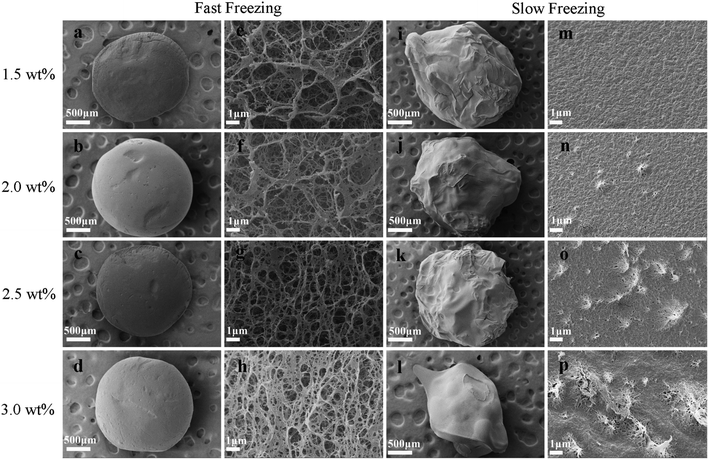
In summary, the drying methods had significant effects on the pore structure of the chitosan aerogels. Compared with the slow freeze-dried aerogel beads, the SCCO2-dried and fast freeze-dried aerogel beads exhibited porous structures with a spherical shape. Although porous structures were displayed in both the SCCO2-dried and fast freeze-dried chitosan aerogel beads, the fast freeze-dried aerogels presented more macroporous structures than the SCCO2-dried aerogels. Besides, the SCCO2-dried aerogels showed three-dimensional pore structures, while the fast freeze-dried aerogels presented mostly two-dimensional sheet-like pore structures. However, these analyses are only based on a subjective visual evaluation of the SEM images; hence, it is necessary to further study the properties of the chitosan aerogels prepared by SCCO2 drying and fast freeze-drying.
Characterization of the chitosan aerogels
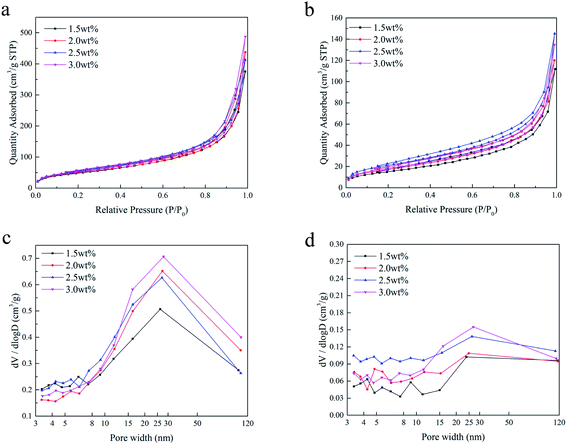
Fig. 4 shows the nitrogen adsorption/desorption isotherms and the corresponding pore size distributions of the SCCO2-dried aerogels and fast freeze-dried aerogels. As shown in Fig. 4a and b, a hysteresis loop occurred on the desorption isotherm, indicating that the mesopores and macropores within the aerogel beads prepared by the SCCO2 drying and fast freeze-drying methods were dominant at a relatively high pressure. In addition, the BET surface area calculated by the adsorption/desorption isotherms ([0.08–0.3]p/p0, σN2 = 0.162 nm2) and the pore volume analyzed by the Barrett–Joyner–Halenda (BJH) method are shown in Table 1. The BET surface area and BJH pore volume of the SCCO2-dried aerogel beads were higher than those of the freeze-dried aerogel beads at each concentration level, indicating that SCCO2 drying could maintain the pore structure better during the formation of aerogels, which could avoid the collapse within the small pores caused by liquid–gas surface tension and liquid–solid adhesive forces.4 The BET surface area of the slow-dried aerogels was too low and was close to the detection limit of the N2 adsorption–desorption equipment; thus, it was not significant to compare the difference between the different concentrations, indirectly reflecting the poor pores maintained in the slow-dried aerogels. In addition, it is interesting that the aerogel beads prepared by the SCCO2 drying and freeze-drying methods both had the largest BET surface area at a concentration of 2.5 wt%, which might be attributed to the hydrogen bonding interactions reaching their threshold, leading to a decline in the BET surface area.25 A similar trend had been reported in other studies.26| Property | SCCO2-dried | Fast freeze-dried | Slow freeze-dried | |||||||||
|---|---|---|---|---|---|---|---|---|---|---|---|---|
| 1.5 wt% | 2 wt% | 2.5 wt% | 3 wt% | 1.5 wt% | 2 wt% | 2.5 wt% | 3 wt% | 1.5 wt% | 2 wt% | 2.5 wt% | 3 wt% | |
| BET surface area (m2 g−1) | 179 | 183 | 200 | 195 | 56 | 63 | 78 | 69 | 2.9 | 1.4 | 0.5 | 1.6 |
| BJH pore volume (cm3 g−1) | 0.544 | 0.64 | 0.603 | 0.715 | 0.108 | 0.129 | 0.204 | 0.178 | 0.021 | 0.008 | 0.012 | 0.003 |
Furthermore, it can be found from Fig. 4c and d that the pore size distributions of the SCCO2-dried aerogels and fast freeze-dried aerogels are not limited to mesopores (2–50 nm) and clearly trespass into the domain of macroporosity (>50 nm), in which the pore size distribution of the SCCO2-dried chitosan aerogels was more concentrated in 20–40 nm, while the fast freeze-dried aerogels were more dispersed. This result is consistent with the results observed by SEM and demonstrates that although freeze-drying could maintain the porosity of gels, ice crystals destroyed the skeletal structure of the gel, generally resulting in more macroporous sheet-like structures, and the CO2 supercritical fluid replaced ice crystals that acted as templates of the pores, thereby avoiding the occurrence of the above phenomenon, ultimately obtaining more mesoporous structures.
Crystallinity
The crystallinity is related to the mechanical properties, thermal stability and permeability of materials. In order to evaluate the impact of the two drying methods on the crystal structures of the aerogel beads, the XRD patterns and ATR-FTIR spectra were recorded.In generally, the XRD patterns included the crystalline regions and amorphous regions of chitosan.27 Fig. 5a shows a comparison between the X-ray diffraction patterns of the chitosan reagent and aerogel beads. For both the aerogel beads dried by SCCO2 drying or fast freeze-drying, a new peak at 2θ = 10°–11° appeared compared with the chitosan reagent, which could be contributed by the crystal-I of the crystalline regions of the chitosan molecules.28 Meanwhile, the characteristic peaks of the chitosan reagent at 2θ = 20°–21° were observed, and the peaks at 2θ = 20°–21° of the chitosan reagent became much more broad than those of the aerogel beads, which could be attributed to the amorphous structure of the chitosan reagent,29 indicating that the original chitosan chain has been reorganized during the formation of the aerogels.30 As is well known, the crystallinity index (CrI) reflects the regular pattern of the aggregation state for polymer chains and the CrI of the chitosan aerogel beads and reagent were calculated following the strategy of Focher et al.31 It was noted that the CrI followed the order: SCCO2 drying (CrI = 0.62) > freeze-drying (CrI = 0.47) > chitosan reagent (CrI = 0.38). Furthermore, compared to the chitosan reagent, the XRD spectra of the SCCO2-dried and fast freeze-dried aerogel beads in the 20°–30° range were smoother, which might be related to the higher regularity of the aggregation of the polymer chains in the SCCO2-dried and fast freeze-dried aerogel beads. These results indicate that: (i) SCCO2 drying and freeze-drying significantly affect the XRD patterns and relative crystallinity of chitosan; (ii) the SCCO2-dried aerogels might be more homogeneous than the freeze-dried aerogels due to their higher CrI. Similar results have been obtained for other polysaccharides.32
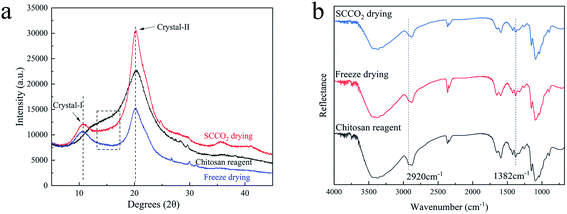 | ||
| Fig. 5 XRD patterns (a) and ATR-FTIR spectra (b) of the chitosan reagent and chitosan aerogels prepared by SCCO2 drying and fast freeze-drying. | ||
The ATR-FTIR spectra of the chitosan aerogels were compared with those of the chitosan reagent, as shown in Fig. 5b. Although the positions of the peaks in the ATR-FTIR spectra of all the samples were the same, the adsorption strength was slightly different, for which the ratio of absorbance at A1382 cm−1/A2920 cm−1 could be used to evaluate the CrI of the aerogel samples and the chitosan reagent.22,31 In addition, the CrI followed the order: SCCO2 drying (CrI = 0.80) > freeze-drying (CrI = 0.77) > chitosan reagent (CrI = 0.69). The variation trend of CrI was consistent with that of the XRD determinations. Furthermore, all peaks in the ATR-FTIR spectra of the SCCO2-dried aerogels and fast-dried aerogels became more sharp than those of the chitosan reagent, probably associated with the more consistent hydrogen bonding environments between the functional groups of –NH2, –OH, and C![[double bond, length as m-dash]](https://www.rsc.org/images/entities/char_e001.gif) O in the aerogel samples,10 especially obvious in the ATR-FTIR spectra of the SCCO2-dried aerogels.
O in the aerogel samples,10 especially obvious in the ATR-FTIR spectra of the SCCO2-dried aerogels.
Effect of storage on the morphology and microstructure of the SCCO2-dried aerogels
Fig. 6 shows the SEM images of the SCCO2-dried aerogels after storage for 0 and 6 months. It can be observed from Fig. 6a–h that the diameters of the chitosan aerogel beads at each initial concentration level decreased after storage for 6 months, implying that the internal structure collapsed during storage. Furthermore, it can be found from the high-magnification images (Fig. 6i–p) that the nanofiber-like chitosan chains of the aerogels showed obvious aggregation after storage for 6 months, resulting in the thin and uniform chitosan fiber bundles becoming thicker over time, which might be attributed to the continuous collapse of chitosan fibers caused by hydrogen bonding interactions between the nanofibers during storage. This suggests that physical coagulation can not only occur in the stage of CO2 supercritical drying to form nanofiber-like structures but can continue to occur slowly during subsequent storage. | ||
| Fig. 6 Morphologies of the SCCO2-dried aerogel beads after storage for 0 and 6 months: appearance (0 month, (a–d) and 6 months, (e–h)) and surface (0 month, (i–l) and 6 months, (m–p)). | ||
Fig. 7 shows the adsorption/desorption isotherms and the corresponding pore size distribution of the SCCO2-dried chitosan aerogel beads at different concentrations ranging from 1.5 to 3.0 wt% after storage. It can be observed from Fig. 7a–d that all samples present a curve along with a hysteresis loop related to the existence of mesopores. Under moderate relative pressure (P/P0), the adsorption capacity of all aerogel beads gradually decreases as the storage time increases, which indicates that mesopores are decreasing.
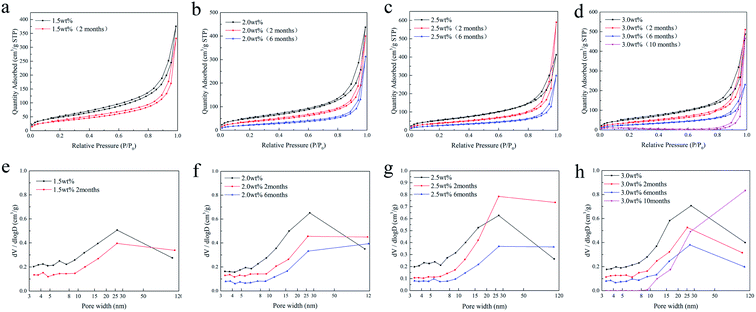 | ||
| Fig. 7 N2 adsorption/desorption isotherms (a–d) and the pore size distributions (e–h) of the SCCO2-dried chitosan aerogels at different concentrations. | ||
Furthermore, Fig. 7e–h show that the BJH pore volume of the chitosan aerogel beads decreased with storage time, suggesting the shrinkage and skeletal collapse of the aerogels. Specifically, the BJH pore volume of the smaller mesopores (<25 nm) of the aerogel beads at each concentration declined faster than the larger mesopores (>25 nm), in which the smaller mesopores (<10 nm) of 3 wt% beads disappeared after storage for 10 months.
Besides, the BET surface area and density of the chitosan aerogel beads at each concentration during storage were calculated, and are shown in Fig. 8. It is obvious that the BET surface area of all samples decreased over time (Fig. 8a), in which the BET surface area of the chitosan aerogel beads presented a declining rate of 30.5% at 2 months, 56.7% at 6 months and 67.2% at 10 months, which might be due to the disappearance of mesopores and the increment of macropores caused by physical coagulation, and similar results have been shown for other polysaccharides.19 Although the BET surface area of the SCCO2-dried aerogels decreased after storage for 6 months, it was still higher than that of the freeze-dried aerogels. Meanwhile, as shown in Fig. 8b, the density of the chitosan aerogel beads at each concentration increased after 6 months of storage due to the decrease in diameter over time.
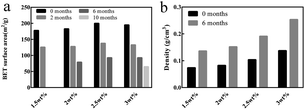 | ||
| Fig. 8 BET surface area (a) and density (b) of the chitosan aerogel beads (SCCO2-dried) at different concentrations after storage. | ||
To further evaluate the effect of the adsorption of water from the surrounding air on the properties of the aerogel beads, accelerated aging tests of the chitosan aerogel beads were performed at a relatively high temperature and high humidity. As shown in Fig. 9a, the average diameter of the chitosan aerogel beads decreased rapidly within 24 h and then gradually tended to equilibrium when stored at 65 °C with a relative humidity of 90%. In contrast, there were no obviously changes in the average diameter of the aerogel beads during storage at 65 °C with a relative humidity of 20%. These results indicate that the high relative humidity was more likely to cause the shrinkage of the chitosan aerogel beads and was not conducive to the preservation of the chitosan aerogels, which might be attributed to the humidity uptake of aerogels during storage caused by the hydrophilic backbone and high specific area of the chitosan aerogel beads. TG analyses were performed to evaluate the amount of humidity uptake. As shown in Fig. 9b, the loss ratio of the untreated aerogel beads in weight was about 5%, and increased to about 12% after storage at 65 °C with 90% RH for 96 h. In contrast, the weight loss rate of the aerogel beads when stored at 65 °C with 20% RH for 96 h decreased to about 4%, which was probably due to the relatively low humidity. In addition, the weight loss at 30 °C to 200 °C was mostly due to moisture removal.26 These results prove the humidity uptake during storage at high relative humidity. Moreover, the water weight loss of the untreated aerogel beads occurred mainly in the range of 30 °C to 100 °C, but the water weight loss of the aerogel beads stored at 65 °C with 90% RH was in the range of 30 °C to 200 °C, which implied that the bound water content of the aerogel beads gradually increased. Higher humidity caused the increment of bound water on the surface of the chitosan fibers, which resulted in an increase in the interaction force between the chitosan fibers, finally leading to shrinkage of the chitosan aerogel beads.33 These results suggest that hydrogen bonding cross-linking between the chitosan fibers mediated by bound water causes excessive physical coagulation of the chains in the chitosan aerogels, resulting in the disappearance of smaller mesopores (<10 nm), and ultimately leading to a decrease in the BET surface area, which is shown in Fig. 10. Therefore, when chitosan aerogels are stored for a long time, the removal of bound water on the surface of the chitosan fibers and maintaining a strict dry environment are necessary.
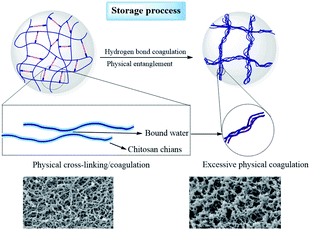 | ||
| Fig. 10 Proposed mechanisms for the changes in the microstructure of the SCCO2-dried chitosan aerogels during storage. | ||
Conclusions
In this work, chitosan aerogel beads were successfully fabricated by a SCCO2 drying method with different initial chitosan hydrogel concentrations and compared with freeze-dried chitosan aerogels, in which the SCCO2-dried aerogels presented a three-dimensional nanofiber-like porous network structure dominated by mesopores and had a higher BET surface area. The porous structure of the SCCO2-dried aerogels and fast freeze-dried aerogels became denser as the initial concentration increased, with the highest BET surface area at a concentration of 2.5 wt%. For the freeze-drying method, different cooling rates had a significant influence on the structure of the chitosan aerogel beads, in which the fast-dried aerogels could maintain their porous structure better than the slow-dried aerogels. Besides, the crystallinity of the SCCO2-dried aerogels was higher than that of the fast-dried aerogels, suggesting that the SCCO2-dried aerogels might possess good mechanical, stability and permeability properties. Last but not least, humidity during storage had significant effects on the microstructure of the chitosan aerogels. These results demonstrate that the SCCO2-dried chitosan aerogel beads could better maintain their mesoporous structure, and the effect of long-term storage on the microstructure could not be ignored.Author contributions
Chun-gong Li: Conceptualization, Methodology, Investigation, Data curation, Writing – original draft. Qi Dang: Methodology, Investigation, Writing – review & editing, Supervision, Formal Analysis. Qingqing Yang: Methodology, Investigation, Writing – review & editing, Supervision, Formal Analysis. Dong Chen: Methodology, Investigation, Writing – review. Hongliang Zhu: Writing – review. Jiacheng Chen: Writing – review. Runjin Liu: Writing – review. Xiang Wang: Supervision, Project administration, Visualization, Funding acquisition.Conflicts of interest
There are no conflicts to declare.Acknowledgements
This work was financially supported by the National Natural Science Foundation of China (Grant No. 31271229 and 11572065) and the Development, Clinical Trial and Registration of Hemoperfusion (Grant No. cstc2018jszx-cyzd0582). We also thank the Open Cooperation Program from the Key Laboratory of Extreme Environmental Medicine, Ministry of Education for its support of this study (Grant No. KL2019GY010).Notes and references
- S. J. Teichner, G. A. Nicolaon, M. A. Vicarini and G. E. E. Gardes, Adv. Colloid Interface Sci., 1976, 5, 245–273 CrossRef CAS.
- Y. Si, J. Yu, X. Tang, J. Ge and B. Ding, Nat. Commun., 2014, 5, 5802 CrossRef PubMed.
- S. Takeshita, S. Zhao, W. J. Malfait and M. M. Koebel, Angew. Chem., 2021, 60, 9828–9851 CrossRef CAS PubMed.
- S. Zhao, W. J. Malfait, N. Guerrero-Alburquerque, M. M. Koebel and G. Nystrom, Angew. Chem., 2018, 57, 7580–7608 CrossRef CAS PubMed.
- G. Kravanja, M. Primozic, Z. Knez and M. Leitgeb, Molecules, 2019, 24, 1960 CrossRef CAS PubMed.
- H. Yuk, C. E. Varela, C. S. Nabzdyk, X. Mao, R. F. Padera, E. T. Roche and X. Zhao, Nature, 2019, 575, 169–174 CrossRef CAS PubMed.
- G. Maurstad, B. T. Stokke, K. M. Varum and S. P. Strand, Carbohydr. Polym., 2013, 94, 436–443 CrossRef CAS PubMed.
- D. Lin, Y. Zheng, Y. Huang, L. Ni, J. Zhao, C. Huang, X. Chen, X. Chen, Z. Wu, D. Wu, H. Chen, Q. Zhang, W. Qin and B. Xing, Carbohydr. Polym., 2020, 250, 116842 CrossRef CAS PubMed.
- S. Khattak, F. Wahid, L. P. Liu, S. R. Jia, L. Q. Chu, Y. Y. Xie, Z. X. Li and C. Zhong, Appl. Microbiol. Biotechnol., 2019, 103, 1989–2006 CrossRef CAS PubMed.
- S. Takeshita, S. Zhao and W. J. Malfait, Carbohydr. Polym., 2021, 251, 117089 CrossRef CAS PubMed.
- S. Wei, Y. C. Ching and C. H. Chuah, Carbohydr. Polym., 2020, 231, 115744 CrossRef CAS PubMed.
- S. Takeshita, A. Sadeghpour, W. J. Malfait, A. Konishi, K. Otake and S. Yoda, Biomacromolecules, 2019, 20, 2051–2057 CrossRef CAS PubMed.
- A. El Kadib, Chem. Rec., 2020, 20, 753–772 CrossRef CAS PubMed.
- Annu and A. N. Raja, Int. J. Biol. Macromol., 2020, 164, 4231–4244 CrossRef CAS PubMed.
- N. Hsan, P. K. Dutta, S. Kumar, R. Bera and N. Das, Int. J. Biol. Macromol., 2019, 125, 300–306 CrossRef CAS PubMed.
- T. Kekes and C. Tzia, J. Environ. Manage., 2020, 262, 110372 CrossRef CAS PubMed.
- Y. Li, J. Li, Z. Shi, Y. Wang, X. Song, L. Wang, M. Han, H. Du, C. He, W. Zhao, B. Su and C. Zhao, Carbohydr. Polym., 2020, 243, 116470 CrossRef CAS PubMed.
- D. Ciftci, A. Ubeyitogullari, R. R. Huerta, O. N. Ciftci, R. A. Flores and M. D. A. Saldaña, J. Supercrit. Fluids, 2017, 127, 137–145 CrossRef CAS.
- R. Rodriguez-Dorado, C. Lopez-Iglesias, C. A. Garcia-Gonzalez, G. Auriemma, R. P. Aquino and P. Del Gaudio, Molecules, 2019, 24, 1049 CrossRef CAS PubMed.
- S. Groult, S. Buwalda and T. Budtova, Eur. Polym. J., 2021, 149 Search PubMed.
- I. Leceta, M. Peñalba, P. Arana, P. Guerrero and K. de la Caba, Eur. Polym. J., 2015, 66, 170–179 CrossRef CAS.
- K. V. Harish Prashanth, F. S. Kittur and R. N. Tharanathan, Carbohydr. Polym., 2002, 50, 27–33 CrossRef CAS.
- M. I. Voronova, A. G. Zakharov, O. Y. Kuznetsov and O. V. Surov, Mater. Lett., 2012, 68, 164–167 CrossRef CAS.
- N. Quiévy, N. Jacquet, M. Sclavons, C. Deroanne, M. Paquot and J. Devaux, Polym. Degrad. Stab., 2010, 95, 306–314 CrossRef.
- C. A. García-González, M. Alnaief and I. Smirnova, Carbohydr. Polym., 2011, 86, 1425–1438 CrossRef.
- A. Tabernero, L. Baldino, A. Misol, S. Cardea and E. M. M. Del Valle, Carbohydr. Polym., 2020, 233, 115850 CrossRef CAS.
- W. Zhang, Z. Yu, Q. Qian, Z. Zhang and X. Wang, J. Membr. Sci., 2010, 348, 213–223 CrossRef CAS.
- Y. Liu, Z. Cai, L. Sheng, M. Ma and Q. Xu, Carbohydr. Polym., 2019, 212, 421–429 CrossRef CAS.
- K. Łupina, D. Kowalczyk, E. Zięba, W. Kazimierczak, M. Mężyńska, M. Basiura-Cembala and A. E. Wiącek, Food Hydrocolloids, 2019, 96, 555–567 CrossRef.
- J. Duan, X. Liang, Y. Cao, S. Wang and L. Zhang, Macromolecules, 2015, 48, 2706–2714 CrossRef CAS.
- B. Focher, P. L. Beltrame, A. Naggi and G. Torri, Carbohydr. Polym., 1990, 12, 405–418 CrossRef CAS.
- F. Zeng, S. Zhu, F. Chen, Q. Gao and S. Yu, Food Hydrocolloids, 2016, 52, 721–731 CrossRef CAS.
- T. Igarashi, M. Hoshi, K. Nakamura, T. Kaharu and K.-i. Murata, J. Phys. Chem. C, 2020, 124, 4196–4201 CrossRef CAS.
| This journal is © The Royal Society of Chemistry 2022 |


