DOI:
10.1039/D2RA01943D
(Paper)
RSC Adv., 2022,
12, 12427-12435
Curing behavior of sodium carboxymethyl cellulose/epoxy/MWCNT nanocomposites
Received
25th March 2022
, Accepted 12th April 2022
First published on 25th April 2022
Abstract
The surfactant-assisted preparation of carbon nanotube (CNT)/polymer composites has attracted the attention of scientists around the world. Here, CNT/epoxy nanocomposites were prepared using sodium carboxymethyl cellulose (CMC). The effect of CMC on the curing behaviors of epoxy resin (E44) and CNTs/E44 was studied using differential scanning calorimetry (DSC). The curing kinetics of the CMC/CNTs/E44 systems were examined using methods where the activation energy (E) is a constant and where E is a variable, respectively. The change of E with the conversion (α) was calculated using the Starink isoconversional method. For the E44 system, a significant variation of E was observed when the conversion increased from 0.05 to 0.95. The E variable method was introduced to this system to describe this phenomenon. In contrast to the method where E is a constant, the E variable method has better agreement with the experimental data. With these two methods, the curing kinetics of the CMC/CNTs/epoxy system can be understood comprehensively and accurately. Ultimately, the dynamic mechanical properties of neat E44, CMC/E44 and CMC/CNTs/E44 were investigated and compared, which showed that CMC/E44 had a higher storage modulus (Em) than the neat E44 and CMC/CNTs/E44 systems, and the CMC/CNTs/E44 system had a higher glass transition temperature (Tg) and damping factor (tan![[thin space (1/6-em)]](https://www.rsc.org/images/entities/char_2009.gif) δ) than the neat E44 and CMC/E44 systems.
δ) than the neat E44 and CMC/E44 systems.
1. Introduction
As a common surfactant with several hydroxyl groups, CMC has been widely used not only in detergents, oil-drilling, food-making, and paper but also in textiles as a sizing agent (glass fiber or carbon fiber).1 CMC improves the wettability and interfacial bonding in carbon fiber/matrix resins. CMC is also a good stabilizer of nanoparticles,2 for example, CMC has been found to be a stable dispersion agent for single-walled carbon nanotubes (SWCNTs) in solution; it improves their dispersibility better than gelatin because the CMC chains surrounding SWCNTs in aqueous media provide electrostatic repulsion,3 which is twenty times more concentrated than that provided by sodium sulfate (SDS) under the same conditions.3–6 It is believed that the long CMC molecules overlaying CNTs have wide dispersibility in solvents.5,7–9 Takahashi et al.3 prepared SWCNTs with high quality using CMC functioning as an effective dispersion reagent. CMC may eventually be generally applied to all walks of life such as in the synthesis of CNT/epoxy or CNT/epoxy/carbon fiber composites.10
Epoxy resin has been widely used in aerospace, composite materials, bipolar plates and other fields because of its high strength and good adhesion. However, its toughness is poor, and nanomaterial modification is a common technical means of improvement.11–13 However, nanomaterials are very easily agglomerated, and surfactant-assisted dispersion technology has been studied to solve this problem.8,14 Therefore, in practical application, we have to consider the effect of surfactants on the curing reaction of epoxy systems.
The kinetic mechanism of the epoxy resin curing process has been intensively studied using different models, methods and techniques.15,16 The process of the curing reaction of epoxy resin is exothermic, and isothermal and non-isothermal DSC techniques are always applied to study its curing kinetics. Curing kinetic models are divided into two categories: phenomenological and mechanistic models.17 By and large, it is difficult to establish mechanistic models, especially when the curing reaction is very involved. Phenomenological models have proven to be more appropriate to describe the kinetics of the epoxy curing process in these cases. Among the various phenomenological models, the autocatalytic model, which was used most extensively to study the kinetics of epoxy resin curing, is in accordance with the assumption that the activation energy is constant and the whole kinetic process of the curing reaction is a single reaction (the method where E is a constant). However, this method cannot embody the variation of activation energy vs. conversion (α). However, the curing reaction of epoxy is universally very complex, and the activation energy always varies with the curing reaction. For example, during glass transitions, E decreases significantly with conversion when the epoxy converts from the glass state to the liquid state.16 Alternatively, a simple and more reliable model has been established using the method where E is a variable, which is deduced on account of the conception of variable activation energy, in which the activation energy is a function of conversion.18,19 Sun et al. studied the curing kinetics of liquid lignin-based epoxy resin/maleic anhydride systems and established the kinetic equation of variable activation energy, which is a typical example of the method where E is a variable.19
In our work, the potential application of CMC has been verified and CMC/CNTs/epoxy nanocomposites have been obtained. The effect of CMC on the curing behavior of epoxy resin (E44) and CNTs/E44 were explored using non-isothermal DSC. The change of E vs. α was estimated by the Starink isoconversional method.16,20 The results of the study show that the effect of CMC on the epoxy E44 curing kinetics is significantly different from that on the epoxy E51, which was reported in our previous study10. The reaction mechanism was assumed to follow an autocatalytic model. The methods where E is a constant and E is a variable are used to depict the curing kinetics of the epoxy resin system. A variable E model is established and used to depict the curing kinetics of the epoxy resins. The model parameters are obtained from the Levenberg–Marquardt method. Compared with the two methods, the method where E is a variable is in line with the experimental data. Hence, these two kinetic methods can give us a more intuitive and in-depth understanding of the curing kinetics in the CMC/E44/DDM system. Finally, the dynamic mechanical properties of E44, CMC/E44 and CMC/CNTs/E44 were studied and contrasted.
2. Materials and methods
2.1. Materials
CMC was supplied by Suzhou Yiming Chemical Plant in China. The diglycidyl ether of bisphenol A type (E44) epoxy resin was supplied by Deyuan Chemistry Plant, China (epoxide equivalent weight is 213–244 g eq−1). The curing agent was 4,4′-diamino diphenylmethane (DDM) (Aladdin Reagent Co., China). Multi-walled carbon nanotubes (purity >98%, diameter = 80–150 nm, length = 5–10 μm, type = CNT203) were purchased from Beijing Dekedaojin Technology Co., Ltd.
2.2. Measurements
The curing kinetics of the CMC/CNTs/E44 system at multiple heating rates were analysed by DSC. E44 epoxy resin, CNTs and CMC were blended at 80 °C in a mass ratio of 100/1/3 (the dosage of CNTs and CMC were obtained experimentally), and then cooled to room temperature. DDM was blended and mixed with the CMC/CNTs/E44 system. The mass ratio of E44 to DDM was set at 100![[thin space (1/6-em)]](https://www.rsc.org/images/entities/char_2009.gif) :
:![[thin space (1/6-em)]](https://www.rsc.org/images/entities/char_2009.gif) 23.3 (the ratio was obtained by experimentation and stoichiometry). The CMC/CNTs/E44/DDM system was stirred at high speed for about two hours to ensure uniform dispersion of CMC and CNTs in the system. The sample CMC/CNTs/E44/DDM was stored in a cool place for 24 h, after which it was analyzed using DSC, which can ensure the accuracy of the result. The E44 and CMC/E44 systems were also analyzed.
23.3 (the ratio was obtained by experimentation and stoichiometry). The CMC/CNTs/E44/DDM system was stirred at high speed for about two hours to ensure uniform dispersion of CMC and CNTs in the system. The sample CMC/CNTs/E44/DDM was stored in a cool place for 24 h, after which it was analyzed using DSC, which can ensure the accuracy of the result. The E44 and CMC/E44 systems were also analyzed.
Dynamic DSC analysis was carried out using a DSC Q200 (TA, U.S.A.), which was calibrated with high-purity indium and zinc standards. Mixed samples (4–5 mg) were taken out of the cold and placed onto an aluminum pan, and the samples were analyzed dynamically at heating rates of 5, 10, 15, and 20 K min−1 in a nitrogen atmosphere. The speed of nitrogen purge was 50 mL min−1 to make the sample micro-oxidized. The reaction was deemed to be sufficient when the rate curve reached a baseline. In the range of 318.15 K to 573.15 K, an empty pan was always used as a reference for measurement.
2.3. Dynamic mechanical analysis (DMA)
The sample preparation process is shown schematically in Fig. 1. E44 and DDM were blended thoroughly at room temperature and then perfused onto a preheated (313.15 K) stainless steel mould. Then, the mixture of E44 and DDM in the mould was placed in a vacuum oven under weakened pressure to whip in any entrapped bubbles, and passed on to an air-blast oven and warmed up to 353.15 K for 2 h followed by 423.15 K for another 4 h. The mould was taken out, the clamps were removed, and the cured casting epoxy resin bars (about 80 mm × 12 mm × 3 mm) were obtained. After being cut and polished, the epoxy resin bars were converted into DMA test specimens. Dynamic mechanical analysis was performed using a DMA Q800 (TA Instruments, USA). The specimen was immobilized on a single cantilever clip, the heating rate was 3 K min−1, the oscillation frequency was 1 Hz, and the displacement was immobilized at 10 μm. The temperature ranged from ∼45 °C to 240 °C. Furthermore, for the comparative study, cured CMC/E44/DDM and CMC/CNTs/E44/DDM specimens were prepared and subjected to DMA in the same way as E44.
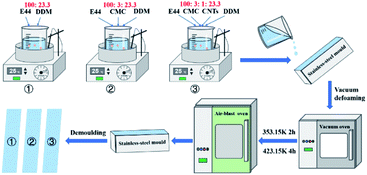 |
| | Fig. 1 The preparation process of the DMA samples. | |
3. Basic assumptions of dynamic DSC analysis
The dynamic parameters of the curing reaction were evaluated according to the DSC exothermic curves. The DSC curves were tested on the assumption that the area of the curves was in direct relationship with the conversion (α), which can be expressed as:21,22| |
 | (1) |
in which ΔHT is the overall heat of reaction during the entire curing process and H(t) is the fractional reaction heat of the cured samples at time t. By integrating the isothermal and non-isothermal methods, we can obtain the DSC curve from the curing starting point to the terminus of curing, so as to evaluate the conversion (α). The line between these two points is the baseline. The entire area of the exothermal peak is in direct relationship with the absolute heat of the curing reaction (ΔHT).
For non-isothermal curing, the assignment of the heat of reaction H(t) is indicated by eqn (2):21
| |
 | (2) |
in which
Q(
t) is the heat measured by the DSC experiment.
As mentioned above, most kinetic methods employed in the area of thermal analysis consider the reaction rate as a function of only two variables, T and α.16 A general expression of the reaction rate with temperature is established as:16,23
| |
 | (3) |
where
f(
α) is the model function of conversion
α that depends on the reaction mechanism. It is presumed to be of Arrhenius-type,
22,23 where the rate constant at a given temperature is:
| |
 | (4) |
where
A is the pre-exponential factor,
E is the activation energy,
R is the gas constant (8.314 J mol
−1 K
−1) and
T is the temperature in Kelvin.
Under non-isothermal states, the heating rate β = dT/dt can be incorporated with eqn (3) and (4), and the dynamical model can be defined as:
| |
 | (5) |
4. Results
4.1. Model-free isoconversional method
DSC curves of the neat epoxy E44 system, CMC/E44 system and the CMC/CNTs/E44 system were plotted at multiple heating rates (β; 5, 10, 15, and 20 K min−1) with temperatures in the range of 318.15–573.15 K. The dynamic DSC curves of the neat epoxy E44, CMC/E44 and CMC/CNTs/E44 systems are shown in Fig. 2–4, where, as the heating rate increases, the temperature peak also increases gradually. The value of α can be computed using eqn (1). The relationship between α and T in the systems of neat epoxy E44, CMC/E44 and CMC/CNTs/E44 at multiple heating rates can be observed in Fig. 5–7, respectively. These results supply the basic data for the model-free isoconversional calculation.
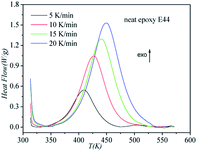 |
| | Fig. 2 Dynamic DSC curves for the neat epoxy E44 system at different heating rates. | |
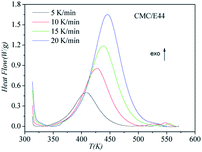 |
| | Fig. 3 Dynamic DSC curves for the CMC/E44 system at different heating rates. | |
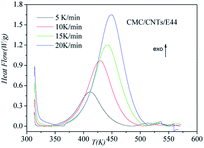 |
| | Fig. 4 Dynamic DSC curves for the CMC/CNTs/E44 system at different heating rates. | |
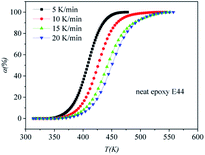 |
| | Fig. 5 Conversion (α) as a function of temperature for the neat epoxy E44 system. | |
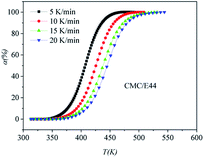 |
| | Fig. 6 Conversion α as a function of temperature for the CMC/E44 system. | |
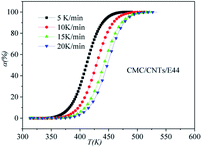 |
| | Fig. 7 Conversion α as a function of temperature for the CMC/CNTs/E44 system. | |
The activation energy of thermally activated reactions can be accurately calculated using the model-free isoconversional methods.16,20 They are widely used in the analysis of the changes of E vs. α.24 The isoconversional methods can normally be classified into two types: differential and integral. In accordance with the International Confederation for Thermal Analysis and Calorimetry (ICTAC) Kinetics Committee's recommendation, using only one equation is more accurate than using two or more of these methods since the difference in the E value calculated by the latter is negligible.16 The Starink method, one of the integral isoconversional methods, is considered to be more accurate than other isoconversional methods and is used to compute the activation energy of curing in this work,16,20 and is expressed as:10,20
| |
 | (6) |
where
Tf is the temperature at an even (fixed) state of conversion at multiple heating rates. At a fixed conversion rate, activation energy is identified as the slope of the plots of −ln(
β/
Tf1.92)
vs. 1/
Tf in fixed conversion. The correlation of
E vs. α is shown in
Fig. 8.
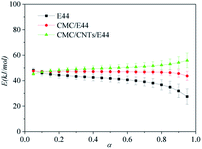 |
| | Fig. 8 Variation of E vs. α using the Starink method. | |
As shown in Fig. 8, there is a clear distinction in the value of E for the neat epoxy E44 system when the value of α increases from 0.05 to 0.95, which demonstrates that the curing reaction obeys the multi-step reaction mechanism.25,26 In the low-conversion stage, the value of E ranged from ∼48.1 kJ mol−1 to ∼41.2 kJ mol−1 as the value of α increased from 0.05 to 0.55, which may be caused by the ring-opening reaction between the epoxy groups of E44 and the primary amino groups of DDM, as the newly formed secondary amine with higher reactivity has greater steric hindrance than the primary amine.26,27 Additionally, the theoretical gelation conversion of the stoichiometric E44/DDM system, αgel ≈ 0.577, can be computed from eqn (7):26–28
| |
 | (7) |
In eqn (7), fA and fE represent the functionalities of amine and epoxide, respectively. It is worth mentioning that the calculated αgel is slightly higher than the above-mentioned low-conversion of 0.55, before which E does not change significantly. This result shows that in this space and time response, the curing process, not influenced by the gelation process, is simple and the diffusion distance between the epoxy groups of E44 and the primary amino groups of DDM reacting with each other is longer (long-range motion). To summarise, for processes that are controlled by chemical reactions, the diffusion rate has little effect on the reaction rate of the whole system, and the conversion rate will increase rapidly with the enhancement of the reaction system. This illustrates that the reaction kinetics of the low-conversion reaction grade is controlled by the process of the reaction.
As α continues to increase from ∼0.55 to 0.85, E decreases gradually from ∼41.2 to ∼34.8 kJ mol−1, which can be explained as follows. After the low-conversion reaction stage, large quantities of hydroxyl groups are generated in the reaction system, which can greatly promote the further reaction of the system. Ultimately, the barrier between the epoxide and amine group is reduced. As α further increases beyond 0.85, the effective E of the E44/DDM system decreases from ∼34.8 to ∼27 kJ mol−1, which implies that the diffusion control dominates in the curing process instead of the reaction control. During this stage, diffusion control is the decisive factor that determines the overall kinetic rate.25,27,28
As for the CMC/E44 and CMC/CNTs/E44 systems, the variation of E was insignificant when the conversion increased. The value of E for the CMC/E44 system was around 47 kJ mol−1 when α was in the range of 0.05–0.85. However, in the CMC/CNTs/E44 system, E increased gradually from ∼45 kJ mol−1 to ∼55 kJ mol−1 as the conversion increased. Notably, the values of E obtained for the CMC/E44 and CMC/CNTs/E44 systems at the initial curing phase (Fig. 8) are in accordance with the value obtained for E44. According to the acknowledged theory of epoxy amine curing, the value of E suggests that the initial phase of curing of the CMC/E44 and CMC/CNTs/E44 systems is controlled by the reaction between epoxy groups and the primary amine groups. Compared with the neat epoxy E44 system, the CMC molecules in CMC/E44 and CMC/CNTs/E44 contain a good deal of hydroxyl groups, which can catalyse the epoxy–amine reaction. The catalytic effect of hydroxyl groups can lead to the delay of the switching from chemical control to diffusion control; thus, the value of E does not clearly reduce in a specific range. As for the CMC/E44 and CMC/CNTs/E44 systems, at the beginning of the curing reaction, where the value of α was in the range of 0–0.1, the primary amine group reacted with the epoxy group; as the curing reaction proceeded, the value of α increased into the range of 0.1–0.7, while the activation energy increased slightly (47 kJ mol−1 in the CMC/E44 system, 49 kJ mol−1 in the CMC/CNTs/E44 system). The polyether reaction may occur at this time, which means that CMC added to the E44/DDM system may change the course of the reaction so that it generates more polyether structures.27 However, in our previous work, the addition of CMC had no effect on the curing reaction of E51/DDM, which shows that the effect of CMC on the curing kinetics of E44/DDM is significantly different from that of the E51/DDM system.10
4.2. The E constant method
A two-parameter (m, n) autocatalytic model (SB model) is usually adopted to depict the curing kinetics of epoxy resin systems.23,31 The f(α) can be depicted as:29Here, this model is adopted to depict the curing kinetics of the neat epoxy E44, CMC/E44 and CMC/CNTs/E44 systems. Combined with eqn (5), the kinetic model can be expressed as:| |
 | (9) |
The values of E, m, n and A can be parsed using the Levenberg–Marquardt method, where T and α are two independent variables and [β(dα/dT)] is a servient variable. The results are shown in Table 1. The root-mean-square error (RMSE) and related coefficient (R) are also shown in Table 1.
Table 1 The kinetic parameters m, n, ln![[thin space (1/6-em)]](https://www.rsc.org/images/entities/char_2009.gif) A, and E and regression parameters R and RMSE for the autocatalytic model using the Levenberg–Marquardt method
A, and E and regression parameters R and RMSE for the autocatalytic model using the Levenberg–Marquardt method
| |
E (kJ mol−1) |
ln![[thin space (1/6-em)]](https://www.rsc.org/images/entities/char_2009.gif) A (min−1) A (min−1) |
m |
n |
RMSE |
R |
| Neat epoxy E44 |
36.1 |
9.87 |
0.678 |
1.519 |
0.013 |
0.9841 |
| CMC/E44 |
48.6 |
13.20 |
0.446 |
1.376 |
0.007 |
0.9965 |
| CMC/CNTs/E44 |
55.8 |
15.08 |
0.382 |
1.303 |
0.012 |
0.9919 |
The curing kinetic equations of the neat epoxy E44, CMC/E44 and CMC/CNTs/E44 systems with the method where E is a constant can be respectively expressed as:
| dα/dt = e9.87e(−36100/RT)α0.678(1 − α)1.519, α ∈ (0,1) |
| dα/dt = e13.20e(−48600/RT)α0.446(1 − α)1.376, α ∈ (0,1) |
| dα/dt = e15.08e(−55700/RT)α0.382(1 − α)1.303, α ∈ (0,1) |
The correctness of this model was verified by plotting the relationship between dα/dT and T using the obtained model equation. The simulation results are shown in Fig. 9–11, and compared with the experimental curves, the simulation results of the CMC/E44 system fit the experimental data very well using this model. However, for the neat epoxy E44 and CMC/CNTs/E44 systems, due to the changes of E with α, the SB model (E constant method) is not good enough to describe their curing processes.
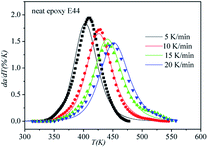 |
| | Fig. 9 Comparison of experimental values (symbols) and calculated values (lines) for the neat epoxy E44 system using the E constant method. | |
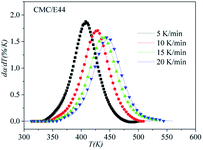 |
| | Fig. 10 Comparison of experimental values (symbols) and calculated values (lines) for the CMC/E44 system using the E constant method. | |
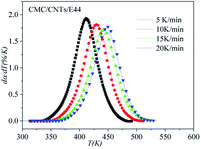 |
| | Fig. 11 Comparison of experimental values (symbols) and calculated values (lines) for the CMC/CNTs/E44 system using the E constant method. | |
4.3. The E variable method
The curing reaction of epoxy resin is universally complicated. As a matter of fact, the value of E, which is the dependent variable, usually varies with α, which is the independent variable. A violation, perhaps of the constancy of E, gives rise to a systematic error in the value of E.16 The variation of E with α can be obtained through integral or differential isoconversional methods. For the neat epoxy E44 and CMC/CNTs/E44 systems, due to the changes of E with α, the SB model is not adequate to depict the curing process. In order to solve this problem, the E variable model was introduced to describe the curing process. Hongguang et al.19 studied the variation of E with α, which was obtained using the isoconversional method, and then the kinetic equation for the LEPL/MA system was obtained from the E variable method. Hongguang's E variable model is as follows:| |
 | (10) |
with
| ln[F(α)] = p1 + p2α + p3α2 |
| E(α) = p4 + p5α + p6α2 + p7α3 |
Tianle et al.15 reported the curing kinetics of the DGEBA/EMI-2,4/nano-SiC system, which was studied using methods where E is a constant and E is a variable, and their E variable model is as follows:
| |
 | (11) |
with
| ln[Af(α)] = p1 + p2α + p3α2 + p4α3 |
| E(α) = p5 + p6α + p7α2 + p8α3 |
According to these two models, Jin et al. proposed a new E variable model based on the assumption of variable E to depict the curing kinetics of epoxy resin systems. The following is the basic equation:
| |
 | (12) |
with
| | |
E(α) = p5 + p6α + p7α2 + p8α3
| (13) |
| | |
ln[A(α)] = (p1 + p2α + p3α2 + p4α3)
| (14) |
For the neat epoxy E44, CMC/E44 and CMC/CNTs/E44 systems, the values of p1, p2, p3, p4, p5, p6, p7, p8, m, and n can be obtained using the Levenberg–Marquardt method, where T and α, which are the independent variables, vary with [β(dα/dT)], which is the dependent variable. The results are shown in Table 2. The RMSE and R values are also shown in Table 2.
Table 2 The kinetic parameters and regression parameters based on the E variable method
| p1 (min−1) |
p2 (min−1) |
p3 (min−1) |
p4 (min−1) |
p5 (kJ mol−1) |
p6 (kJ mol−1) |
p7 (kJ mol−1) |
p8 (kJ mol−1) |
m |
n |
RMSE |
R |
| Neat epoxy E44 |
| 10.64 |
0.42 |
−1.45 |
−7.48 |
41.7 |
−0.87 |
−2.86 |
−25.04 |
0.31 |
0.87 |
0.012 |
0.9877 |
![[thin space (1/6-em)]](https://www.rsc.org/images/entities/char_2009.gif) |
| CMC/E44 |
| 12.41 |
2.86 |
−1.92 |
−2.04 |
47.5 |
6.95 |
−4.04 |
−7.02 |
0.26 |
1.19 |
0.007 |
0.9969 |
![[thin space (1/6-em)]](https://www.rsc.org/images/entities/char_2009.gif) |
| CMC/CNTs/E44 |
| 13.29 |
5.59 |
−10.23 |
10.89 |
49.2 |
21.5 |
−42.6 |
45.7 |
0.41 |
1.22 |
0.009 |
0.9957 |
In order to assess the validity of the E variable method, the correlation between dα/dt and t is compared with the calculated data and experimental data in Table 2. As shown in Fig. 12–14, a comparison of the results of the E44, CMC/E44 and CMC/CNTs/E44 systems indicates that the calculated data are consistent with the experimental data, which means that the E variable method could depict the overall curing reaction process accurately. Therefore, the R of the E variable method is better than that of the E constant method (Table 1), i.e. the E variable method is much better than the E constant method at describing the experimental data. By comparing Fig. 9–11 with Fig. 12–14, it can be determined that the E variable method is more advantageous for the neat epoxy E44 and CMC/CNTs/E44 systems than the E constant method.
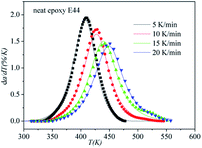 |
| | Fig. 12 Comparison of experimental values (symbols) and calculated values (lines) for the neat epoxy E44 system using the E variable method. | |
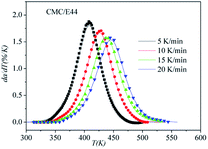 |
| | Fig. 13 Comparison of experimental values (symbols) and calculated values (lines) for the CMC/E44 system using the E variable method. | |
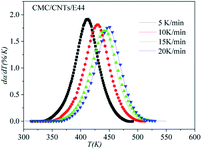 |
| | Fig. 14 Comparison of experimental values (symbols) and calculated values (lines) for the CMC/CNTs/E44 system using the E variable method. | |
4.4. Analysis of the E constant and E variable methods
The activation energy is defined as a function of conversion in the method where E is a variable and without the assumption of constant E.19,30 Therefore, the results obtained using the method where E is a variable are in accordance with the experimental data from the method where E is a constant.
For the neat epoxy E44 and CMC/CNTs/E44 systems, the value of E exhibits variation when using the Starink isoconversional method; therefore, the E variable method is more suitable in this case. For the CMC/E44 system, both methods where E is a constant and E is a variable can describe the curing process very well.
The E variable method could be conveniently extended to other models such as the nth order model or the autocatalytic model. Some researchers pointed out that A and E often exhibit the following relationship:31
| |
ln![[thin space (1/6-em)]](https://www.rsc.org/images/entities/char_2009.gif) A = aE + b A = aE + b
| (15) |
where
a and
b are invariable coefficients for a battery of related rate processes. This relationship refers to the kinetic compensation effect (KCE). Other studies have shown that the relationship of
E with
α could be described by a polynomial.
15,19,24 Thus, the relationship of ln
![[thin space (1/6-em)]](https://www.rsc.org/images/entities/char_2009.gif) A vs. α
A vs. α can be described by a polynomial and the relationships are assumed to be:
| |
ln![[thin space (1/6-em)]](https://www.rsc.org/images/entities/char_2009.gif) A = p1 + p2α + p3α2 + p4α3 A = p1 + p2α + p3α2 + p4α3
| (16) |
Combined with eqn (13) and (16) as well as the nth order model,32 we can obtain the nth order E variable model:
| |
 | (17) |
The E variable method shows excellent performance in fitting the experimental data. When E obviously changes with α, the superiority of the E variable method is particularly evident. This method can also be used in other kinetic areas, such as the crystallization kinetics of thermoplastics and phase-transformation kinetics.33 Compared with its advantages, the disadvantages of the method where E is a variable in terms of the physical meaning of its parameters are not clear; therefore, further research is needed.
4.5. DMA results
Fig. 15 shows the dynamic mechanical spectra for the storage modulus (Em) and damping factor (tan![[thin space (1/6-em)]](https://www.rsc.org/images/entities/char_2009.gif) δ) of the E44, CMC/E44 and CMC/CNTs/E44 networks at a heating rate of 3 K min−1 (1 Hz), where Em and tan
δ) of the E44, CMC/E44 and CMC/CNTs/E44 networks at a heating rate of 3 K min−1 (1 Hz), where Em and tan![[thin space (1/6-em)]](https://www.rsc.org/images/entities/char_2009.gif) δ are plotted as a function of temperature. Table 3 shows the values of the characteristic relaxation temperatures and modulus as drawn from Fig. 15. As shown in Fig. 15 and Table 3, Em decreases with increasing temperature. As temperature rises, a peak for tan
δ are plotted as a function of temperature. Table 3 shows the values of the characteristic relaxation temperatures and modulus as drawn from Fig. 15. As shown in Fig. 15 and Table 3, Em decreases with increasing temperature. As temperature rises, a peak for tan![[thin space (1/6-em)]](https://www.rsc.org/images/entities/char_2009.gif) δ appears between 80 °C and 200 °C, which is related to the α-relaxation of the epoxy network. Em and tan
δ appears between 80 °C and 200 °C, which is related to the α-relaxation of the epoxy network. Em and tan![[thin space (1/6-em)]](https://www.rsc.org/images/entities/char_2009.gif) δ showed dramatic changes in this temperature range, attributed to the glass–rubber transition of the epoxy E44, CMC/E44 and CMC/CNTs/E44 networks and the transition of the glassy epoxy network to highly elastic rubber. The temperature of the tan
δ showed dramatic changes in this temperature range, attributed to the glass–rubber transition of the epoxy E44, CMC/E44 and CMC/CNTs/E44 networks and the transition of the glassy epoxy network to highly elastic rubber. The temperature of the tan![[thin space (1/6-em)]](https://www.rsc.org/images/entities/char_2009.gif) δ peak is taken as the glass transition temperature (Tg).
δ peak is taken as the glass transition temperature (Tg).
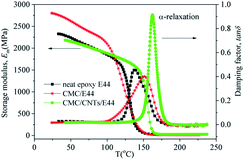 |
| | Fig. 15 Dynamic mechanical spectra for the storage modulus, Em, and damping factor, tan![[thin space (1/6-em)]](https://www.rsc.org/images/entities/char_2009.gif) δ, against temperature. δ, against temperature. | |
Table 3 Characteristic relaxation temperatures, modulus and crosslink density of the neat epoxy E44, CMC/E44 and CMC/CNTs/E44 systems
| Formulation |
Neat epoxy E44 |
CMC/E44 |
CMC/CNTs/E44 |
| α-Relaxation (Tg)/°C |
137 |
152 |
162 |
| Modulus at 50 °C/MPa |
2231 |
2619 |
2154 |
| Modulus at 80 °C/MPa |
2014 |
2341 |
1994 |
| Rubbery modulus at Tg + 30 °C/MPa |
24 |
13 |
26 |
| Crosslink density (VE)/mol m−3 |
2186 |
1148 |
2241 |
The Em and tan![[thin space (1/6-em)]](https://www.rsc.org/images/entities/char_2009.gif) δ of E44, CMC/E44 and CMC/CNTs/E44 are contrasted in Fig. 15 and Table 3, indicating that CMC/E44 has a higher value of Em in the temperature range of 50–100 °C compared to that of E44 and CMC/CNTs/E44. The Tg of the CMC/CNTs/E44 and CMC/E44 systems are 162 °C and 152 °C, respectively, which are higher than the Tg of E44 (137 °C). Compared with E44 and CMC/E44, the tan
δ of E44, CMC/E44 and CMC/CNTs/E44 are contrasted in Fig. 15 and Table 3, indicating that CMC/E44 has a higher value of Em in the temperature range of 50–100 °C compared to that of E44 and CMC/CNTs/E44. The Tg of the CMC/CNTs/E44 and CMC/E44 systems are 162 °C and 152 °C, respectively, which are higher than the Tg of E44 (137 °C). Compared with E44 and CMC/E44, the tan![[thin space (1/6-em)]](https://www.rsc.org/images/entities/char_2009.gif) δ of CMC/CNTs/E44 increased obviously. The rubbery modulus, Er, shown in Table 3, is the storage modulus at 30 °C above Tg.34–36 CMC/CNTs/E44 has a higher Er than neat epoxy E44, which probably indicates that the CMC/CNTs/E44 system has a higher crosslink density. Resins with higher crosslink density show higher mechanical and thermal properties. For quantification, the crosslink density was estimated from eqn (18):35–37
δ of CMC/CNTs/E44 increased obviously. The rubbery modulus, Er, shown in Table 3, is the storage modulus at 30 °C above Tg.34–36 CMC/CNTs/E44 has a higher Er than neat epoxy E44, which probably indicates that the CMC/CNTs/E44 system has a higher crosslink density. Resins with higher crosslink density show higher mechanical and thermal properties. For quantification, the crosslink density was estimated from eqn (18):35–37
where
R is the universal gas constant,
Tr (K) is the temperature matching
Er, and
VE is the crosslink density. As shown in
Table 3, CMC/CNTs/E44 has a much higher
VE than neat epoxy E44. In summary, the addition of CMC and CNTs to epoxy resin can ameliorate the thermomechanical properties of the cured epoxy resin and increase the value of
Tg and tan
![[thin space (1/6-em)]](https://www.rsc.org/images/entities/char_2009.gif) δ
δ.
5. Conclusions
In conclusion, the curing kinetics of the neat epoxy resin E44, CMC/E44, and CMC/CNTs/E44 systems were investigated using non-isothermal DSC at different heating rates. The change in E vs. α was obtained using the Starink isoconversional method. The value of E revealed that the dynamics of the entire system was dominated by reaction-control, while the diffusion-controlled kinetics were generated in the deep-conversion phase as determined by the sharp decrease in E for the neat epoxy E44 system. Methods with E as a constant and E as a variable were used to analyse the curing kinetics. A new E variable model was presented based on variable activation energy and was used to investigate the curing kinetics of the neat epoxy E44, CMC/E44 and CMC/CNTs/E44 systems. The model parameters were approximated using the Levenberg–Marquardt method. In the method where E is a constant, the values of the curing reaction activation energy E are 36.1 kJ mol−1 for neat epoxy E44, 48.6 kJ mol−1 for CMC/E44 and 55.8 kJ mol−1 for CMC/CNTs/E44. With the E variable method, the change of E vs. α was obtained. A comparison of the different experimental methods and data manifests that the results obtained by employing the method where E is a variable showed better consistency with the experimental data compared to the method where the E is a constant. Combining the methods in which E is a constant and E is a variable, a comprehensive analysis of the curing reactions of the neat epoxy E44, CMC/E44 and CMC/CNTs/E44 systems can be performed. Moreover, dynamic mechanical analysis showed that CMC/CNTs/E44 had a higher glass transition temperature and crosslink density than neat epoxy E44.
Author contributions
Conceptualization, Hongxing Dong; methodology, Jianguo Zhao; investigation, Jin Zhang; writing-original draft, Jin Zhang, Lu Tan; writing-review and editing, Wenshan Qu, Jin Zhang, Hongxing Dong and Jianguo Zhao; visualization, Lu Tan; supervision, Jin Zhang. All authors have read and agreed to the published version of the manuscript.
Conflicts of interest
The authors declare no conflicts of interest.
Acknowledgements
The authors gratefully acknowledge the financial support by the National Natural Science Foundation of China (20976032, 21076049), Youth Science and Technology Fund of Gansu (20JR5ERE647), and Datong City Science and Technology Research project (2020013).
References
- P. Liu, M. Zhai, J. Li, P. Jing and J. Wu, Radiat. Phys. Chem., 2002, 63, 525–528 CrossRef CAS.
- X. Cao, L. Li and H. Chen, Acta Chim. Sin., 2010, 68, 1461–1466 CAS.
- T. Takahashi, K. Tsunoda, H. Yajima and T. Ishii, Jpn. J. Appl. Phys., 2004, 43, 3636–3639 CrossRef CAS.
- N. Minami, Y. Kim, K. Miyashita, S. Kazaoui and B. Nalini, Appl. Phys. Lett., 2006, 88, 73103 CrossRef.
- S. Ohmori, T. Saito, B. Shukla, M. Yumura and S. Iijima, ACS Nano, 2010, 4, 3606–3610 CrossRef CAS PubMed.
- I. Riou, P. Bertoncini, H. Bizot, J. Y. Mevellec and O. Chauvet, J. Nanosci. Nanotechnol., 2009, 9, 6176–6180 CrossRef CAS PubMed.
- R. Haggenmueller, S. S. Rahatekar, J. A. Fagan, J. Chun, M. L. Becker, R. R. Naik, T. Krauss, L. Carlson, J. F. Kadla and P. C. Trulove, Langmuir, 2008, 24, 5070–5078 CrossRef CAS PubMed.
- W. K. Sang, T. Kim, Y. S. Kim, S. C. Hong, H. J. Lim, S. J. Yang and R. P. Chong, Carbon, 2012, 50, 3–33 CrossRef.
- P. C. Ma, N. A. Siddiqui, G. Marom and J. K. Kim, Composites, Part A, 2010, 41, 1345–1367 CrossRef.
- Z. Jin, H. Dong, L. Tong, M. Lei, C. Ye and G. Yue, Thermochim. Acta, 2012, 549, 63–68 CrossRef.
- M. Dehghan, R. Al-Mahaidi and I. Sbarski, Polym. Compos., 2016, 37, 1021–1033 CrossRef CAS.
- H. Suherman, A. B. Sulong and J. Sahari, Ceram. Int., 2013, 39, 1277–1284 CrossRef CAS.
- J. C. Long, H. Zhan, G. Wu, Y. Zhang and J. N. Wang, Composites, Part A, 2021, 146, 106409 CrossRef CAS.
- X. Gong, J. Liu, S. Baskaran, R. D. Voise and J. S. Young, Chem. Mater., 2000, 12, 1049–1052 CrossRef CAS.
- T. Zhou, M. Gu, Y. Jin and J. Wang, Polymer, 2005, 46, 6174–6181 CrossRef CAS.
- S. Vyazovkin, A. K. Burnham, J. M. Criado, L. Pérez-Maqueda and N. Sbirrazzuoli, Thermochim. Acta, 2011, 520, 1–19 CrossRef CAS.
- M. A. Corcuera, C. Riccardi and I. Mondragon, Polymer, 2005, 46, 7989–8000 CrossRef.
- O. S. Al-Ayed, R. Matouq, R. An Ba R, R. M. Khaleel and R. Abu-Nameh, Appl. Energy, 2010, 87, 1269–1272 CrossRef CAS.
- S. Gang, H. Sun, L. Yu, B. Zhao, Z. Na and K. Hu, Polymer, 2007, 48, 330–337 CrossRef.
- M. J. Starink, Thermochim. Acta, 2003, 404, 163–176 CrossRef CAS.
- M. Harsch, J. Karger-Kocsis and M. Holst, Eur. Polym. J., 2007, 43, 1168–1178 CrossRef CAS.
- I. E. Sawi, P. A. Olivier, P. Demont and H. Bougherara, J. Appl. Polym. Sci., 2012, 126, 358–366 CrossRef.
- S. Movva, X. Ouyang, J. Castro and L. J. Lee, J. Appl. Polym. Sci., 2012, 125, 2223–2230 CrossRef CAS.
- C. Alzina, N. Sbirrazzuoli and A. Mija, J. Phys. Chem. C, 2011, 115, 22789–22795 CrossRef CAS.
- S. Vyazovkin, A. Mititelu and N. Sbirrazzuoli, Macromol. Rapid Commun., 2003, 24, 1060–1065 CrossRef CAS.
- J. Wan, Z. Y. Bu, C. J. Xu, B. G. Li and H. Fan, Chem. Eng. J., 2011, 171, 357–367 CrossRef CAS.
- N. Sbirrazzuoli, A. Mititelu-Mija, L. Vincent and C. Alzina, Thermochim. Acta, 2006, 447, 167–177 CrossRef CAS.
- N. Sbirrazzuoli, S. Vyazovkin, A. Mititelu, C. Sladic and L. Vincent, Macromol. Chem. Phys., 2003, 204, 1815–1821 CrossRef CAS.
- M. J. Yoo, H. K. Sang, S. D. Park, W. S. Lee and S. Nahm, Eur. Polym. J., 2010, 46, 1158–1162 CrossRef CAS.
- S. Vyazovkin, Thermochim. Acta, 2003, 397, 269–271 CrossRef CAS.
- K. Yip, E. Ng, C. Z. Li, J. I. Hayashi and H. Wu, Proc. Combust. Inst., 2011, 33, 1755–1762 CrossRef CAS.
- Z. Lei and H. Xiao, Polymer, 2010, 51, 3814–3820 CrossRef.
- E. E. Finney and G. R. Finke, Chem. Mater., 2009, 21, 4468–4479 CrossRef CAS.
- J. F. Gerard, J. Galy, J. P. Pascault, S. Cukierman and J. L. Halary, Polym. Eng. Sci., 1991, 31, 615–621 CrossRef CAS.
- J. S. Nakka, K. Jansen, L. J. Ernst and W. F. Jager, J. Appl. Polym. Sci., 2008, 108, 1414–1420 CrossRef CAS.
- J. Wan, C. Li, Z. Y. Bu, C. J. Xu, B. G. Li and H. Fan, Chem. Eng. J., 2012, 188, 160–172 CrossRef CAS.
- J. D. Lemay and F. N. Kelley, Adv. Polym. Sci., 1986, 78, 115–148 CrossRef CAS.
|
| This journal is © The Royal Society of Chemistry 2022 |
Click here to see how this site uses Cookies. View our privacy policy here.  Open Access Article
 a,
Lu Tana,
Hongxing Dong*b,
Wenshan Qua and
Jianguo Zhao*a
![[thin space (1/6-em)]](https://www.rsc.org/images/entities/char_2009.gif) δ) than the neat E44 and CMC/E44 systems.
δ) than the neat E44 and CMC/E44 systems.![[thin space (1/6-em)]](https://www.rsc.org/images/entities/char_2009.gif) :
:![[thin space (1/6-em)]](https://www.rsc.org/images/entities/char_2009.gif) 23.3 (the ratio was obtained by experimentation and stoichiometry). The CMC/CNTs/E44/DDM system was stirred at high speed for about two hours to ensure uniform dispersion of CMC and CNTs in the system. The sample CMC/CNTs/E44/DDM was stored in a cool place for 24 h, after which it was analyzed using DSC, which can ensure the accuracy of the result. The E44 and CMC/E44 systems were also analyzed.
23.3 (the ratio was obtained by experimentation and stoichiometry). The CMC/CNTs/E44/DDM system was stirred at high speed for about two hours to ensure uniform dispersion of CMC and CNTs in the system. The sample CMC/CNTs/E44/DDM was stored in a cool place for 24 h, after which it was analyzed using DSC, which can ensure the accuracy of the result. The E44 and CMC/E44 systems were also analyzed.


![[thin space (1/6-em)]](https://www.rsc.org/images/entities/char_2009.gif) A, and E and regression parameters R and RMSE for the autocatalytic model using the Levenberg–Marquardt method
A, and E and regression parameters R and RMSE for the autocatalytic model using the Levenberg–Marquardt method
![[thin space (1/6-em)]](https://www.rsc.org/images/entities/char_2009.gif) A (min−1)
A (min−1)


![[thin space (1/6-em)]](https://www.rsc.org/images/entities/char_2009.gif)
![[thin space (1/6-em)]](https://www.rsc.org/images/entities/char_2009.gif)


![[thin space (1/6-em)]](https://www.rsc.org/images/entities/char_2009.gif) A = aE + b
A = aE + b
![[thin space (1/6-em)]](https://www.rsc.org/images/entities/char_2009.gif) A vs. α can be described by a polynomial and the relationships are assumed to be:
A vs. α can be described by a polynomial and the relationships are assumed to be:![[thin space (1/6-em)]](https://www.rsc.org/images/entities/char_2009.gif) A = p1 + p2α + p3α2 + p4α3
A = p1 + p2α + p3α2 + p4α3

![[thin space (1/6-em)]](https://www.rsc.org/images/entities/char_2009.gif) δ) of the E44, CMC/E44 and CMC/CNTs/E44 networks at a heating rate of 3 K min−1 (1 Hz), where Em and tan
δ) of the E44, CMC/E44 and CMC/CNTs/E44 networks at a heating rate of 3 K min−1 (1 Hz), where Em and tan![[thin space (1/6-em)]](https://www.rsc.org/images/entities/char_2009.gif) δ are plotted as a function of temperature. Table 3 shows the values of the characteristic relaxation temperatures and modulus as drawn from Fig. 15. As shown in Fig. 15 and Table 3, Em decreases with increasing temperature. As temperature rises, a peak for tan
δ are plotted as a function of temperature. Table 3 shows the values of the characteristic relaxation temperatures and modulus as drawn from Fig. 15. As shown in Fig. 15 and Table 3, Em decreases with increasing temperature. As temperature rises, a peak for tan![[thin space (1/6-em)]](https://www.rsc.org/images/entities/char_2009.gif) δ appears between 80 °C and 200 °C, which is related to the α-relaxation of the epoxy network. Em and tan
δ appears between 80 °C and 200 °C, which is related to the α-relaxation of the epoxy network. Em and tan![[thin space (1/6-em)]](https://www.rsc.org/images/entities/char_2009.gif) δ showed dramatic changes in this temperature range, attributed to the glass–rubber transition of the epoxy E44, CMC/E44 and CMC/CNTs/E44 networks and the transition of the glassy epoxy network to highly elastic rubber. The temperature of the tan
δ showed dramatic changes in this temperature range, attributed to the glass–rubber transition of the epoxy E44, CMC/E44 and CMC/CNTs/E44 networks and the transition of the glassy epoxy network to highly elastic rubber. The temperature of the tan![[thin space (1/6-em)]](https://www.rsc.org/images/entities/char_2009.gif) δ peak is taken as the glass transition temperature (Tg).
δ peak is taken as the glass transition temperature (Tg).

![[thin space (1/6-em)]](https://www.rsc.org/images/entities/char_2009.gif) δ, against temperature.
δ, against temperature.![[thin space (1/6-em)]](https://www.rsc.org/images/entities/char_2009.gif) δ of E44, CMC/E44 and CMC/CNTs/E44 are contrasted in Fig. 15 and Table 3, indicating that CMC/E44 has a higher value of Em in the temperature range of 50–100 °C compared to that of E44 and CMC/CNTs/E44. The Tg of the CMC/CNTs/E44 and CMC/E44 systems are 162 °C and 152 °C, respectively, which are higher than the Tg of E44 (137 °C). Compared with E44 and CMC/E44, the tan
δ of E44, CMC/E44 and CMC/CNTs/E44 are contrasted in Fig. 15 and Table 3, indicating that CMC/E44 has a higher value of Em in the temperature range of 50–100 °C compared to that of E44 and CMC/CNTs/E44. The Tg of the CMC/CNTs/E44 and CMC/E44 systems are 162 °C and 152 °C, respectively, which are higher than the Tg of E44 (137 °C). Compared with E44 and CMC/E44, the tan![[thin space (1/6-em)]](https://www.rsc.org/images/entities/char_2009.gif) δ of CMC/CNTs/E44 increased obviously. The rubbery modulus, Er, shown in Table 3, is the storage modulus at 30 °C above Tg.34–36 CMC/CNTs/E44 has a higher Er than neat epoxy E44, which probably indicates that the CMC/CNTs/E44 system has a higher crosslink density. Resins with higher crosslink density show higher mechanical and thermal properties. For quantification, the crosslink density was estimated from eqn (18):35–37
δ of CMC/CNTs/E44 increased obviously. The rubbery modulus, Er, shown in Table 3, is the storage modulus at 30 °C above Tg.34–36 CMC/CNTs/E44 has a higher Er than neat epoxy E44, which probably indicates that the CMC/CNTs/E44 system has a higher crosslink density. Resins with higher crosslink density show higher mechanical and thermal properties. For quantification, the crosslink density was estimated from eqn (18):35–37![[thin space (1/6-em)]](https://www.rsc.org/images/entities/char_2009.gif) δ.
δ.


