 Open Access Article
Feasibility study on further enhanced oil recovery by ISC of remaining oil after polymer flooding
Fajun Zhao *a,
Guangmeng Zhua,
Guo Lib,
Yifan Jianga and
Lei Liua
aKey Laboratory of Entered Oil Recovery of Education Ministry, Northeast Petroleum University, Daqing, Heilongjiang 163318, China. E-mail: fajzhao@126.com
bPetroleum Production Engineering Research Institute of PetroChina, Daqing Oilfield Company, Daqing, Heilongjiang 163453, China
First published on 24th June 2022
Abstract
The residual oil after polymer flooding in China is highly dispersed. The reservoir's interlayer and intralayer contradictions are prominent, the polymer flooding efficiency is significantly reduced, and the exploitation difficulty is increased. An indoor physical simulation experiment of undertaking fire flooding after polymer flooding is conducted to investigate the recovery measures that can undertake polymer flooding and further improve the recovery degree of residual oil. The stability of the combustion front and the basic parameters of in situ combustion (ISC) were studied, and the crude oil properties before and after the fire flooding were analyzed. The results show that the temperature range and variation trend of the combustion front in the polymer flooding-to-fire flooding experiment are similar to those in the conventional fire flooding experiment. The combustion front advances steadily, indicating that the residual oil can be burned effectively after polymer flooding, providing an application basis for fire flooding. The calculated apparent H/C atomic ratio through the tail gas composition is 1.33, which further demonstrates that a high-temperature oxidation reaction occurs at the combustion front, and the displacement efficiency of the burned oil layer is 72.1%. A comparison of the oil samples before and after fire flooding shows that the carbon number of n-alkanes in the oil produced after fire flooding increases, improving the quality of crude oil.
1 Introduction
Currently, the production of onshore thin oil reservoirs in China has been significantly improved after stimulation measures, such as polymer flooding. When the reservoir developed by polymer flooding enters the middle and later stages, the effect of polymer injection increasingly becomes worse, and the water content in the produced fluid increases. Maintaining economic and effective development with continuous polymer injections is difficult. However, a considerable amount of crude oil remains in the formation after polymer flooding. Therefore, replacement technology research has very far-reaching significance. In situ combustion (ISC) technology has various applications and is often used in primary or secondary oil production. It has proved relatively flawless as a mining technology for ordinary heavy oil and some extra-heavy oil reservoirs following years of research.The two development methods of ISC and low-temperature oxidation of air injection are the two main branch technologies of air injection oil recovery.1 These two technologies have different characteristics and mechanisms. The low-temperature oxidation technology of dilute oil injection air involves injecting air into the original reservoir, releasing a certain amount of heat through the low-temperature oxidation reaction to maintain and improve the reaction zone's temperature, causing the formation oil temperature to increase and viscosity to decrease, and effectively consuming oxygen to generate CO2. The CO2 dissolves in crude oil to improve the formation energy and further reduce the viscosity of the formation oil. Its development mechanism is a combination of a flue gas drive and partial thermal effect.2–4 If low-temperature oxidation reactions do not consume all the oxygen in the formation, the oxygen concentration in the production well will reach 10%, posing safety risks.5,6 The ISC involves the formation of a high-temperature combustion front with a temperature higher than 350 °C by artificial ignition to realize the combustion and heat release in the oil layer and push the crude oil from the gas injection well to the production well.7,8 The ISC has a high recovery factor, good thermal efficiency, and several applications.9–12 If the ISC is introduced into a light oil reservoir and oxygen is rapidly consumed using a high-temperature combustion front, it can solve the problem of oxygen safety in the light oil injection air on the one hand, and improve the crude oil recovery factor on the other hand.13–28
Therefore, the ISC technology can be used as a polymer-flooding technology replacement method to further improve oil recovery. However, studies on whether the ISC technology is suitable for thin oil reservoirs after polymer flooding are limited. Thus, the characteristics of the combustion parameters of the thin oil after polymer flooding, the composition of the produced oil, and the compositional changes of the functional groups must be investigated. In this study, a one-dimensional combustion tube was used to simulate the experiment of ISC in a thin oil reservoir after polymer flooding. The combustion law can be investigated using combustion experiments, and the basic combustion parameters, such as fuel consumption, fuel apparent H/C atomic ratio, and oil displacement efficiency, can be clarified. The stability of the combustion process can also be assessed by the temperature of the combustion front.
2 Experimental section
2.1 Experimental apparatus and instruments
The physical simulation experimental system of ISC mainly includes a gas injection system, ignition system, model ontology, data acquisition system, output liquid–gas separation, and recovery system, and Fig. 1 shows a schematic of the one-dimensional physical simulation experimental setup of ISC. The model body has rotation function, and can carry out dry and wet burning oil reservoir simulation experiments under different formation conditions. There are 20 temperature sensors distributed along the axis. The electric heating rod is inserted near the side of the simulated gas injection well, and the ignition system is connected with the regulator and power supply. The ignition temperature is controlled by the ignition system during the experiment. The air injection system is composed of air compressor and flow meter, which can meet the needs of adjusting the air injection intensity in the experimental process, and realize the accurate measurement and control of the air injection rate. The data acquisition system composed of thermocouple, data acquisition board and computer can display and automatically record the temperature change of each temperature measurement point in the experimental process. The geometric dimensions of the model body is 120 cm × 8 cm, the maximum working pressure of the model is 10 MPa, the maximum working temperature is 1000 °C.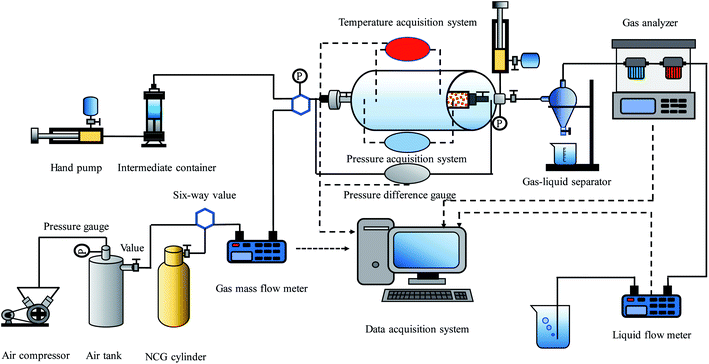 | ||
| Fig. 1 Illustration of one-dimensional physical simulation experiment device for in situ combustion. | ||
2.2 Experimental preparation and method
| Type | Experimental parameters | Value |
|---|---|---|
| Crude oil | Density/(g cm−3) | 0.8724 |
| Viscosity/mPa s (50 °C) | 62.00 | |
| Experimental sand | Density/(g cm−3) | 2.47 |
| Number | Experimental parameters | ISC | ISC after polymer flooding |
|---|---|---|---|
| 1 | Ventilation intensity N m3/(m2 h) | 60.00 | 60.00 |
| 2 | Permeability/μm2 | 2.33 | 2.12 |
| 3 | Porosity/% | 31.85 | 32.94 |
| 4 | Oil saturation/% | 45.02 | 31.83 |
| 5 | Water content saturation/% | 54.98 | 68.17 |
| 6 | Ignition temperature/°C | 500.00 | 500.00 |
| 7 | Pressure/MPa | 5.00 | 5.00 |
2.3 Experimental procedure
(1) The prepared oil sands were loaded into the model; (2) model sealing, N2 injection for connectivity test between injection and mining, and gas tightness test; (3) debugging the temperature acquisition system and establishing the initial temperature field in the process of N2 injection, debugging the measurement and control system and preparing the connection of the output system; (4) starting the ignition and gas injection system, when the ignition temperature reaches 500 °C, the injected gas is changed from N2 to air, and the physical simulation experiment of burning oil layer is carried out; (5) ventilation was continued even after the combustion was completed to bring the temperature of the model body down to room temperature.2.4 Analytical test methods
The composition of the group in crude oil was determined using silica gel and alumina as adsorbents, and the results were compared with the standard. The saturated hydrocarbon, aromatic hydrocarbon, and nonhydrocarbon fractions were washed out, separated, and weighed to obtain the content of each component in the specimen using solvents of different polarities.A 0.2–1.0 μL sample (which should be heated to no more than 50 °C and injected with an equal volume of CS2 solvent) is extracted using a microsyringe and injected, while the program for temperature increase and chromatography is initiated, and the chromatogram and raw data are recorded.
Oil sand samples (about 1 mg) were thoroughly mixed with dried spectrally pure-grade KBr powder (about 100 mg) and ground in a dry environment with an agate mortar, finely mixed and transferred to a mold, put in a press bar, and then put on an oil press at a pressure of 10 t cm−2 for 5 min to obtain a transparent flake for infrared spectrum detection.
3 Experimental results and analysis
3.1 Evaluation of combustion stability
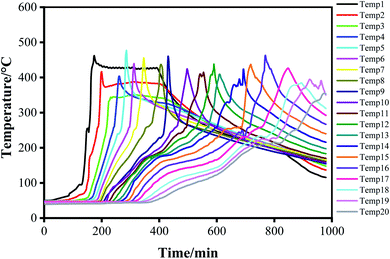
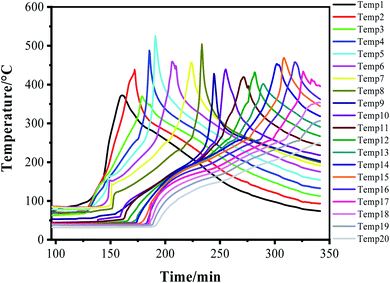
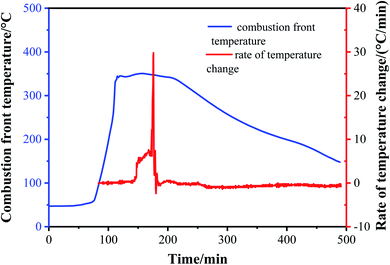
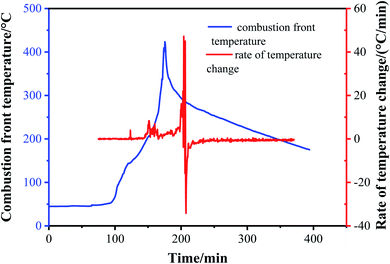
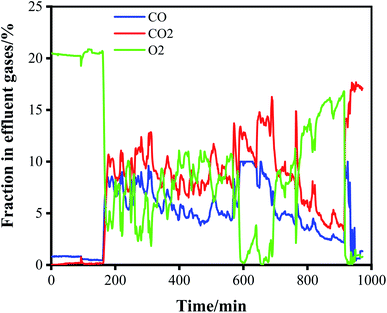
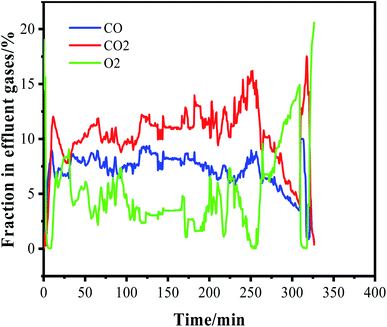
Table 3 shows the basic parameters of the two groups of fire flooding experiments. The apparent H/C atomic ratio of the two groups of experiments is greater than 1 and less than 3, implying that their oxygen usage rate is greater than 85%, indicating that the high-temperature oxidation reaction dominates the fire flooding process. Compared with the experimental parameters of fire flooding, the fuel consumption of polymer flooding to fire flooding is lower, the air consumption, and stage air–oil ratio of polymer flooding to fire flooding are higher, and the fire line propulsion speed is similar. The oil displacement efficiency of polymer flooding to fire flooding is 72.1%, which is lower than 78.16% of the oil displacement efficiency of the fire flooding experiment. This is because the remaining oil after polymer flooding is more dispersed, with low saturation. Although the remaining oil consumes similar quality crude oil and has similar displacement ability in the low-temperature oxidation stage, less crude oil may be displaced by fire due to the lower initial oil saturation, resulting in low displacement efficiency. The remaining oil sands from the fire flooding were removed at the end of the experiment and the distribution of the oil sands after the fire flooding was observed; the oil sands after the fire flooding turned white, the chloroform asphalt measurement was performed, and the results showed that the remaining oil content saturation was close to 0. This implies that except for the displaced crude oil, the other crude oil is consumed by the combustion reaction, rather than remaining in the pores. The combustion reaction is sufficient and is unaffected by the residual formation water in the formation after polymer flooding, demonstrating the feasibility of the fire flooding experiment after dilute-oil polymer flooding.
| Serial number | Basic parameters of fire experiment | ISC | ISC after polymer flooding |
|---|---|---|---|
| 1 | H/C atomic ratio | 1.16 | 1.33 |
| 2 | Fuel consumption/(kg m−3) | 24.72 | 23.10 |
| 3 | Air consumption/L | 246 | 260 |
| 4 | Fuel consumption rate/% | 21.84 | 27.90 |
| 5 | Stage air-to-oil ratio AORs (m3 t−1) | 2825.29 | 4354.96 |
| 6 | Fireline propulsion speed (cm h−1) | 0.40 | 0.38 |
| 7 | Oil-displacement efficiency/% | 78.16 | 72.10 |
3.2 Analysis of crude oil properties before and after fire flooding
| Carbon distribution of hydrocarbons | Content/% | |
|---|---|---|
| Crude oil | After polymer flooding + fire flooding produced oil | |
| <C10 | 6.21 | 3.07 |
| C10–C15 | 27.97 | 35.71 |
| C16–C20 | 27.4 | 27.77 |
| C21–C25 | 22.88 | 19.63 |
| C26–C30 | 11.02 | 9.55 |
| C31–C35 | 4.24 | 3.67 |
| >C35 | 0.28 | 0.61 |
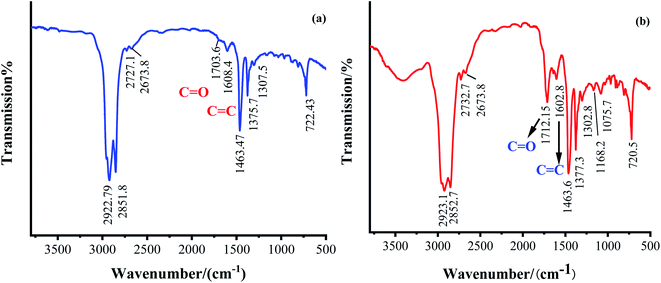
![[double bond, length as m-dash]](https://www.rsc.org/images/entities/char_e001.gif) C double bond of an aromatic skeleton, and 1700 cm−1 corresponds to the stretching vibrational absorption peak of the carbonyl group (C
C double bond of an aromatic skeleton, and 1700 cm−1 corresponds to the stretching vibrational absorption peak of the carbonyl group (C![[double bond, length as m-dash]](https://www.rsc.org/images/entities/char_e001.gif) O) in esters, ketones, and acid alcohols, and the change in absorption intensity at the 1700 cm−1 band is usually selected to correspond to the degree of crude oil oxidation. Fig. 10 shows that there is no absorption peak at 1700 cm−1 for crude oil, and the remaining oil after polymer flooding followed by fire flooding produced oil shows an obvious absorption peak at 1700 cm−1, indicating that the fire flooding experiment of the remaining oil after polymer flooding can still maintain a high degree of oxidation. The ratio of A1700 to A1600 is used as the oxygen content (IO) parameter in the infrared spectra, that is, the parameter in crude oil is 0.923, and that in output oil is 1.179.11 This indicates that the oxidation reaction of crude oil is more intense during the fire flooding, and the combustion process is in the high-temperature oxidation stage, which generates functional groups with carbonyl groups, such as aldehydes, ketones, and carboxyl groups.
O) in esters, ketones, and acid alcohols, and the change in absorption intensity at the 1700 cm−1 band is usually selected to correspond to the degree of crude oil oxidation. Fig. 10 shows that there is no absorption peak at 1700 cm−1 for crude oil, and the remaining oil after polymer flooding followed by fire flooding produced oil shows an obvious absorption peak at 1700 cm−1, indicating that the fire flooding experiment of the remaining oil after polymer flooding can still maintain a high degree of oxidation. The ratio of A1700 to A1600 is used as the oxygen content (IO) parameter in the infrared spectra, that is, the parameter in crude oil is 0.923, and that in output oil is 1.179.11 This indicates that the oxidation reaction of crude oil is more intense during the fire flooding, and the combustion process is in the high-temperature oxidation stage, which generates functional groups with carbonyl groups, such as aldehydes, ketones, and carboxyl groups.
4 Conclusion
The experiment of fire flooding after polymer flooding was conducted in a one-dimensional combustion tube, and the following conclusions were drawn:(1) The basic parameters of the fire flooding after the polymer flooding in the thin oil reservoir are examined using the temperature curve of the combustion front, the change curve of the tail gas, and the change in the crude oil composition before and after the fire flooding. The residual oil after the polymer flooding in the thin oil reservoir can still ignite and effectively and stably maintain the combustion state throughout the process. The combustion reaction is sufficient and the formation of residual water is unaffected by the polymer flooding.
(2) The remaining oil saturation after polymer flooding affects the threshold temperature of crude oil, fuel consumption, and other basic combustion parameters. The recovery efficiency of the burned oil layer is increased by 72.1% after polymer flooding, which is lower than that of direct crude oil by 78.16%. This is caused by low oil saturation, although fire flooding as a replacement technology for polymer flooding in thin oil reservoirs still has practical value.
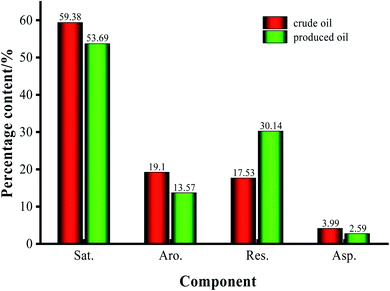
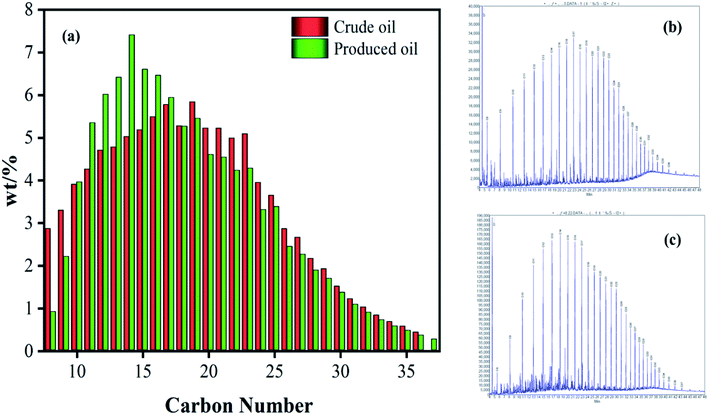
(3) A comparison of the group composition and total hydrocarbon chromatogram of oil samples before and after burning oil layers reveals that after polymer flooding, the heavy components of produced oil decrease, light hydrocarbons increase, and the quality of crude oil improve. A comparison of the infrared spectra of oil samples before and after the reaction reveals that the residual oil after polymer flooding can still maintain a high degree of oxidation in the fire flooding experiment.
(4) This study is extremely useful for clarifying the feasibility of fire flooding in reservoirs after polymer flooding and investigating the influencing factors of reservoir changes on fire flooding effect after polymer flooding. It provides a significant experimental foundation and a high reference value for further research on fire flooding as a polymer flooding replacement technology for improving oil recovery in thin oil reservoirs.
Conflicts of interest
We declare that we have no financial and personal relationships with other people or organizations that can inappropriately influence our work, there is no professional or other personal interest of any nature or kind in any product, service and/or company that could be construed as influencing the position presented in, or the review of, the manuscript entitled “Feasibility study on further enhanced oil recovery by ISC of remaining oil after polymer flooding”.Acknowledgements
This work was supported by the National Science and Technology Major Projects of China for Oil and Gas (Projects No. 2016ZX05055 and 2016ZX05012).References
- J. X. Wang, G. R. Xu and Z. J. Fu, et al., LTO laboratory experiments and reservoir selection criteria of air injection, Pet. Geol. Recovery Effic., 2008, 15(1), 69–71 CAS
.
- F. J. Zhao, Y. J. Liu and N. Lu, et al., A review on upgrading and viscosity reduction of heavy oil and bitumen by underground catalytic cracking, Energy Rep., 2021, 7(10), 4249–4272 CrossRef
.
- Y. W. Jiang, Y. T. Zhang and S. Q. Liu, et al., Mechanisms of oil drive for air injection development in low permeability reservoirs, Pet. Explor. Dev., 2021, 37(4), 471–476 Search PubMed
.
- S. R. Ren, C. H. Yang and S. M. Hou, et al., Exploration of the relationship between gas injection volume and air drive mechanism in light reservoirs, J. China Univ. Pet., Ed. Nat. Sci., 2012, 36(3), 121–125 Search PubMed
.
- H. B. Al-Saffar, H. Hasanin and D. Price, et al., Oxidation Reactions of a Light Crude Oil and Its SARA Fractions in Consolidated Cores, Energy Fuels, 2001, 15(1), 182–188 CrossRef CAS
.
- Z. Wang, G. Liao and W. Pu, et al., Oxidation reaction features of formation crude oil in air injection development, Acta Pet. Sin., 2018, 39(3), 314–319 Search PubMed
.
- W. Pu, S. Zhao and L. Hu, et al., Thermal effect caused by low temperature oxidation of heavy crude oil and its in situ combustion behavior, J. Pet. Sci. Eng., 2019, 184, 106521 CrossRef
.
- S. Bagci and M. V. Kok, In situ combustion laboratory studies of Turkish heavy oil reservoirs, Fuel Process. Technol., 2001, 74(2), 65–79 CrossRef CAS
.
- J. P. Kisler and D. C. S. Member, An Improved Model for the Oxidation Processes of Light Crude Oil, Chem. Eng. Res. Des., 1997, 75(4), 392–400 CrossRef CAS
.
- N. K. Gargar, A. A. Mailybaev and M. Dan, et al., Effects of water on light oil recovery by air injection, Fuel, 2014, 137, 200–210 CrossRef
.
- H. Q. Cheng, High-Temperature oxidation identification in fire-flooding, Spec. Oil Gas Reservoirs, 2018, 25(128), 135–139 Search PubMed
.
- H. Q. Cheng, Q. H. Zhao and B. L. Liu, et al., Physical simulation research on basic parameters of in situ combustion for super heavy oil reservoirs, Spec. Oil Gas Reservoirs, 2012, 19(4), 107–110 Search PubMed
.
- R. G. Moore, S. A. Mehta and M. G. Ursenbach, A guide to high pressure air injection (HPAI) based oil recovery. SPE75207, 2002 Search PubMed
.
- M. G. Ursenbach, R. G. Moore and S. A. Mehta, Air injection in heavy oil reservoirs-a process whose time has come(again), J. Can. Pet. Technol., 2010, 49(1), 48–54 CrossRef CAS
.
- W. F. Pu, S. Zhao and J. J. Pan, et al., Effect of low-temperature oxidation of light oil on oil recovery during high pressure air injection, Pet. Sci. Technol., 2018, 1–7 Search PubMed
.
- J. Li, S. A. Mehta and R. G. Moore, et al., New insights into oxidation behaviours of crude oils, J. Can. Pet. Technol., 2009, 48(9), 12–15 CrossRef CAS
.
- H. K. Sarma, N. Yazawan and R. G. Moore, et al., Screening of three light-oil reservoirs for application of air injection process by accelerating rate calorimetric and TG/PDSC tests, J. Can. Pet. Technol., 2002, 41(3), 50–61 CAS
.
- Z. Chen, W. Lei and Q. Duan, et al., High-Pressure Air Injection for Improved Oil Recovery: Low-Temperature Oxidation Models and Thermal Effect, Energy Fuels, 2013, 27, 780–786 CrossRef CAS
.
- J. Li, S. A. Mehta and R. G. Moore, et al., Investigation of the oxidation behavior of pure hydrocarbon components and crude oils utilizing PDSC thermal technique, J. Can. Pet. Technol., 2006, 45(1), 48–53 Search PubMed
.
- H. Jia, J. Z. Zhao and W. F. Pu, et al., Thermal study on light crude oil for application of high-Pressure air injection (HPAI) process by TG/DTG and DTA tests, Energy Fuels, 2012, 26(3), 1575–1584 CrossRef CAS
.
- S. Huang, Y. Zhang and J. J. Sheng, Experimental Investigation of Enhanced Oil Recovery Mechanisms of Air Injection under a Low-Temperature
Oxidation Process: Thermal Effect and Residual Oil Recovery Efficiency, Energy Fuels, 2018, 32(6), 6774–6781 CrossRef CAS
.
- C. Clara, M. Durandeau and G. Quenault, et al., Laboratory studies for light-oil air injection projects:potential application in handily field, SPE Reservoir Eval. Eng., 2000, 3(3), 239–248 CrossRef CAS
.
- T. Teramoto, H. Uematsu, K. Takabayashi and T. Onishi, Air injection EOR in highly water saturated light-oil reservoir. SPE100215, 2006 Search PubMed
.
- Z. Xu, Y. L. Jian and T. S. Liang, Research on the mechanisms of enhancing recovery of light-oil reservoir by air-injected low-temperature oxidation technique, Nat. Gas Ind., 2004, 24(4), 78–80 Search PubMed
.
- A. Askarova, E. Popov and M. Ursenbach, et al., Experimental Investigations of Forward and Reverse Combustion for Increasing Oil Recovery of a Real Oil Field, Energies, 2020, 13(17), 4581 CrossRef CAS
.
- Y. Liu, F. J. Zhao and Y. X. Wu, et al., Study on the application of a steam-foam drive profile modification technology for heavy oil reservoir development, Open Chem., 2021, 19(1), 678–685 CrossRef CAS
.
- R. B. Zhao, Y. G. Wei and Z. M. Wang, et al., Kinetics of Low-Temperature Oxidation of Light Crude Oil, Energy Fuels, 2016, 30(4), 2647–2654 CrossRef CAS
.
- Z. Y. Chen, B. L. Niu and L. Z. Tang, et al., Experimental study of low temperature oxidation mechanism and activity of oil components, J. Fuel Chem. Technol., 2013, 41(11), 1336–1342 CAS
.
| This journal is © The Royal Society of Chemistry 2022 |

