 Open Access Article
Synthesis and mechanism of biological action of morpholinyl-bearing arylsquaramides as small-molecule lysosomal pH modulators†
Tao Zhang‡
a,
Xiao-Qiao Hong‡b,
Hai-Tao Zhia,
Jinhui Hu*a and
Wen-Hua Chen *a
*a
aSchool of Biotechnology and Health Sciences, Wuyi University, Jiangmen 529020, Guangdong, P. R. China. E-mail: whchen@wyu.edu.cn
bSchool of Pharmaceutical Sciences, Tsinghua University, Haidian Dist, Beijing 100084, P. R. China
First published on 15th August 2022
Abstract
Lysosomal pH is an important modulator for many cellular processes. An agent that is capable of regulating lysosomal pH may find a wide range of potential applications in the field of biomedicine. In this study, we describe the synthesis of a family of morpholinyl-bearing arylsquaramides as small-molecule lysosomal pH modulators. These compounds are able to efficiently facilitate the transmembrane transport of chloride anions as mobile carriers across vesicular and cellular phospholipid membranes. They are capable of specifically alkalizing liposomes, disrupting the homeostasis of lysosomal pH and inactivivating lysosomal Cathepsin B enzyme. Anion transport is considered as the probable mechanism of action for the high efficiency of these compounds to modulate lysosomal pH. The present findings present a novel means to efficiently regulate lysosomal pH, which is in contrast to the methods shown by conventional lysosomal pH modulators that generally function by either acting as a weak base/acid, or releasing a basic/acidic component in lysosomal environments to change lysosomal pH.
1. Introduction
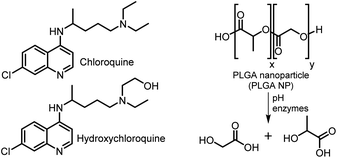
It is known that lysosomes are membrane-bound subcellular organelles and maintain cellular homeostasis by generating a highly acidic environment.1 Lysosomal enzymes are responsible for breaking down carbohydrates, nucleic acids, lipids and proteins,2–6 and usually exert the maximal activity in an acidic environment (pH 4.5–5.0).7–14 Leakage of protons due to a defective proton pump or lysosomal permeabilization would lead to lysosomal alkalization and consequently a decrease or deactivation in the activity of lysosomal hydrolytic enzymes.15,16 Thus, modulating lysosomal pH may serve as a practical strategy for regulating cellular processes as well as for developing therapeutic agents for lysosome-involved diseases.It is reported that some agents are able to specifically modulate lysosomal pH.1 These so-called lysosomal pH modulators generally function by acting as a weak base/acid, or releasing a basic/acidic component in lysosomal environments to elevate/lower lysosomal pH.1 For example, chloroquine and hydroxychloroquine inhibit lysosomal acidification through elevating lysosomal pH,17–19 whereas poly(lactic-co-glycolic acid) (PLGA) degrades in an acidic environment to release lactic and glycolic component carboxylic acids to lower lysosomal pH (Fig. 1).20–22 In contrast to these conventional lysosomal pH modulators, in previous studies we introduced the concept of “lysosome-targeting anionophores”, whereby arylsquaramides bearing fluorescent coumarinyl and lysosome-targeting morpholinyl subunits (e.g., compound A, Fig. 2),23,24 are used to target lysosomes and disrupt the homeostasis of anions within liposomes. Significantly, we have found that such squaramides are able to elevate lysosomal pH,23,24 and that enhancing their anion transport activity is favorable to the efficiency to alkalize lysosomes. This represents a novel approach to efficiently alter lysosomal pH.24
 | ||
| Fig. 2 Structures of compounds A and 1–12. For the specific substituents R1 and R2, see Scheme 1. | ||
In the work reported herein, we sought to gain insight into the correlation between anion transport activity and lysosomal pH-regulating efficiency, and to better characterize the lysosomal pH-modulating properties. Specifically, we designed and synthesized a family of morpholinyl-bearing arylsquaramides with no fluorophores (i.e., compounds 1–12, Fig. 2), and systematically investigated their capability and probable mechanism of biological action to modulate lysosomal pH by facilitating the transmembrane transport of anions across vesicular and cellular phospholipid membranes.
2. Results and discussion
2.1 Synthesis
Compounds 1–12 were synthesized as shown in Scheme 1. Thus, reaction of substituted anilines with excess diethyl squarate under the catalysis of Zn(CF3SO3)2 gave compounds 13–24.25–28 Reaction of compounds 13–24 with excess N-(2-aminoethyl)morpholine under the catalysis of Zn(CF3SO3)2 afforded compounds 1–12. The structures of compounds 1–12 were confirmed by means of NMR (1H and 13C) and ESI MS (LR and HR) (see experimental section and Fig. S1–S52†).2.2 Anion transport
| Compound | R1 | R2 | Lipophilicity (c![[thin space (1/6-em)]](https://www.rsc.org/images/entities/char_2009.gif) log log![[thin space (1/6-em)]](https://www.rsc.org/images/entities/char_2009.gif) Pa) Pa) |
Chloride transportb | |
|---|---|---|---|---|---|
| ΔRCl− efflux (%)c | EC50 (mol%, ISE)d | ||||
a Calculated using MarvinSketch (Version 6.1.0, weighted Model, ChemAxon, MA).b Measured on liposomal models by means of chloride ion selective electrode (ISE) techniques, under the conditions of an intravesicular 500 mM NaCl solution (25 mM HEPES buffer) and extravesicular 500 mM NaNO3 solution (25 mM HEPES buffer).c ΔRCl−efflux = RCl−efflux [5.0 mol% compound]260 s − RCl−efflux [DMSO]260 s.d Compound A with a c![[thin space (1/6-em)]](https://www.rsc.org/images/entities/char_2009.gif) log log![[thin space (1/6-em)]](https://www.rsc.org/images/entities/char_2009.gif) P of 3.71 has an EC50 of 0.73 ± 0.28 mol% under the same assay conditions.e Hill analysis not performed due to very low transport activity.f Estimated due to low to moderate transport activity. P of 3.71 has an EC50 of 0.73 ± 0.28 mol% under the same assay conditions.e Hill analysis not performed due to very low transport activity.f Estimated due to low to moderate transport activity. |
|||||
| 1 | H | H | 0.79 | 2.4 ± 0.79 | NAe |
| 2 | OCH3 | H | 0.64 | 0.7 ± 0.16 | NAe |
| 3 | CH3 | H | 1.31 | 0.5 ± 0.01 | NAe |
| 4 | F | H | 0.94 | 3.3 ± 0.01 | NAe |
| 5 | Cl | H | 1.40 | 6.2 ± 0.59 | NAe |
| 6 | Br | H | 1.56 | 12.6 ± 0.19 | >10f |
| 7 | CN | H | 0.65 | 10.4 ± 1.40 | >10f |
| 8 | NO2 | H | 0.73 | 54.3 ± 2.00 | 3.87 ± 0.19 |
| 9 | CF3 | H | 1.67 | 11.9 ± 1.04 | > 10f |
| 10 | H | Cl | 2.00 | 28.5 ± 1.75 | 6.81 ± 0.29 |
| 11 | H | NO2 | 0.67 | 50.1 ± 1.56 | 4.19 ± 0.18 |
| 12 | H | CF3 | 2.55 | 58.6 ± 3.30 | 4.46 ± 0.29 |
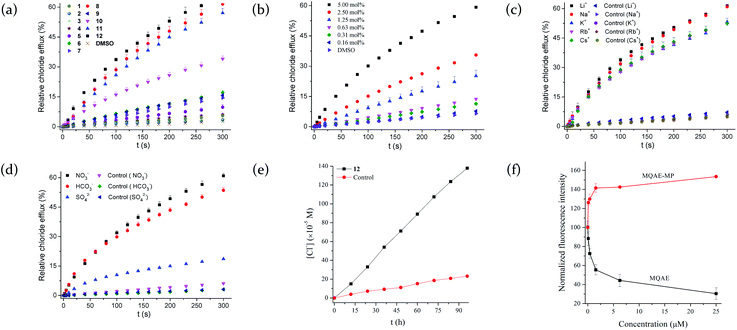
To quantitatively characterize the efficiency of the compounds showing relatively high chloride efflux activity, we carried out the concentration-dependent experiments and analyzed the relationship between the relative chloride efflux at 260 s and the concentrations of each compound, by using a Hill equation, relative chloride efflux = kmax × [compound]n/{[compound]n + (EC50)n}. This analysis gives the EC50 value of each compound that is defined as the effective transporter loading when 50% of the maximum chloride efflux is reached. As shown in Table 1, compounds 8, 11 and 12 exhibit relatively high activity. It should be noted that these compounds are 5–6-fold less active than compound A, which may be ascribed to their lower lipophilicity relative to compound A.32
To clarify whether the chloride efflux activity is authentic, we chose compound 12 to measure its effect on the size distribution and integrity of the EYPC vesicles (Fig. S54 and S55†). As a result, the diameters of the vesicles were 117.2 ± 30.8 nm and 113.3 ± 37.9 nm in the absence and presence of 5 mol% of compound 12, respectively (Table S1†). This result suggests that compound 12 has no effect on the size distribution of the vesicles. Study by means of calcein leakage assay reveals that no calcein was leaked from the vesicles after the addition of compound 12.30,32 These results suggest that compound 12 has no effect on the integrity of vesicles and the observed chloride efflux is authentic.
Taken together, the above-mentioned results suggest that compound 12 facilitates the transport of chloride anions across phospholipid membranes as a mobile carrier via the process of an anion exchange.
Since compound 12 has lysosome-targeting morpholinyl groups, we used MQAE-MP assays to explore its ability to facilitate the transport of chloride anions across lysosomal membranes.39 MQAE-MP is an MQAE derivative that is able to specifically accumulate in lysosomes and has been used to detect the change in the concentration of chloride anions in lysosomes.40 As shown in Fig. 3f, treatment of HeLa cells with compound 12 and subsequent incubation with MQAE-MP, led to a concentration-dependent increase in the fluorescence of MQAE-MP, indicative of a decrease in the concentration of chloride anions in lysosomes. The result lends strong support that compound 12 is able to mediate the efflux of chloride anions out of lysosomes.
2.3 Lysosomal pH-modulating effect
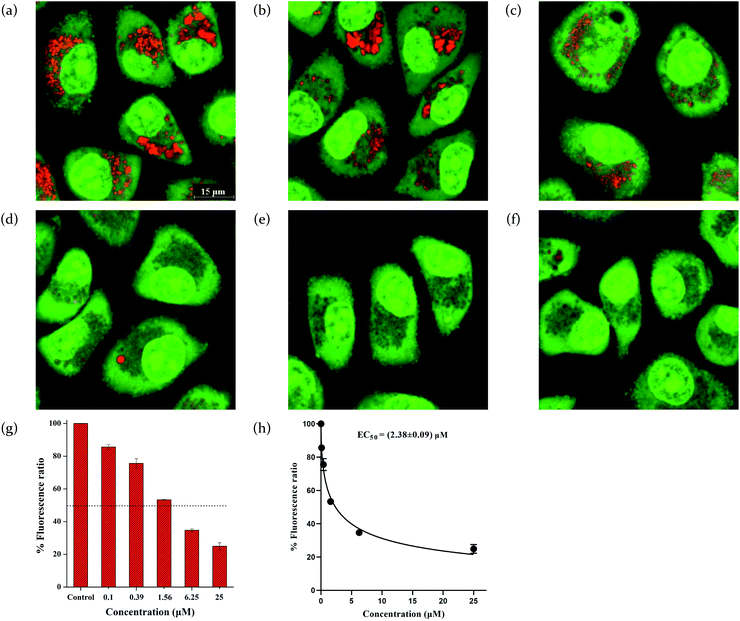
To quantitatively characterize the efficiency of these compounds to modulate cellular pH, we carried out concentration-dependent experiments and determined the EC50 values that are defined as the concentrations required to shift the orange/green ratios of AO by 50%.43 The EC50 values were listed in Table 2, and show that compounds 1-12 alkalize acidic organelles in the order of compound 12 > 11 > 8 > 10 > 9 > 7 > 6 > 5 > 1 ≈ 2 ≈ 3 ≈ 4, which is consistent with their transport activity on vesicles.
| Compound | Cellular alkalization | Lysosomal alkalization | |||
|---|---|---|---|---|---|
| EC50b (μM, AO) | ΔpHc | EC50d (μM, LysoSensor) | ΔpHe | Lysosomal enzymesf (%) | |
| a All the measurements were made on HeLa cells.b Measured by using AO assays.c Measured by using BCECF-AM assays, after treatment for 3 h.d Measured by using LysoSensor Green DND-189 assays.e Measured by using the assays based on dextran, fluorescein and tetramethylrhodamine, after treatment for 12 h.f Measured by using Magic Red Cathepsin assays and reported relative to the background. | |||||
| 1 | >50 | 0.03 ± 0.15 | >50 | −0.02 ± 0.28 | 92.7 ± 2.07 |
| 2 | >50 | 0.08 ± 0.11 | >50 | 0.01 ± 0.21 | 95.0 ± 1.46 |
| 3 | >50 | 0.09 ± 0.20 | >50 | −0.14 ± 0.14 | 101.9 ± 1.77 |
| 4 | >50 | 0.00 ± 0.04 | >50 | 0.58 ± 0.05 | 87.7 ± 1.08 |
| 5 | 36.9 ± 2.25 | 0.04 ± 0.20 | 39.8 ± 2.48 | 0.66 ± 0.19 | 75.4 ± 1.02 |
| 6 | 17.3 ± 0.55 | 0.07 ± 0.16 | 17.3 ± 0.86 | 1.03 ± 0.05 | 72.3 ± 0.75 |
| 7 | 11.3 ± 0.60 | 0.15 ± 0.12 | 14.0 ± 0.45 | 1.17 ± 0.04 | 69.9 ± 1.21 |
| 8 | 5.56 ± 0.22 | 0.79 ± 0.15 | 5.19 ± 0.36 | 1.82 ± 0.12 | 46.2 ± 0.94 |
| 9 | 9.56 ± 0.60 | 0.38 ± 0.06 | 10.9 ± 0.54 | 1.28 ± 0.15 | 63.2 ± 1.91 |
| 10 | 8.25 ± 0.82 | 0.72 ± 0.18 | 8.47 ± 0.50 | 1.51 ± 0.10 | 57.2 ± 2.37 |
| 11 | 3.31 ± 0.30 | 1.04 ± 0.15 | 3.54 ± 0.18 | 1.92 ± 0.07 | 42.9 ± 2.10 |
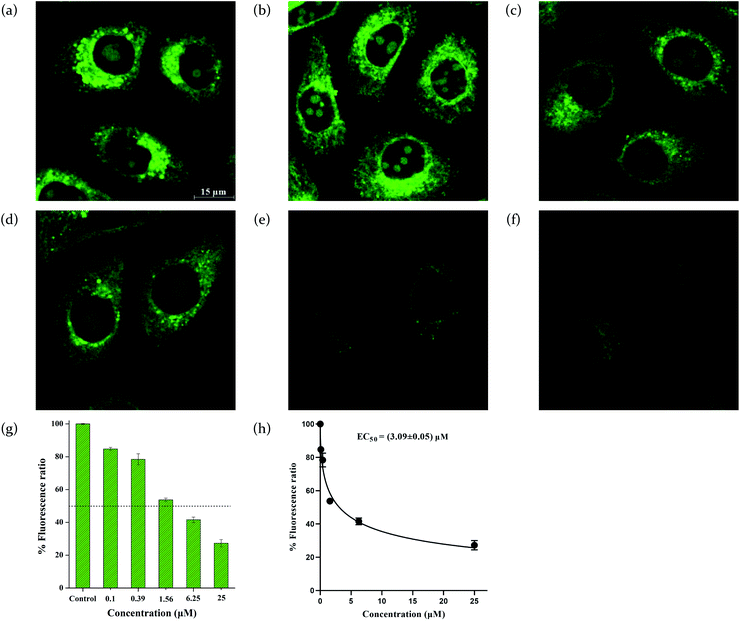
| 12 | 2.38 ± 0.09 | 1.14 ± 0.03 | 3.09 ± 0.05 | 1.90 ± 0.01 | 43.2 ± 1.78 |
| CQP | 1.44 ± 0.18 | 1.36 ± 0.02 | 1.34 ± 0.23 | 2.17 ± 0.13 | 37.3 ± 2.45 |
To quantitatively assess the efficiency of these compounds, we analyzed the green fluorescence intensity against the concentrations of each compound to give the EC50 values. This EC50 value is defined as the concentrations required to result in 50% disappearance of the green fluorescence of LysoSensor Green DND-189 (Table 2). The EC50 values suggest that compounds 1–12 alkalize lysosomes in the order of compound 12 > 11 > 8 > 10 > 9 > 7 > 6 > 5 > 1 ≈ 2 ≈ 3 ≈ 4. This order is consistent with the ones obtained in the liposome and AO assays. Notably, compounds 11 and 12 exhibit comparable ability to alkalize lysosomes with CQP.
As CQP is inactive in facilitating the efflux of chloride anions (data not shown), we propose that compounds 1–12 modulate lysosomal pH in a different mechanism with CQP. The ability of compounds 1–12 to basify acidic organelles and lysosomes in HeLa cells parallels their anionophoric activity across liposomal membranes, which strongly suggests that it is the anion exchange promoted by compounds 1–12 that could be responsible for the increase of lysosomal pH. Specifically, compounds 1–12 facilitate the efflux of chloride anions out of lysosomes and meanwhile the influx of hydroxide or bicarbonate into the interior of lysosomes, leading to an increase in the lysosomal pH.46
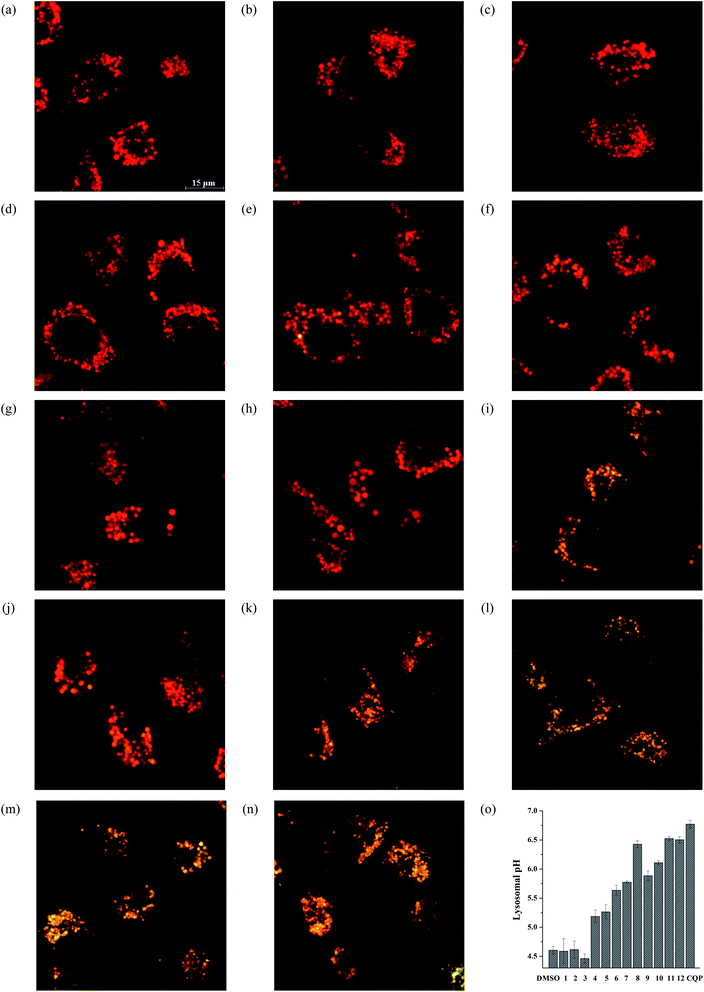
Next, we used a ratiometric lysosomal pH probe, fluorescein-tetramethylrhodamine-labeled dextran (FRD),38,42,48 to quantitatively measure the effect of compounds 1–12 on the lysosomal pH (Fig. 6, S82† and Table 2). FRD has a relative molecular weight of 70![[thin space (1/6-em)]](https://www.rsc.org/images/entities/char_2009.gif) 000 and may accumulate in lysosomes by endocytosis. It emits two types of fluorescence, green from fluorescein and red from tetramethylrhodamine, respectively. The ratios of green/red fluorescence are well correlated with the pH changes in lysosomes, whereby fluorescein acts as a pH-dependent fluorophore and tetramethylrhodamine as a pH-independent fluorophore.49 As a consequence, treatment of HeLa cells with compounds 1-12 increased the lysosomal pH by up to 1.92 units. These results clearly show that compounds 1–12 are able to cause lysosomal alkalinization, and notably compounds 11 and 12 are comparable to CQP.
000 and may accumulate in lysosomes by endocytosis. It emits two types of fluorescence, green from fluorescein and red from tetramethylrhodamine, respectively. The ratios of green/red fluorescence are well correlated with the pH changes in lysosomes, whereby fluorescein acts as a pH-dependent fluorophore and tetramethylrhodamine as a pH-independent fluorophore.49 As a consequence, treatment of HeLa cells with compounds 1-12 increased the lysosomal pH by up to 1.92 units. These results clearly show that compounds 1–12 are able to cause lysosomal alkalinization, and notably compounds 11 and 12 are comparable to CQP.
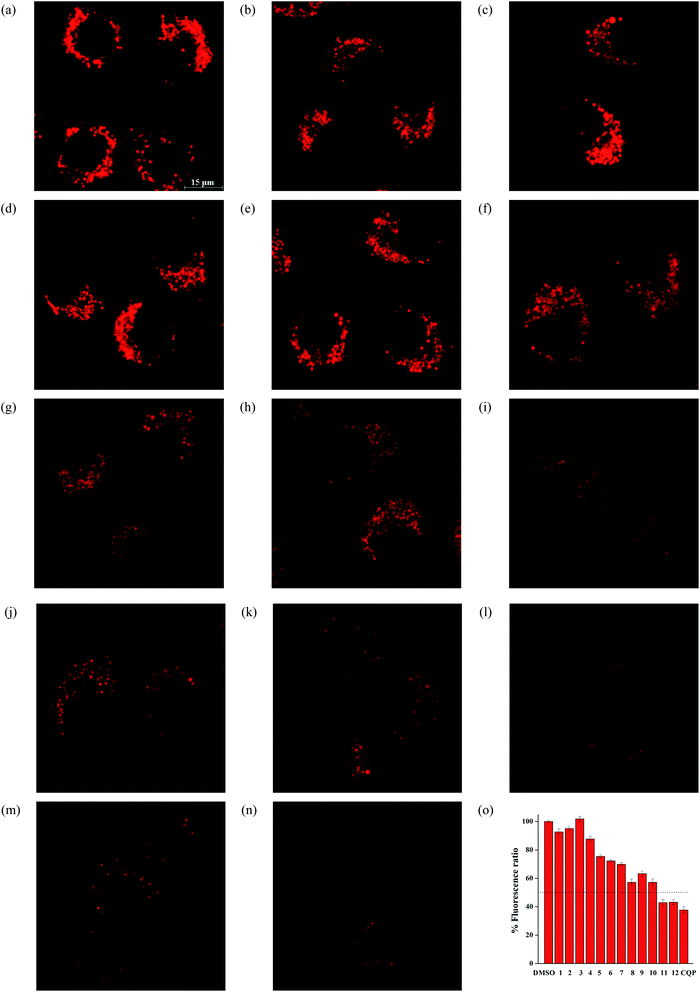
As shown in Fig. 7 and Table 2, treatment of HeLa cells with compounds 1–12 led to a decay in the red fluorescence within the cells, which suggests that the activity of Cathepsin B enzyme decreases and compounds 1–12 are able to change the lysosomal pH. Quantitative analysis of the red fluorescence intensity relative to the control indicates that at the tested concentration, the red fluorescence decreases in the order of compounds 12 > 11 > 8 > 10 > 9 > 7 > 6 > 5 > 1 ≈ 2 ≈ 3 ≈ 4, which is in good agreement with the ability of compounds 1–12 to transport anions and alkalize lysosomes.
3. Conclusion
In conclusion, we have successfully synthesized a family of morpholinyl-bearing arylsquaramides as small-molecule lysosomal pH modulators. Model and in vitro studies show that these squaramides are capable of efficiently mediating the transmembrane transport of chloride anions across liposomal and cellular phospholipid membranes. In contrast to many reported lysosomal pH modulators that generally function by acting as a weak base/acid, or releasing a basic/acidic component in the lysosomal environments, these compounds are able to modulate lysosomal pH via a probable mechanism of transmembrane anion transport. The present findings that these compounds are able to alkalize lysosomes without producing any cytotoxicity or disturbance to the autophagy of cells,51 strongly suggest that they may serve as ideal tool molecules to study the biological function of lysosomes.4. Experimental
4.1 Generals
The instruments used in this study included a Bruker Avance AV 500 NMR spectrometer for measuring 1H and 13C NMR spectra; Agilent 1260 Infinity II Prime-Ultivo and Thermo Scientific™ Orbitrap Fusion™ Tribrid™ mass spectrometers for recording the LR and HR ESI-MS spectra, respectively; an Avanti's Mini-Extruder (Avanti Polar Lipids, Inc., Alabaster, Alabama, USA) assembled with nuclepore track-etched polycarbonate membranes (100 nm, Whatman, Florham Park, New Jersey, USA) for vesicle preparation; Mettler-Toledo PerfectIon™ chloride ion selective electrode assembled with a Mettler-Toledo Seven Compact S220 ionometer for measuring chloride efflux; a BioTek Synergy Neo2 microplate reader for conducting MQAE, MQAE-MP and BCECF-AM assays; and a Leica TCS SP8 microscope for carrying out AO and LysoSensor Green DND-189 staining experiments, fluorescein–tetramethylrhodamine-labeled dextran and Magic Red Cathepsin assays.The specific reagents used in this study were EYPC from Sigma Chemical Co. (St Louis, USA); calcein and acridine orange from J&K Chemical Co (Beijing, China); MQAE from Macklin (Shanghai, China); LysoSensor Green DND-189 from Yeasen (Shanghai, China); Magic Red Cathepsin assay kits from ImmunoChemistry Technologies (Bloomington, USA); BCECF-AM from Dojindo (Shanghai, China); fluorescein–tetramethyl rhodamine-labeled dextran from Invitrogen (Shanghai, China); and CQP from Aladdin (Shanghai, China). Compounds 13–21 and 23 and 24, MQAE-MP were prepared according to reported procedures.25–28,40 All the other chemicals and reagents were obtained from commercial resources and used as received.
4.2 Synthesis of compound 22
To a mixture of diethyl squarate (151 μL, 1.0 mmol) and Zn(CF3SO3)2 (91 mg, 0.25 mmol) in EtOH (1 mL) was added drop wise a solution of 3,5-dichloroaninline (133 mg, 0.82 mmol) in EtOH (3 mL). The resulting mixture was stirred at room temperature and the reaction was monitored by TLC (PE/EA, 2/1, v/v). 8 h later, the starting material disappeared on TLC and the reaction mixture was concentrated under reduced pressure. The obtained residue was purified by chromatography on a silica gel column, eluted with PE/EA (1/1, v/v) to afford compound 22 (159 mg, 70%) having 1H NMR (500 MHz, DMSO-d6) δ 10.96 (s, 1H), 7.46 (s, 2H), 7.31 (t, J = 1.8 Hz, 1H), 4.78 (q, J = 7.1 Hz, 2H), 1.42 (t, J = 7.1 Hz, 3H); 13C NMR (125 MHz, DMSO-d6) δ 187.4, 184.3, 179.2, 169.3, 140.7, 134.5, 122.8, 117.7, 70.1, 15.6; negative LR-ESI-MS: m/z 284.0 ([M−H]−) and HR-ESI-MS for C12H10Cl2NO3 ([M + H]+) Calcd: 286.00322; found: 286.00308.4.3 Synthesis of compounds 1–12
4.4 Measurement of anion transport, lysosomal targeting and alkalization
Literature procedures were adopted to carry out the chloride efflux;29,30,34,52 calcein leakage;30,52 U-tube experiments;30,35 MQAE and MQAE-MP assays;40,49,52 AO assays;41,42,52 LysoSensor Green DND-189 assays;23,44,45 BCECF-AM assays;47 dextran, fluorescein and tetramethylrhodamine assays38,42 and Magic Red Cathepsin assays.23,42 Detailed experimental procedures may be found in the ESI.†Conflicts of interest
There are no conflicts to declare.Acknowledgements
Financial support from the National Natural Science Foundation of China (No. 21877057) is acknowledged.Notes and references
- J. Zeng, O. S. Shirihai and M. W. Grinstaff, J. Life Sci., 2020, 2, 25–37 Search PubMed.
- F. Wang, R. Gómez-Sintes and P. Boya, Traffic, 2018, 19, 918–931 CrossRef CAS PubMed.
- W. Zhang, J. Bai, K. Hang, J. Xu, C. Zhou, L. Li, Z. Wang, Y. Wang, K. Wang and D. Xue, Front. Cell Dev. Biol., 2022, 10, 817877 CrossRef.
- H. R. Shin and R. Zoncu, Dev. Cell, 2020, 54, 226–238 CrossRef CAS PubMed.
- X. D. Lou, M. S. Zhang, Z. J. Zhao, X. Min, A. Hakeem, F. Huang, P. Gao, F. Xia and B. Z. Tang, J. Mater. Chem. B, 2016, 4, 5412–5417 RSC.
- C. Meyer-Schwesinger, Cell Tissue Res., 2021, 385, 371–392 CrossRef CAS.
- J. Stinchcombe, G. Bossi and G. M. Griffiths, Science, 2004, 305, 55–59 CrossRef CAS PubMed.
- J. P. Luzio, P. R. Pryor and N. A. Bright, Nat. Rev. Mol. Cell Biol., 2007, 8, 622–632 CrossRef CAS PubMed.
- K. K. Mahapatra, S. R. Mishra, B. P. Behera, S. Patil, D. A. Gewirtz and S. K. Bhutia, Cell. Mol. Life Sci., 2021, 78, 7435–7449 CrossRef CAS PubMed.
- X. Zhao, C. Wang, G. Yuan, H. Ding, L. Zhou, X. Liu and Q. Lin, Sens. Actuators, B, 2019, 290, 79–86 CrossRef CAS.
- A. Ballabio and J. S. Bonifacino, Nat. Rev. Mol. Cell Bio., 2020, 21, 101–118 CrossRef CAS PubMed.
- R. E. Lawrence and R. Zoncu, Nat. Cell Biol., 2019, 21, 133–142 CrossRef CAS.
- Q. Xia, S. Feng, J. Hong and G. Feng, Sens. Actuators, B, 2021, 337, 129732 CrossRef CAS.
- X.-F. Zhang, T.-R. Wang, X.-Q. Cao and S.-L. Shen, Spectrochim. Acta, Part A, 2020, 227, 117761 CrossRef CAS PubMed.
- A. Ballabio and J. S. Bonifacino, Nat. Rev. Mol. Cell Biol., 2020, 21, 101–118 CrossRef CAS PubMed.
- A. M. Rodilla, L. Korrodi-Gregorio, E. Hernando, P. Manuel-Manresa, R. Quesada, R. Pérez-Tomás and V. Soto-Cerrato, Biochem. Pharmacol., 2017, 126, 23–33 CrossRef CAS.
- E. Schrezenmeier and T. Dörner, Nat. Rev. Rheumatol., 2020, 16, 155–166 CrossRef CAS.
- J. Liu, R. Cao, M. Xu, X. Wang, H. Zhang, H. Hu, Y. Li, Z. Hu, W. Zhong and M. Wang, Cell Discovery, 2020, 6, 16 CrossRef CAS PubMed.
- A. R. Kolli, F. Calvino-Martin and J. Hoeng, Pharm. Res., 2022, 39, 57–73 CrossRef CAS.
- J. Zeng, A. Martin, X. Han, O. S. Shirihai and M. W. Grinstaff, Ind. Eng. Chem. Res., 2019, 58, 13910–13917 CrossRef CAS.
- M. Bourdenx, J. Daniel, E. Genin, E. Genin, F. N. Soria, M. Blanchard-Desce, E. Bezard and B. Dehay, Autophagy, 2016, 12, 472–483 CrossRef CAS.
- J. Zeng, O. S. Shirihai and M. W. Grinstaff, Adv. Healthcare Mater., 2019, 8, e1801511 CrossRef PubMed.
- X.-Q. Hong, X.-Y. He, K. Y. Tam and W.-H. Chen, Bioorg. Med. Chem. Lett., 2020, 30, 127461 CrossRef CAS PubMed.
- X.-Q. Hong, X.-H. Yu, K. Zhang and W.-H. Chen, Org. Biomol. Chem., 2018, 16, 8025–8029 RSC.
- J. F. Fournier, Y. Bhurruth-Alcor, B. Musicki, J. Aubert, M. Aurelly, C. Bouix-Peter, K. Bouquet, L. Chantalat, M. Delorme, B. Drean, G. Duvert, N. Fleury-Bregeot, B. Gauthier, K. Grisendi, C. S. Harris, L. F. Hennequin, T. Isabet, F. Joly, G. Lafitte, C. Millois, R. Morgentin, J. Pascau, D. Piwnica, Y. Rival, C. Soulet, E. Thoreau and L. Tomas, Bioorg. Med. Chem. Lett., 2018, 28, 2985–2992 CrossRef CAS PubMed.
- A. Rostami, A. Colin, X. Y. Li, M. G. Chudzinski, A. J. Lough and M. S. Taylor, J. Org. Chem., 2010, 75, 3983–3992 CrossRef CAS PubMed.
- N. Akhtar, N. Pradhan, G. K. Barik, S. Chatterjee, S. Ghosh, A. Saha, P. Satpati, A. Bhattacharyya, M. K. Santra and D. Manna, ACS Appl. Mater. Interfaces, 2020, 12, 25521–25533 CrossRef CAS.
- I. Urruzuno, O. Mugica, G. Zanella, S. Vera, E. Gómez-Bengoa, M. Oiarbide and C. Palomo, Chem. - Eur. J., 2019, 25, 9701–9709 CrossRef CAS.
- L. A. Jowett and P. A. Gale, Supramol. Chem., 2019, 31, 297–312 CrossRef CAS.
- X.-Q. Hong, Y.-Y. Xing, Z.-K. Wang, Q.-C. Mao and W.-H. Chen, Chin. Chem. Lett., 2021, 32, 1653–1656 CrossRef CAS.
- N. Busschaert, I. L. Kirby, S. Young, S. J. Coles, P. N. Horton, M. E. Light and P. A. Gale, Angew. Chem., Int. Ed., 2012, 51, 4426–4430 CrossRef CAS.
- L. González-Mendoza, B. Altava, M. I. Burguete, J. Escorihuela, E. Hernando, S. V. Luis, R. Quesada and C. Vicent, RSC Adv., 2015, 5, 34415–34423 RSC.
- P. A. Gale, C. C. Tong, C. J. E. Haynes, O. Adeosun, D. E. Gross, E. Karnas, E. M. Sedenberg, R. Quesada and J. L. Sessler, J. Am. Chem. Soc., 2010, 132, 3240–3241 CrossRef CAS.
- Z. Li, X.-H. Yu, Y. Chen, D.-Q. Yuan and W.-H. Chen, J. Org. Chem., 2017, 82, 13368–13375 CrossRef CAS PubMed.
- F.-X. Wang, J.-W. Liu, X.-Q. Hong, C.-P. Tan, L. Zhang, W.-H. Chen, P. J. Sadler and Z.-W. Mao, CCS Chem., 2021, 3, 2527–2537 Search PubMed.
- T. Saha, A. Gautam, A. Mukherjee, M. Lahiri and P. Talukdar, J. Am. Chem. Soc., 2016, 138, 16443–16451 CrossRef CAS.
- T. Saha, M. S. Hossain, D. Saha, M. Lahiri and P. Talukdar, J. Am. Chem. Soc., 2016, 138, 7558–7567 CrossRef CAS.
- N. Busschaert, S. H. Park, K. H. Baek, Y. P. Choi, J. Park, E. N. W. Howe, J. R. Hiscock, L. E. Karagiannidis, I. Marques, V. Felix, W. Namkung, J. L. Sessler, P. A. Gale and I. Shin, Nat. Chem., 2017, 9, 667–675 CrossRef CAS.
- S. H. Park, S. H. Park, E. N. W. Howe, J. Y. Hyun, L.-J. Chen, I. Hwang, G. Vargas-Zuniga, N. Busschaert, P. A. Gale, J. L. Sessler and I. Shin, Chem, 2019, 5, 2079–2098 CAS.
- S. H. Park, J. Y. Hyun and I. Shin, Chem. Sci., 2019, 10, 56–66 RSC.
- N. Busschaert, M. Wenzel, M. E. Light, P. Iglesias-Hernandez, R. Pérez-Tomás and P. A. Gale, J. Am. Chem. Soc., 2011, 133, 14136–14148 CrossRef CAS PubMed.
- M. H. Chen, Y. Zheng, X.-J. Cai, H. Zhang, F. X. Wang, C. P. Tan, W.-H. Chen, L. N. Ji and Z.-W. Mao, Chem. Sci., 2019, 10, 3315–3323 RSC.
- T. Rawling, H. MacDermott-Opeskin, A. Roseblade, C. Pazderka, C. Clarke, K. Bourget, X. Wu, W. Lewis, B. Noble, P. A. Gale, M. L. O'Mara, C. Cranfield and M. Murrayc, Chem. Sci., 2020, 11, 12677–12685 RSC.
- M. Ren, K. Zhou, L. He and W. Lin, J. Mater. Chem. B, 2018, 6, 1716–1733 RSC.
- X. Gu, M. Han, Y. Du, Y. Wu, Y. Xu, X. Zhou, D. Ye and H. L. Wang, Toxicol. in Vitro, 2019, 55, 43–50 CrossRef CAS.
- P. I. Hernandez, D. Moreno, A. A. Javier, T. Torroba, R. Perez-Tomas and R. Quesada, Chem. Commun., 2012, 48, 1556–1558 RSC.
- P. Franck, N. Petitipain, M. Cherlet, M. Dardennes, F. Maachi, B. Schutz, L. Poisson and P. Nabet, J. Biotechnol., 1996, 46, 187–195 CrossRef CAS.
- J. E. DiCiccio and B. E. Steinberg, J. Gen. Physiol., 2011, 137, 385–390 CrossRef CAS PubMed.
- Y. Chen and E. A. Arriaga, Anal. Chem., 2006, 78, 820–826 CrossRef CAS.
- J. L. Zhu, Z. Xu, Y. Yang and L. Xu, Chem. Commun., 2019, 55, 6629–6671 RSC.
- We measured the viability of HeLa cells in the presence of compounds 1–12 at the concentration of 25 μM, using a conventional MTT assay. The results indicate that compounds 1–12 exhibited almost no or very low antiproliferative activity towards HeLa cells (Fig. S83†). Western blotting analysis demonstrated that compound 12 exhibited no effect on the expression of LC3 and p62 proteins in HeLa cells (Fig. S87†), which suggests that compound 12 does not cause any disturbance to the autophagy of HeLa cells.
- X.-H. Yu, C.-C. Peng, X.-X. Sun and W.-H. Chen, Eur. J. Med. Chem., 2018, 152, 115–125 CrossRef CAS.
Footnotes |
| † Electronic supplementary information (ESI) available: Structural characterization and experimental procedures for the anion transport and biological activity of each compound. See https://doi.org/10.1039/d2ra02146c |
| ‡ These authors contributed equally to this work. |
| This journal is © The Royal Society of Chemistry 2022 |

