 Open Access Article
Changing the calcination temperature to tune the microstructure and polishing properties of ceria octahedrons†
Yongxiu Li ab,
Xueliang Wanga,
Linmin Dinga,
Yao Lia,
Rucheng Hea and
Jing Li
 *ab
*ab
aSchool of Chemistry and Chemical Engineering, Nanchang University, Nanchang, Jiangxi 330031, China. E-mail: lijingbuaa@163.com
bInstitute of Rare Earths, Nanchang University, Nanchang, Jiangxi 330031, China
First published on 6th June 2022
Abstract
Ceria octahedrons with different microstructure and surface characteristics were prepared by calcining an octahedral CeO2 precursor self-assembled from spherical primary nanocrystals of about 5 nm at 500–900 °C. Structural characterization revealed that with the calcination temperature increasing from 500 to 700 °C, the products maintained a hierarchical structure and primary nanocrystals changed from spherical to octahedral particles. Significant fusion occurred between the primary nanocrystals and the surface of the octahedrons became smooth at the calcination temperature of 800 °C. Single crystal CeO2 octahedrons were formed when the calcination temperature reached 900 °C. The change in microstructure induced by elevated calcination temperature led to increased mechanical hardness and decreased surface chemical activity (specific surface area and surface Ce3+ concentration) of the octahedrons, which had an impact on their polishing performance. The polishing experiments on K9 glass showed that the polishing rate first increased and then decreased with the increment of calcination temperature, indicating that in addition to the mechanical hardness, the surface chemical activity of the octahedrons is also important for material removal. Owing to the best matching of chemical activity and mechanical hardness, CeO2 octahedrons calcinated at 700 °C exhibited the highest polishing rate and the best surface quality for K9 glass.
Introduction
Ceria is an important rare earth functional material that is widely used in solid oxide fuel cells (SOFCs), oxygen sensors, catalysts, ultraviolet absorbents, biological fields and polishing materials.1–7 As a polishing material, ceria has many advantages, such as high polishing rate, little damage to the polished surface, good surface quality after polishing and high removal selectivity, and therefore, has been used as the key abrasive for the chemical mechanical polishing (CMP) of optical glass, advanced integrated circuits and dielectric layers deposited for the fabrication of microelectronic devices.6–8 In recent years, with the decrease in size of the integrated circuit architecture due to chip miniaturization and the increase in precision of the optical glass planarization due to device upgrade, higher requirements are put forward for ceria abrasives.9–13A number of studies have been carried out with respect to the synthesis and tailoring of ceria abrasives, in which the physical and chemical characteristics of ceria particles, such as morphology, size, surface state, have a great influence on the polishing performance.14–18 Hu et al. compared the polishing performance of CeO2 nano-octahedrons and nanospheres on the silicon single crystal substrate and the results showed that the CeO2 nano-octahedrons with exposed {111} facets exhibited a stronger material removal capacity and inferior polishing quality than spheres-shaped CeO2 because the nano-octahedron with sharp corners and well-defined edges could induce higher compressive stress.19 Sreeremya et al. observed a strong morphology dependence of ceria nano-abrasives in glass polishing and the ceria nanostructure with a mixed morphology of rods and cubes exhibited the highest material removal rate and the best surface finish compared to nano-cube and nanosphere.20 Peng et al. carried out contrast experiments using ceria abrasive with micro and nano particle sizes in glass polishing and found that the material was removed by chemical reaction for ceria nanoparticles, while chemical reaction and mechanical abrasion simultaneously took place for ceria particles with sizes at scale of micrometers.21
In addition to size and morphology of the particle, the polishing performance of ceria abrasive is also affected by the heat treatment conditions. Janos et al. prepared ceria abrasive by calcining carbonate or oxalate precursors and the calcination temperature was found to be a critical parameter that governed the polishing efficiency and the quality of the polished surface.22 Kim et al. studied the effect of the oxygen partial pressure on the crystalline structure of ceria particles during the calcination of carbonate precursor and the results showed that the calcination process with a high oxygen concentration was beneficial for the synthesis of cubic phase CeO2 with enhanced shallow trench isolation (STI) CMP performance.23
Although much work has been done on the fabrication of ceria abrasives, there are few studies on the correlations between calcination temperature and abrasive morphology, chemical activity and mechanical hardness. Herein, using hierarchical CeO2 octahedrons as precursor, we synthesized a series of octahedral ceria abrasives with different microstructure and surface characteristics by varying calcination temperature. The relationship between calcination temperature and microstructure, mechanical hardness and chemical activity was established through polishing experiments on K9 glass. This work shed a light on manipulating the mechanical and chemical properties of ceria abrasives from a microstructural perspective, providing new ideas for the design and synthesis of ceria polishing materials.
Experimental
Preparation
Hierarchical octahedral CeO2 precursor with an average edge length of ∼200 nm was synthesized according to our previous report by a hydrothermal method.24 Typically, 21.711 g of Ce(NO3)3·6H2O and 11.117 g of polyvinylpyrrolidone (PVP, K30) were dissolved in 300 ml of deionized (DI) water. The pH of the solution was adjusted to 4.0 with 0.1 M NaOH solution. The mixture was transferred into a Teflon-lined stainless autoclave (capacity 500 ml) and heated at 180 °C for 24 h. After washed and dried in an oven at 60 °C for 12 h, the hierarchical CeO2 octahedrons were calcined at 500, 600, 700, 800 or 900 °C in air for 2 h to obtain polishing abrasive (Sample A–E).Characterization
Thermal analysis was performed using a PE PYRIS Diamond TG-DTA in air at a heating rate of 10 °C min−1 from room temperature to 900 °C. The phase and composition of the samples were characterized by X-ray powder diffraction (XRD, Bruker axs D8 Advance) using Cu Kα radiation (λ = 0.15406 nm). The morphology and structure were examined by field-emission scanning electron microscopy (FE-SEM, FEI Quanta-200F microscope) and transmission electron microscopy (TEM, JEOL JEM-2100 microscope). Raman spectra were recorded on a Renishaw inVia spectrometer using 532 nm laser excitation. The BET (Brunauer–Emmett–Teller) surface area of the samples was determined by physical adsorption of N2 at 77 K using a Quantachrome Autosorb-iQ gas adsorption analyzer. The surface zeta potential measurement of the samples was performed using an Agilent Zetaprobe 7020. The particle size distribution was measured by a Bettersize 2000LD particle size analyzer. X-ray photoelectron spectroscopy (XPS) data were obtained using a Thermo Scientific Escalab 250Xi with Al Kα radiation (hν = 1486.6 eV).Polishing tests
The slurry was prepared by dispersing ceria abrasive calcined at different temperature into DI water under stirring and then treated by ultrasound for 15 min. The solid content (for abrasive) of the slurry was 3 wt% and the pH value of the slurry was about 6.7. Polishing tests were performed at the K9 optical glass wafers with a diameter of 60 mm by a UNIPOL-802 CMP equipment (Shenyang Kejing Co. Ltd.). The polishing process parameters were set as follows: using a synthetic leather pad with rotation speed 200 rpm, downforce 0.67 psi, feed rate of the slurry 2 L min−1, polishing temperature of 25 ± 2 °C, polishing time 1 h. After polishing, the wafers were rinsed by absolute ethyl alcohol and DI water and then dried naturally in a super clean room. Material removal rate (MRR) was calculated according the formula MRR = (m0 − m)/ρtA, where ρ is the density of the K9 glass (2.51 g cm−3), A is the area of the wafer, t is polishing time, m0 is the original mass of the wafer and m is mass of the wafer after polishing. The MRR is the average of 3 runs. The surface topography and root mean square (RMS) roughness were measured by atomic force microscope (AFM, Bruker Dimension Icon).Results and discussion
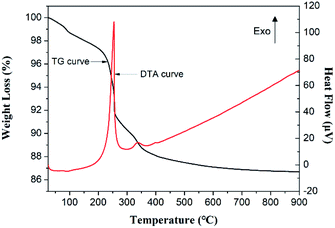
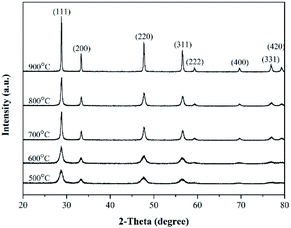
The hierarchical octahedral CeO2 precursor was self-assembled by spherical primary nanocrystals of about 5 nm which shared an almost common crystallographic orientation (Fig. S1†). The thermal behaviour of the precursor was investigated with TG-DTA. As illustrated in Fig. 1, the TG curve exhibited continuous weight loss in a broad temperature range from room temperature to 500 °C. The total weight loss is measured at about 13%. The weight loss before 200 °C is ascribed to the removal of free water or adsorbed water and the significant weight loss from 200 to 500 °C is attributed to the combustion of the residual surfactant PVP. The DTA curve showed two exothermic peaks around 254 and 337 °C, corresponding to the exothermic behaviour during the thermal decomposition/oxidation of PVP.Fig. 2 showed the XRD patterns of the calcined products. All the diffraction peaks can be indexed to the pure cubic fluorite structure of CeO2 with lattice constant of a = 5.41 Å, which is in good agreement with the JCPDS card (no. 34-0394). As the calcination temperature was increased, the peaks in the XRD pattern became sharper and the full width at half maximum (FWHM) decreased, indicating better crystallinity and an increase in the grain size with rising calcination temperature.
The morphology of the calcined products was examined by SEM. As illustrated in Fig. 3a–e, the samples calcined at different temperatures have octahedral shape with rounded edges and corners. High-magnification SEM images of a single octahedron revealed that they possessed different surface structures (Fig. 3f–j). The samples calcined at temperature values of 500, 600 and 700 °C have a hierarchical structure similar to the precursor and small primary particles can be clearly observed on the surface. When the calcination temperature increased to 800 and 900 °C, the surface of the calcined products became smooth, indicating that the primary particles were fused.
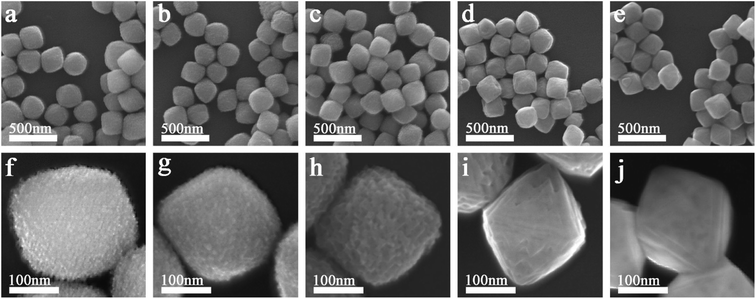 | ||
| Fig. 3 Low-magnification SEM images of Sample A–E (a–e) and high-magnification SEM images of a single particle for Sample A–E (f–j). | ||
More details about the crystallinity and structure of the samples calcined at different temperatures were studied with TEM, selected area electron diffraction (SAED) and high-resolution transmission electron microscopy (HRTEM). Fig. 4a–c displayed the typical TEM images of a single particle of Sample A–C oriented along the [110] zone axis, showing that they were assembled from small primary particles. The corresponding SAED patterns exhibited single-crystal-like electron diffraction spots, in which the high-order diffraction spots were obviously prolonged (Fig. 4f–h). This suggested that the primary particles were assembled into octahedrons with almost the same crystallographic orientation. As the calcination temperature was increased to 800 °C, the primary particles fused significantly and the elongation of high-order diffraction spots became inconspicuous (Fig. 4d and i). When the calcination temperature reached 900 °C, CeO2 octahedrons with single crystal structure were obtained (Fig. 4e and j). The HRTEM images (Fig. 4k–o) taken from the white-boxed areas in Fig. 4a–e revealed the evolution of primary particles with the increment of calcination temperature. The primary nanocrystals changed from spherical-like particles of about 5 nm to sharp octahedral particles with the edge length of about 8 nm as the calcination temperature increased from 500 to 700 °C. With the calcination temperature rising up to 800 °C, the primary nanocrystals were fused together to form big particles and the boundary between these big particles was not obvious. As the calcination temperature was 900 °C, the primary nanocrystals were completely fused and the hierarchical structure disappeared, forming single crystal CeO2 octahedrons. This is consistent with the XRD results, i.e., the increase in calcination temperature led to the increase of crystallinity and grain size.
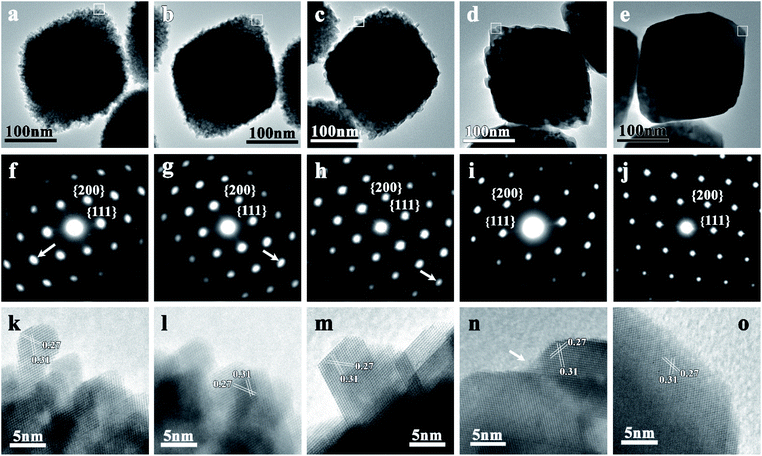 | ||
| Fig. 4 TEM images (a–e) and corresponding SEAD patterns (f–j) of single particle for Sample A–E. (k–o) HRTEM images recorded from white-boxed areas marked in a–e. | ||
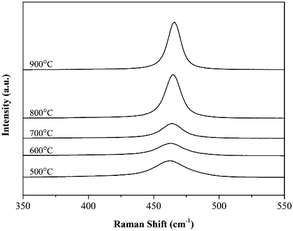
The Raman spectroscopy technology was also used to investigate the structure of the calcined products. As shown in Fig. 5, the main Raman band was peaked at about 462.5, 462.6, 464.2, 464.7, 465.9 cm−1 for Sample A–E. It belongs to the only allowed Raman mode (F2g) of cubic-fluorite-structured CeO2, which is attributed to the symmetrical stretching mode of Ce–O8 vibrational unit.25 The F2g mode is very sensitive to the disorder in oxygen sublattice caused by thermal or grain sized induced effects.26–28 In bulk CeO2 this frequency is 465–466 cm−1. For the calcined products, we observed a red-shift of this main Raman band accompanied by peak broadening as the calcination temperature decreased. This is attributable to the decrease of grain size revealed by XRD and TEM.
The products calcined at different temperatures were prepared into polishing slurries to investigate their polishing performance on K9 glass. Table 1 showed the physical characteristics of the calcined products and their MRR values for polishing K9 glass. It can be seen that the specific surface area decreased with values at 122.80, 113.01 and 75.96 m2 g−1 with the increasing calcination temperature at 500, 600 and 700 °C, which is consistent with the increase in the size of primary nanocrystals caused by the elevated calcination temperature. Due to the fusion of primary nanocrystals, the specific surface area of products calcined at 800 and 900 °C decreased sharply to 34.24 and 12.79 m2 g−1. All the calcined products were positively charged with the surface zeta potential of 116.6, 79.2, 77.2, 75.0 and 40.2 mV for Sample A–E. A zeta potential value of 30 mV (positive or negative) can be taken as the arbitrary value that judges stability of particle dispersion, so the calcined products have good dispersion stability. Considering that K9 glass has an electronegative surface charge (negative zeta potential), opposite surface charge will lead to the adhesion of calcined particles to the K9 surface by electrostatic attraction, which is helpful to improve the removal rate.29,30 The particle size distribution measurement showed that D90 of the calcined products was remarkably increased with the rising of calcination temperature, resulting in the broadening of the particle size distribution (R values). This may be because with the increase of calcination temperature, fusion occurred not only between primary nanocrystals, but also between octahedrons, forming particle agglomerates.
| CeO2 | 500 °C | 600 °C | 700 °C | 800 °C | 900 °C |
|---|---|---|---|---|---|
| Surface area (m2 g−1) | 122.80 | 113.01 | 75.96 | 34.24 | 12.79 |
| Zeta potential (mV) | 116.6 | 79.2 | 77.2 | 75.0 | 40.2 |
| D10 (μm) | 0.269 | 0.266 | 0.271 | 0.280 | 0.285 |
| D50 (μm) | 0.329 | 0.322 | 0.389 | 0.415 | 0.544 |
| D90 (μm) | 0.428 | 0.424 | 0.725 | 0.850 | 1.043 |
| R = (D90 − D10)/D50 | 0.483 | 0.491 | 1.17 | 1.37 | 1.39 |
| MRR (nm min−1) | 140.6 ± 6.7 | 163.8 ± 8.0 | 187.9 ± 7.8 | 166.8 ± 6.6 | 166.7 ± 8.5 |
The polishing rate of the calcined products towards K9 glass was also shown in Table 1. With calcination temperature rising, MRR first increased and then decreased. The products calcined at 700 °C was found to possess the highest MRR (187.9 nm min−1). From the mechanical effect during polishing, the increment of calcination temperature increased the grain size and made the octahedrons denser, thereby improving the mechanical hardness of the octahedral particles, which could explain the increase in MRR from 140.6 to 187.9 nm min−1 when the calcination temperature went up from 500 to 700 °C. However, as the calcination temperature continued to rise to 800 and 900 °C, we observed a decrease in MRR. This showed that apart from the mechanical friction, the chemical effect during polishing is also important.
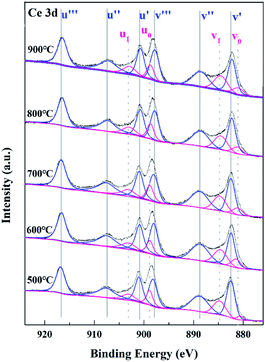
CeO2 is an excellent polishing material for glass, because it relies not only on mechanical friction but also on chemical reaction with the glass surface to achieve material removal.6,7,31–34 From the chemical effect during polishing, Ce–OH on the CeO2 surface can react with Si–OH on the glass surface to form Ce–O–Si bond that is stronger than Si–O–Si bond, thereby realizing the removal of the glass surface layer. Many studies have shown that the surface Ce oxidation state had a great impact on the polishing performance of CeO2 particles.15–17,35,36 It was believed that CeO2 particle with high surface Ce3+ concentration was beneficial to improve the chemical effect during CMP for the reason that Ce3+ sites helped the formation of Ce–OH groups at the CeO2 surface in aqueous medium through H2O dissociation and facilitated the breaking up of Si–O bond during polishing.7–10,31–34,37–39 Therefore, XPS analysis was carried out to investigate the surface Ce oxidation state of the calcined products. Fig. 6 showed the Ce 3d spectra of Sample A–E. Quantitative calculation of the Ce3+ concentration was conducted by peak deconvolution of XPS spectra using the mixed Gaussian–Lorentzian function. Ten deconvoluted peaks could be observed, of which the peaks labelled as v correspond to Ce 3d5/2 at low binding energy and the peaks labelled as u refer to Ce 3d3/2 at high binding energy.40 Among the ten peaks, two doublets (v0, u0), (v1, u1) are indexed to two different final states of Ce3+ in CeO2 owing to the emission from the spin–orbit split 3d5/2 and 3d3/2 core levels and three doublets (v′, u′), (v′′, u′′), (v′′′, u′′′) result from different final states of Ce4+. The concentration of Ce3+ ions in Sample A–E was calculated by dividing the area corresponding to Ce3+ to the total integrated area of Ce 3d. As displayed in Table 2, with increasing calcination temperature from 500 to 900 °C, the Ce3+ concentration decreased from 24.2 to 20.5%. Combined with the specific surface area data, it can be concluded that the surface chemical activity decreased from Sample A to Sample E.
| Peak assignment | Ce 3d5/2 | Ce 3d3/2 | [Ce3+] (%) | |||||||||
|---|---|---|---|---|---|---|---|---|---|---|---|---|
| v0 | v′ | v1 | v′′ | v′′′ | u0 | u′ | u1 | u′′ | u′′′ | |||
| Temperature | Binding energy (eV) | Ce3+ | Ce4+ | Ce3+ | Ce4+ | Ce4+ | Ce3+ | Ce4+ | Ce3+ | Ce4+ | Ce4+ | |
| 880.7 | 882.3 | 884.6 | 888.7 | 898.3 | 899.3 | 900.8 | 903.9 | 907.3 | 916.7 | |||
| 500 °C | Peak area (%) | 3.5 | 14.6 | 9.6 | 11.1 | 12.1 | 5.4 | 11.9 | 5.7 | 11.0 | 15.1 | 24.2 |
| 600 °C | Peak area (%) | 2.8 | 13.2 | 8.2 | 12.2 | 11.6 | 6.3 | 12.1 | 5.9 | 12.3 | 15.3 | 23.2 |
| 700 °C | Peak area (%) | 3.1 | 15.0 | 8.3 | 11.7 | 12.2 | 6.2 | 11.6 | 5.3 | 11.8 | 14.8 | 22.9 |
| 800 °C | Peak area (%) | 3.3 | 13.4 | 8.1 | 12.2 | 13.5 | 5.2 | 11.8 | 5.2 | 12.4 | 14.8 | 21.8 |
| 900 °C | Peak area (%) | 1.3 | 15.7 | 8.1 | 12.9 | 13.0 | 6.1 | 11.7 | 5.0 | 12.2 | 14.0 | 20.5 |
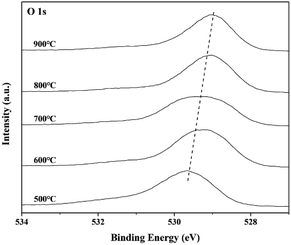
Fig. 7 showed the O1s XPS spectra of the calcined products. The peak centered at 529.0–529.6 eV is ascribed to the characteristic peak of lattice oxygen in CeO2. The position of this peak shifted to lower binding energy with increasing calcination temperature, indicating the change in the chemical environment of lattice oxygen in CeO2. According to the reports in literature,41,42 the conversion of Ce3+ to Ce4+ in CeO2 easily led to the shift of oxygen binding energy to a low position. This implied that the ratio of Ce4+ increased as the calcination temperature rose, which is in accordance with the Ce 3d XPS analysis. The decline in chemical activity thus resulted in lower MRR for Sample D and E calcined at 800 and 900 °C than for Sample C calcined at 700 °C.
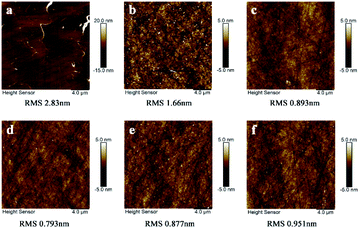
Surface quality after polishing is also crucial to evaluate the CMP effect. Fig. 8 displayed the surface roughness of the K9 glass wafer before and after polished with the calcined products. Results showed that the RMS surface roughness of K9 glass in a 20 μm × 20 μm area after CMP by Sample A–E was 1.66 ± 0.131, 0.893 ± 0.058, 0.793 ± 0.066, 0.877 ± 0.072 and 0.951 ± 0.065 nm, respectively. Sample C calcinated at 700 °C exhibited the best surface quality after polishing. The K9 surface polished by Sample A has a high surface roughness although the particle size distribution of this sample is narrow, which should be ascribed to the mismatch between chemical activity and mechanical hardness of the particles. The RMS roughness of K9 glass polished by Sample D and E also increased compared to Sample C. In addition to the mismatch between chemical activity and mechanical hardness of the particles, this may be also related to the broadening of particles size distribution.
Although all the calcined products have the quasi-octahedral shape with a similar edge length of 200 nm, their microstructure and physicochemical properties changed due to the different calcination temperatures, leading to varied polishing effects. As illustrated in Fig. 9, the octahedral CeO2 in water is terminated with Ce–OH2+ due to the positive zeta potential while the surface of the K9 wafer is Si–O−.43 The opposite surface charge between K9 surface and the calcined octahedrons leads to a strong electrostatic attraction. Under certain pressure, Ce–OH2+ on the surface of octahedrons will react with Si–O− to form Ce–O–Si bonds, thus weakening the Si–O–Si bonds on K9 surface layer. This surface layer activated by chemical reaction is then removed by mechanical friction of octahedrons. The removal of K9 surface layer is achieved under the synergy of chemical reaction and mechanical friction. When the calcination temperature is low, the chemical effect of the octahedral particles is stronger than their mechanical effect during polishing, resulting in low MRR and high surface roughness. At a high calcination temperature, such as 900 °C, the chemical effect is weak and the mechanical effect dominates, which also brings about a decrease in MRR and an increase in RMS. The octahedral CeO2 obtained at a calcination temperature of 700 °C has the best matching chemical and mechanical effects, resulting in high MRR and low surface roughness.
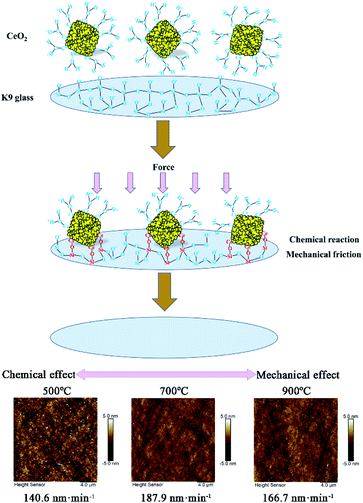 | ||
| Fig. 9 Schematics illustrating the chemical and mechanical polishing effect for the products calcinated at different temperatures. | ||
Conclusions
Octahedral CeO2 particles with different microstructures were obtained by calcining the hierarchical CeO2 octahedrons at varied temperatures. The difference in microstructure makes these octahedral CeO2 particles have varied physicochemical properties, resulting in different polishing effects on K9 glass. At low calcination temperatures of 500 and 600 °C, the octahedral particles maintained the hierarchical structure of the precursor, which possessed high chemical activity and low mechanical hardness. The primary nanoparticles were fused together and single crystal CeO2 octahedrons were formed at high calcination temperatures of 800 and 900 °C, which had better mechanical hardness but lower chemical activity. The octahedral particles calcined at 700 °C had the best matching of chemical activity and mechanical hardness, thus exhibiting the best polishing performance toward K9 glass.Conflicts of interest
There are no conflicts to declare.Acknowledgements
This work was supported by National Natural Science Foundation of China (Grant No. 21965020, 51864033, 21978127) and Key R&D Program of the Ministry of Science and Technology (Grant No. 2019YFC0605000).References
- C. W. Sun, H. Li and L. Q. Chen, Energy Environ. Sci., 2012, 5, 8475 RSC.
- P. Jasinski, T. Suzuki and H. U. Anderson, Sens. Actuators, B, 2003, 95, 73 CrossRef CAS.
- T. Montini, M. Melchionna, M. Monai and P. Fornasiero, Chem. Rev., 2016, 116, 5987 CrossRef CAS PubMed.
- R. Alvarez-Asencio, R. W. Corkery and A. Ahniyaz, RSC Adv., 2020, 10, 14818 RSC.
- A. Dhall and W. Self, Antioxidants, 2018, 7, 97 CrossRef PubMed.
- M. Krishnan, J. W. Nalaskowski and L. M. Cook, Chem. Rev., 2010, 110, 178 CrossRef CAS PubMed.
- R. Srinivasan, P. V. R. Dandu and S. V. Babu, ECS J. Solid State Sci. Technol., 2015, 4, 5029 CrossRef.
- E. Matijevic and S. V. Babu, J. Colloid Interface Sci., 2008, 320, 219 CrossRef CAS PubMed.
- L. Wang, K. Zhang, Z. Song and S. Feng, Appl. Surf. Sci., 2007, 253, 4951 CrossRef CAS.
- M. Oh, J. S. Nho, S. B. Cho, J. S. Lee and R. K. Singh, Powder Technol., 2011, 206, 239 CrossRef CAS.
- P. R. V. Dandu, V. K. Devarapalli and S. V. Babu, J. Colloid Interface Sci., 2010, 347, 267 CrossRef PubMed.
- R. Manivannan and S. Ramanathan, Appl. Surf. Sci., 2009, 255, 3764 CrossRef CAS.
- K. Wakamatsu, S. Kurokawa, T. Toyama and T. Hayashi, Precis. Eng., 2019, 60, 458 CrossRef.
- M. Fu, L. Wei, Y. Li, X. Zhou, S. Hao and Y. Li, Solid State Sci., 2009, 11, 2133 CrossRef CAS.
- J. Choi, C. Shin, J. Yang, S. Chae and T. Kim, ECS J. Solid State Sci. Technol., 2019, 8, 3128 CrossRef.
- J. Cheng, S. Huang, Y. Li, T. Wang, L. Xie and X. Lu, Appl. Surf. Sci., 2020, 506, 144668 CrossRef CAS.
- W. Pei, D. Zhao, X. Chen, X. Wang, X. Yang, J. Wang, Z. Li and L. Zhou, RSC Adv., 2019, 9, 26996 RSC.
- A. Chen, Y. Duan, Z. Mu, W. Cai and Y. Chen, Appl. Surf. Sci., 2021, 550, 149353 CrossRef CAS.
- P. Hu, Y. Chen, R. Sun, Y. Chen, Y. Yin and Z. Wang, Appl. Surf. Sci., 2017, 401, 100 CrossRef CAS.
- T. S. Sreeremya, M. Prabhakaran and S. Ghosh, RSC Adv., 2015, 5, 84056 RSC.
- W. Peng, C. Guan and S. Li, Opt. Eng, 2014, 53, 1 Search PubMed.
- P. Janos, J. Ederer, V. Pilarova, J. Henych, J. Tolasz, D. Milde and T. Opletal, Wear, 2016, 362–363, 114 CrossRef CAS.
- Y. H. Kim, S. K. Kim, N. Kim, J. G. Park and U. Paik, Ultramicroscopy, 2008, 108, 1292 CrossRef CAS PubMed.
- J. Li, C. Wang, X. Zhu, T. Wu, B. Tang and Y. Li, Mater. Lett., 2019, 240, 73 CrossRef CAS.
- A. Mineshige, T. Taji, Y. Muroi, M. Kobune, S. Fujii, N. Nishi, M. Inaba and Z. Ogumi, Solid State Ionics, 2000, 135, 481 CrossRef CAS.
- S. Loridant, Catal. Today, 2021, 373, 98 CrossRef CAS.
- M. Guo, J. Lu, Y. Wu, Y. Wang and M. Luo, Langmuir, 2011, 27, 3872 CrossRef CAS PubMed.
- S. Saitzek, J. F. Blach, S. Villain and J. R. Gavarri, Phys. Status Solidi A, 2008, 205, 1534 CrossRef CAS.
- G. Chen, Z. Ni, Y. Bai, Q. Li and Y. Zhao, RSC Adv., 2017, 7, 16938 RSC.
- K. M. Han, S. Y. Han, S. Sahir, N. P. Yerriboina, T. G. Kim, N. Mahadev and J. G. Park, ECS J. Solid State Sci, 2020, 9, 124004 CrossRef CAS.
- L. M. Cook, J. Non-Cryst. Solids, 1990, 120, 152 CrossRef CAS.
- J. Xin, W. Cai and J. A. Tichy, Wear, 2010, 268, 837 CrossRef CAS.
- Y. G. Wang, L. C. Zhang and A. Biddut, Wear, 2011, 270, 312 CrossRef CAS.
- T. Hoshino, Y. Kurata, Y. Terasaki and K. Susa, J. Non-Cryst. Solids, 2001, 283, 129 CrossRef CAS.
- J. Seo, J. Moon, J. H. Kim, K. Lee, J. Hwang, H. Yoon, D. K. Yi and U. Paik, Appl. Surf. Sci., 2016, 389, 311 CrossRef CAS.
- C. M. Netzband and K. Dunn, ECS J. Solid State Sci. Technol., 2020, 9, 044001 CrossRef CAS.
- A. Rajendran, Y. Takahashi, M. Koyama, M. Kubo and A. Miyamoto, Appl. Surf. Sci., 2005, 244, 34 CrossRef CAS.
- P. W. Carter and T. P. Johns, Electrochem. Solid-State Lett., 2005, 8, G218 CrossRef CAS.
- K. Dawkins, B. W. Rudyk, Z. Xu and K. Cadien, Appl. Surf. Sci., 2015, 345, 249 CrossRef CAS.
- L. Qiu, F. Liu, L. Zhao, Y. Ma and J. Yao, Appl. Surf. Sci., 2006, 252, 4931 CrossRef CAS.
- E. Abi-aad, R. Bechara, J. Grimblot and A. Aboukais, Chem. Mater., 1993, 5, 793 CrossRef CAS.
- J. P. Holgado, G. Munuera, J. P. Espinos and A. R. Gonzalez-Elipe, Appl. Surf. Sci., 2000, 158, 164 CrossRef CAS.
- S. Sahir, N. P. Yerriboina, S. Y. Han, K. M. Han, T. G. Kim, N. Mahadev and H. G. Park, Appl. Surf. Sci., 2021, 545, 149035 CrossRef CAS.
Footnote |
| † Electronic supplementary information (ESI) available. See https://doi.org/10.1039/d2ra02367a |
| This journal is © The Royal Society of Chemistry 2022 |

