 Open Access Article
Hydrocracking optimization of palm oil to bio-gasoline and bio-aviation fuels using molybdenum nitride-bentonite catalyst
Hasanudin Hasanudin *a,
Wan Ryan Asri
 ab,
Muhammad Said
 a,
Putri Tamara Hidayati
 a,
Widia Purwaningruma,
Novia Novia
 c and
Karna Wijaya
 d
d
aBiofuel Research Group, Department of Chemistry, Faculty of Mathematics and Natural Science, Universitas Sriwijaya, Indralaya 30662, Indonesia. E-mail: hasanudin@mipa.unsri.ac.id
bDepartment of Chemistry, Magister Program, Faculty of Mathematics and Natural Science, Universitas Sriwijaya, Indralaya 30662, Indonesia
cDepartment of Chemical Engineering, Department of Engineering, Universitas Sriwijaya, Indralaya 30662, Indonesia
dDepartment of Chemistry, Faculty of Mathematics and Natural Science, Universitas Gadjah Mada, Yogyakarta 55281, Indonesia
First published on 1st June 2022
Abstract
In this study, molybdenum nitride-bentonite was successfully employed for the reaction of hydrocracking of palm oil to produce a bio-gasoline and bio-aviation fuel. The prepared catalyst was characterized using XRD, FT-IR, and SEM-EDX. The acidity of the catalyst was determined using the pyridine gravimetric method. The result showed that the acidity of bentonite was increased after modification using molybdenum nitride. The hydrocracking study showed that the highest conversion and product fraction of bio-gasoline and bio-aviation fuel were exhibited by molybdenum nitride-bentonite 8 mEq g−1. The catalyst was later used to optimize the hydrocracking process using RSM-CCD. The effects of the process variables such as temperature, contact time, and catalyst to feed ratio, on the response variables, such as conversion, oil, gas, and coke yield, were investigated. The analysis of variance showed that the proposed quadratic model was statistically significant with adequate precision to estimate the responses. The optimum conditions in the hydrocracking process were achieved at a temperature of 731.94 K, contact time of 0.12 h, and a catalyst to feed ratio of 0.12 w/v with a conversion of 78.33%, an oil yield of 50.32%, gas yield of 44.00% and coke yield of 5.73%. The RSM-CCD was demonstrated as a suitable method for estimating the hydrocracking process of palm oil using a MoN-bentonite catalyst due to its closeness to the optimal value of the expected yield. This study provided a potential catalyst of based on bentonite modified using molybdenum nitride for the hydrocracking of palm oil.
Introduction
World energy consumption has increased substantially owing to population growth during the previous few decades and emerging market economic outcomes, potentially depleting fossil fuel reserves.1,2 Specifically, gasoline and aviation fuel are the primary focus because they contribute to the largest sector in transportation and continue to grow.3,4 In addition, it is known that rising concentrations of greenhouse gases (GHG) in the airspace cause climatic fluctuations on a scale that compromises the endurance of the ecosphere, in conjunction with humans themselves.5 One of the solutions to minimize the release of carbon dioxide is using biofuels instead of petroleum-based fuels in transportation.6 Biofuels are renewable, environmentally friendly, sustainable, have good properties, and can potentially substitute along with reduce dependence on fossil fuels.7 These biofuels are divided into bio-gasoline, bio-aviation fuel, and others, contingent upon the number of carbon atoms.8Studies regarding biofuel production have been conducted extensively. Besides production methods such as transesterification, gasification, catalytic cracking, and pyrolysis, up to this point, hydrocracking and catalytic cracking are technologies that are widely used to produce biofuels.9 Moreover, the type of conversion of vegetable oil using hydrocracking is a kind of environmentally friendly technology, the biofuel produced is of high quality which is suitable for commerce, and contributes effectively to sustainable development.10 Hydrogenation and catalytic cracking processes take place concurrently throughout the hydrocracking process, which exhibits the cracking of larger hydrocarbon molecules into smaller ones.11 This technology can minimize the formation of undesired coke. A further vacuum distillation process is conducted to separate hydrocracking fraction product. The hydrocracking process involves the removal of double bonds and carboxyl groups in fatty acids to obtain compounds with a lower number of carbon atoms. In this process, with the presence of hydrogen gas and the bifunctional catalyst, the hydrodeoxygenation reaction is entailed as the primary reaction, whereas the decarboxylation is the side reaction. Furthermore, the liquid hydrocarbon product generally contains a rich n-alkanes compound obtained through three complex reactions, namely decarbonylation, decarboxylation, and hydrodeoxygenation.12
In the matter of the hydrocracking feedstocks, vegetable oils, which mainly contain triglycerides, particularly are attractive renewable resources for producing biofuels.13 Until now, vegetable oils such as coconut, soybean, palm oil, rapeseed, as well as sunflower have been used as biofuel feedstocks via hydrocracking.14 Palm oil is one of the most promising feedstocks for producing biofuels because it is modest and has the massive yield per hectare when contrasted with other vegetable oils.15 Palm oil contributes to the world's vegetable oil production by 33% to meet the national needs and exports of many countries, including Malaysia, Indonesia, and Thailand.16 Particularly, Indonesia has 14 million hectares of palm oil and supplies 85% of the world's palm oil.17 Considering its abundance and primarily contributes to Indonesia's economy, palm oil as feedstock to produce biofuels through hydrocracking is necessary and auspicious.
The development of adequate catalysts for the hydrocracking of vegetable oil to biofuel is the primary focus of the process. Various catalysts such as metal catalysts supported on SiO2/SO4,18 Ni–Mo supported catalyst,6 Co–Mo metal impregnated-natural zeolite,9 bimetal and triflic acid supported on SBA-15 catalyst,19 ZSM5 zeolite,20 zeolite–Al2O3 composite supported NiMo catalyst,14 sulfonated mesoporous Y zeolite–Ni,21 and various zeolite type,22 have been used for catalytic hydrocracking from vegetable oil to biofuels such as bio-gasoline and bio-aviation fuels. Obviously, among those heterogeneous catalysts, utilizing natural materials such as bentonite clay minerals is indispensable to get cost capability, as shown in various studies.23–25 Furthermore, as an alternative catalyst in this context, bentonite is one of the most commonly encountered natural clays globally, thereby making it continuously exist.26 The swelling ability of bentonite permits modification of its pores into various pore-sizes. The bentonite itself can act as primary and support catalysts simultaneously.27,28 Modification of the structure of bentonite can lead to an increase in its catalytic activity.29,30
Several new kinds of modified bentonite structures have been developed and demonstrated their potential in various catalytic processes.31–33 Suseno34 used Ni–Cu/ZrO2 pillared bentonite in hydrocracking of palm oil to gasoline and revealed that the selectivity of gasoline fraction was inversely proportional to the Cu content of the catalyst. Wijaya et al.35 utilized Ni catalyst supported on sulfated ZrO2 pillared bentonite and showed high activity and selectivity towards bio-gasoline from coconut oil conversion. Currently, metal catalysts with diverse phases,36–38 including noble metal39 have been used in hydrogen-involved reactions. However, those catalysts have drawbacks due to high cost and high coke deposition, which hinder industrial-scale processes.40 In recent decades, transition metal nitride catalytic systems have been preferred to be developed, potentially solving the low resistance to poisoning and catalyst deactivation in the heterogeneous catalyst system.41 Molybdenum nitride with a high surface area is one of the most adaptable materials. They can function as active catalysts as well as catalytic supports, having unique features that encourage high catalytic activity.42 Molybdenum is easily nitrided and has a more favorable interaction than other compounds such as cobalt nitride and nickel nitride.43 As a result, this catalyst provides good potential properties with a relatively less expensive and more selective alternative than other catalysts.44
Molybdenum nitride have been extensively studied in the hydrodeoxygenation,41,44,45 ammonia decomposition,42,46 NO reduction with H2,47 hydrogenation,48,49 methane dry reforming,50,51 and so forth. According to the literature review, neither studies nor reports have been conducted regarding the modification of bentonite using molybdenum nitrite and its application for hydrocracking of palm oil into biofuels. A novel bentonite modified catalyst for the hydrocracking of palm oil was evolved using molybdenum nitride by increasing the acidity of the catalyst through a synergistic combination. With this combination, it is potentially given an appropriate suitable catalyst for converting vegetable oil into biofuel with closer to optimal results along with better execution and financially reasonable. Since the metal concentration inherently affects the acidity catalyst, which promotes the hydrocracking process, the effect of molybdenum concentration on the hydrocracking process was assessed. The catalyst which exhibits the highest conversion, as well as bio-gasoline and bio-aviation fuel product fraction would be optimized by response surface methodology with a central composite design (RSM-CCD), as revealed that either the reports or studies regarding optimization of hydrocracking was very limited. In this study, the process variable such as reaction temperature (K), contact time (h), and catalyst to feed ratio (w/v) was evaluated, whereas the of conversion, coke, oil, and gas yields were used as response variables. The bentonite-molybdenum nitride was characterized using XRD, FTIR, and SEM-EDX. The acidity was evaluated by the gravimetric method with pyridine. The hydrocracking product was analyzed using GCMS.
Experimental
Materials
Natural bentonite (Al2O3·4SiO2·xH2O) was supplied from Bayan, Central Java. RBD (refined, bleached, and deodorized) palm oil was obtained from PT. Agro Indralaya Mandiri without further pretreatment. Ammonium heptamolybdate tetrahydrate ((NH4)6Mo7O24·4H2O ≥99.0% purity), ammonium nitrate (NH4NO3 ≥95.0% purity), sodium chloride (NaCl, ≥99.5% purity), silver nitrate (AgNO3 99.8–100.5% purity), pyridine (C5H5N, ≥99.5% purity), and copper sulfate pentahydrate (CuSO4·5H2O 99.0–100.5% purity) were analytical grade and purchased from Merck.Preparation of catalyst
The natural bentonite was prepared by a previous report,52 using a saturated NaCl solution. The powder was referred to as Na-bentonite. Next, 10 g of Na-bentonite 200-mesh was dissolved in ammonium heptamolybdate 0.1 M solution with different series of volumes, which were represented as 2, 4, 5, and 8 milliequivalents per gram (mEq g−1) and then stirred using a magnetic stirrer for 1 hour at room temperature followed by gradually dripped of 0.5 M ammonium nitrate solution using a burette until reached the desired volume. The solution was then stirred as well for 24 hours and then heated at a temperature of 353.15 K for 1 day to form a paste. The pasta was later dried using an oven at a temperature of 378.15 K, followed by calcination at a temperature of 673.15 K using a muffle furnace. Lastly, the catalyst was reduced using H2 gas. In the reduction process, the temperature was raised at 276.65 °C min−1 to 623.15 K, afterward at 273.45 K min−1 to 773.15 K, then subsequent at 274.15 K min−1 to 873.15 K, and held for 2 hours.48 The catalyst obtained was then sieved by 200-mesh and referred to as bentonite-molybdenum nitride (MoN-bentonite).Catalyst characterization
X-ray diffraction (XRD) characterization was performed using a Rigaku Minu Flex 600 operated using an X-ray tube: Cu (1.54060 Å), voltage: 40.0 kV, current: 30.0 mA, step size: 0.0200 deg and count time: 0.24 s. Fourier transform infrared (FTIR) was assessed using a Shimadzu 8201 using the KBr pellet method. The spectra were scanned from 4000 to 400 cm−1. The morphological surface of the catalyst was analyzed by scanning electron microscope along with an energy dispersive X-ray (SEM-EDX) using a JSM 6510, which was operated at a voltage of 20 kV. The acidity of the catalyst was determined using the gravimetric method with the pyridine gas.53Hydrocracking of palm oil
Palm oil was set in a fixed-bed reactor's feed column. The reactor was saturated with H2 gas under pre-determined conditions prior to the hydrocracking process to remove the oxygen gas.54 The palm oil flow rate was 11.94 g min−1 and pumped using a peristaltic pump with a catalyst weight of 12 g at 723 K for 7.2 min with 2 mL s−1 H2 gas flow. As illustrated in the previous report with some modification,54 the feed column was put in a furnace associated with a condenser and flask pear shape as a product reservoir. The liquid of the hydrocracking product was later heated in the vacuum distillation at 473.15 K to acquire the respective biofuel fractions. The liquid remaining in the flask after distillation was comprised of unreacted triglycerides from the palm oil feedstock. Liquid products were analyzed by using GC-MS. The biogasoline and bio-aviation fuel fractions were evaluated based on the hydrocarbons group with C5–C12 and C13–C16, respectively. The hydrocracking total conversion (X) of the product was calculated according to eqn (1) as follows:
 | (1) |
Optimization hydrocracking of palm oil using RSM
The optimized hydrocracking process was a reaction with a catalyst that exhibits the highest bio-gasoline, bio-aviation, and conversion of hydrocracking product. The experimental design in this study followed the response surface methodology (RSM) with a central composite design (CCD) with 20 runs, including 8 factorial points (±1), 6 axial points (±1.682), and 6 center points (0); each of the points was coded accordingly, in which minus and plus sign represented the low and high levels, respectively. The process variables investigated included reaction temperature (K), contact time (h), and the ratio of catalyst weight to feed (w/v), whereas the response variables included conversion, oil, gas, and coke yield. Oil and coke yields are calculated according to the corresponding product divided relative to the feedstock, while gas yields are calculated by the difference between the total product and the coke and oil yields.55 The range of levels variables studied using RSM-CCD are shown in Table 1.| Variables | Unit | Levels | ||||
|---|---|---|---|---|---|---|
| −1.682 | −1 | 0 | 1 | +1.682 | ||
| Reaction temperature (A) | K | 680.96 | 698.00 | 723.00 | 748.00 | 765.045 |
| Contact time (B) | h | 0.0664 | 0.08 | 0.10 | 0.12 | 0.1336 |
| Catalyst/feed ratio (C) | w/v | 0.0659 | 0.10 | 0.15 | 0.20 | 0.2340 |
The modeling results was following the second-order polynomial equations according to the eqn (2) as follows:
 | (2) |
In eqn (2), Y represented the response, τo, τi, and τii were linear, quadratic, and interaction coefficients, respectively, whereas Xi and Xj were independent variables, respectively. The correctness of the model was evaluated with a regression coefficient (R2) as well as an analysis of variance (ANOVA). Models and factors of statistical significance were assessed at a confidence level of 95% (P < 0.05).56 The optimization of such variables to get the optimal responses were investigated using desirability approaches.57
Results and discussion
Catalyst characterization
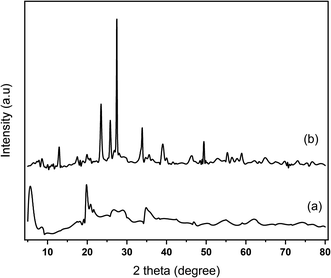
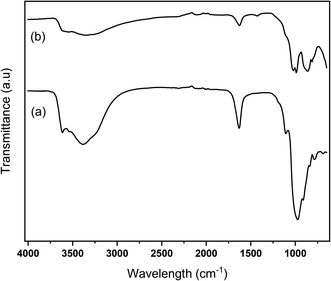
XRD analysis was conducted to investigate the structure of the catalyst. The XRD diffractograms of Na-bentonite and MoN-bentonite are represented in Fig. 1. Fig. 1a shows a 2θ diffraction peak at 25.80°, 19.75°, 28.66°, 34.75°, which corresponded to the mineral montmorillonite-21A (JCPDS card no. 29-1499),58 whereas in the Fig. 1b appears a 2θ diffraction peak at 39.110°, 46.00° which attributed to the γ-Mo2N formation.41 This condition indicated that the modification of bentonite using molybdenum nitride was successfully conducted. Another phase in Fig. 1b was observed at 2θ of 12.88°, 23.44°, 27.427°, 33.87°, which indicated the crystalline MoO3 phase (JCPDS card no. 076-1003).59 Many phases of molybdenum nitride could exist since this compound had a gap alloy structure.60 The presence of various phases in molybdenum nitride synthesis was also reported51 previously.FTIR analysis was used to investigated the functional group of catalyst. Na-bentonite and MoN-bentonite FTIR spectra are shown in Fig. 2. The FTIR spectra of Na-bentonite from Fig. 2a revealed an absorption band at 3362 cm−1, which indicated the presence of –OH groups isolated by Si–OH and Al–OH silanols from the interlayer Na-bentonite as well as the hydrogen-bonded OH groups.61,62 The broadband absorption at 3654 cm−1 was associated with adjacent silanol groups, and it tended to weaken after modification by molybdenum nitride as well as the calcination effect of Si–O–Si bond formation. Another and located at 1625 cm−1 appeared due to deformation vibrations of physically adsorbed water between spaces.63
In the low-frequency region, the strong band at 1050 cm−1 indicated Si–O and Al–O stretching vibrations in the Na-bentonite plane, the peak at 916 cm−1 was associated with Al–OH–Al.64 Surprisingly, Fig. 2 shows that the high-intensity absorption band appeared at 864.7 cm−1 attributed to the molybdenum nitride. Bentonite modification using molybdenum studied by Harun et al.65 also formed a new absorption band, as previously earlier stated. Overall, the modification of bentonite using molybdenum nitride did not significantly change the FTIR spectra of Na-bentonite, except in the lower absorption band; this was presumably due to molybdenum nitride-bentonite frameworks interaction.
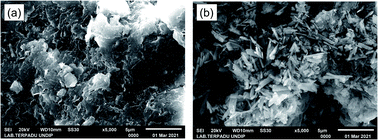
The image of the catalyst's morphological surface and its elemental contents was analyzed using SEM-EDX. The image surface of Na-bentonite and MoN-bentonite are presented in Fig. 3. Fig. 3a shows that the Na-bentonite had a heterogeneous layered and lamellar surface, which was in agreement with other findings.62 Huang et al.66 stated that the irregular appearance was a typical of Na-bentonite surface. Furthermore, it was obvious that the modification using molybdenum nitrite, as revealed in Fig. 3b, had significantly affected the Na-bentonite lamellar structure, which indicated by the formation of needle flakes-like structure. This condition implied that Na-bentonite was successfully modified by molybdenum nitride.
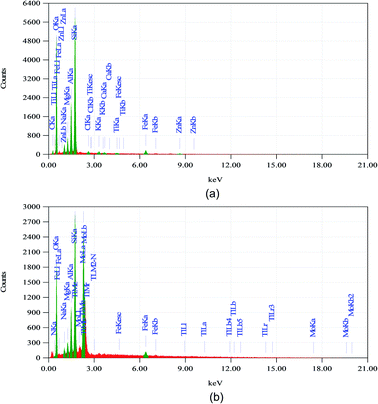
The EDX spectrum of catalysts are presented in Fig. 4. EDX analysis from Fig. 4 shows that the Mo and N content were increased after modification from 0 to 29.26% and 0.49%, respectively, which indicated that the modification of Na-bentonite using molybdenum nitride was successfully achieved. The oxygen, silica, alumina, and sodium were found as a primary constituent in Na-bentonite. Furthermore, the Na-bentonite contained iron, magnesium, titanium, calcium, and other elements, which were identical and typically existed in the natural bentonite, as reported by another study.67
The amount of pyridine absorbed by Na-bentonite and MoN-bentonite was proportional to the acidity of the catalyst. The acidity values of catalysts are shown in Table 2. Based on Table 2, Na-bentonite had a low acidity value of 0.005 mmol g−1, which was acquired by the aluminosilicate groups and after modification, the acidity value tended to increase. This condition indicated the formation of a new acidic active site by molybdenum nitride, which inherently increased the acidity of the catalyst. Another study also revealed a similar finding in the catalyst acidity of bentonite increased after modification using Ni–Cu/ZrO2.34 Furthermore, it can be seen that the acidity of the catalyst was increased along with the increase of molybdenum concentration. This condition can be correlated to the concentration of metal, the higher Lewis as well as Brønsted acid formed, thereby increasing the acidity value of the catalyst.68 The highest catalyst acidity of 0.13 mmol g−1 was achieved by MoN-bentonite 8 mEq g−1. The acidity of the catalyst greatly affected the hydrocracking process of the oil,69 in which a higher amount of acidity was associated with more active sites and a greater adsorption capacity of the reactants.70 Hence, a high acidity of catalysts would provide more conversion of palm oil into biofuels.
| Catalyst | Total acidity (mmol g−1) |
|---|---|
| Na-bentonite | 0.005 |
| MoN-bentonite 2 mEq g−1 | 0.08 |
| MoN-bentonite 4 mEq g−1 | 0.09 |
| MoN-bentonite 6 mEq g−1 | 0.11 |
| MoN-bentonite 8 mEq g−1 | 0.13 |
Hydrocracking of palm oil
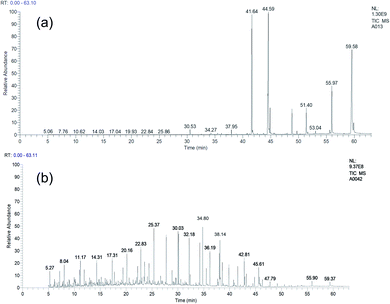
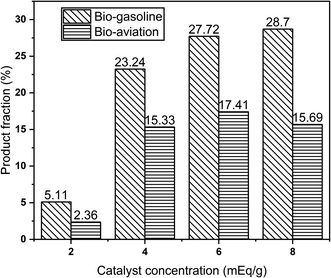
Molybdenum nitride-bentonite catalyst was used in this study, in which the catalyst's active site was molybdenum nitride, which facilitated the formation of intermediate compounds on the catalyst surface and provided a hydrocracking process. The chromatograms of palm oil and the hydrocracking product is shown in Fig. 5.It was apparent from the Fig. 5a that the palm oil contained triglyceride as well as fatty acid component which subsequently would be hydrocracking by MoN-bentonite catalyst. The product of hydrocracking from Fig. 5b showed that there was a shift below retention time of 40 min indicated that most long carbon chain of triglyceride had broken down into shorter chain carbon. The product fraction of bio-gasoline (C5–C12) and bio-aviation fuel (C13–C16) hydrocracking of palm oil is shown in Fig. 6.
From Fig. 6, it appears that the catalyst concentration affected the product fraction of hydrocracking. It can be seen that bio-gasoline and bio-aviation fuel product fractions had positively correlated to the molybdenum catalyst concentration. MoN-bentonite had a more dominant product fraction of bio-gasoline than bio-aviation fuel. This condition was due to further cracking of long-chain hydrocarbon, thereby increasing the low chain hydrocarbon (C5–C12), referred to as bio-gasoline. Furthermore, the appearance of active site such as molybdenum nitride as a Lewis acid could enhance the acidity of the site and the resistance of the catalyst to deactivation due to coke formation, resulting in a more significant effective interaction between the feed and hydrogen. Thereby, the hydrocracking process was efficient in generating the gasoline fraction.
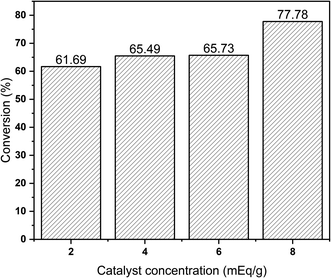
The effect of molybdenum concentration of MoN-bentonite catalyst on the product conversion of hydrocracking of palm oil is shown in Fig. 7. According to Hamidi et al.71 the first step in the cracking reaction was the formation of carbonium ions promoted by an acid catalyst. Therefore, the catalytic acid site plays a major role in the catalytic cracking reaction.
From Fig. 7, it can be seen that the product conversion was increased along with the increase in the molybdenum concentration of the MoN-bentonite catalyst. This condition indicated that the greater the metal concentration, the greater the active site available to catalyze the hydrocracking process,72 consequently increasing the product conversion. As presented in Fig. 7, the highest product conversion was achieved by molybdenum nitride-bentonite 8 mEq g−1 catalyst. According to the acidity analysis, as earlier described, the catalyst which generated high product conversion had the highest acidity value compared to other catalysts. This finding indicated that the acidity of the catalyst influenced the product conversion, where the higher acidity value provided higher product conversion.18 Since the MoN-bentonite 8 mEq g−1 provided the highest conversion and bio-gasoline and bio-aviation product fraction, it was used for further optimization using RSM-CCD.
Interpretation of RSM-CCD results
Response surface methodology (RSM) with central composite design (CCD) by Design-expert 12 software was conducted using 3 factors and 4 responses with 20 runs, as previously described, to discover the optimum operating conditions. The optimization study was carried out using MoN-bentonite 8 mEq g−1, which generated the highest conversion and bio-gasoline and bio-aviation product fraction. The experimental results of CCD are shown in Table 3. The coded quadratic models of the responses (Y) such as conversion (%), oil yield (%), gas yield (%), and coke yield (%) are presented in eqn (3)–(6) as follows:| Yconversion = 77.87 + 3.04A + 4.13B + 4.12C − 0.3350AB + 0.6425AC − 0.185BC − 0.6352A2 − 1.37B2 − 0.7501C2 | (3) |
| Yoil yield = 48.89 + 0.9320A + 2.73B − 0.6734C − 1.76AB − 0.3575AC − 0.30BC − 1.30A2 − 1.23B2 − 0.7788C2 | (4) |
| Ygas yield = 44.18 − 0.21A − 3.17B − 0.6107C + 1.65AB + 0.4375AC + 0.2475BC + 1.45A2 + 1.72B2 + 0.9251C2 | (5) |
| Ycoke yield = 6.86 − 0.7219A + 0.482B + 1.28C + 0.105AB − 0.08AC + 0.0525BC − 0.1424A2 − 0.4164B2 − 0.1389C2 | (6) |
| Run | Temperature (K) | Contact time (h) | Catalyst/feed ratio (w/v) | Conversion (%) | Oil yield (%) | Gas yield (%) | Coke yield (%) |
|---|---|---|---|---|---|---|---|
| Actual (coded) | Actual (coded) | Actual (coded) | |||||
| 1 | 698 (−1) | 0.08 (−1) | 0.1 (−1) | 63.54 | 40.95 | 53.81 | 5.24 |
| 2 | 748 (1) | 0.08 (−1) | 0.1 (−1) | 71.32 | 47.17 | 48.59 | 4.24 |
| 3 | 698 (−1) | 0.12 (1) | 0.1 (−1) | 74.97 | 50.76 | 43.58 | 5.66 |
| 4 | 748 (1) | 0.12 (1) | 0.1 (−1) | 76.08 | 49.5 | 45.7 | 4.8 |
| 5 | 698 (−1) | 0.08 (−1) | 0.2 (1) | 72.55 | 40.73 | 51.49 | 7.78 |
| 6 | 748 (1) | 0.08 (−1) | 0.2 (1) | 77.57 | 45.06 | 48.76 | 6.18 |
| 7 | 698 (−1) | 0.12 (1) | 0.2 (1) | 77.91 | 48.88 | 42.99 | 8.13 |
| 8 | 748 (1) | 0.12 (1) | 0.2 (1) | 86.92 | 46.65 | 46.12 | 7.23 |
| 9 | 680.96 (−1.682) | 0.1 (0) | 0.15 (0) | 70.56 | 42.65 | 49.25 | 8.1 |
| 10 | 765.04 (1.682) | 0.1 (0) | 0.15 (0) | 81.6 | 46.02 | 49.15 | 4.83 |
| 11 | 723 (0) | 0.0664 (−1.682) | 0.15 (0) | 66.45 | 39.94 | 55.62 | 4.44 |
| 12 | 723 (0) | 0.1336 (1.6812) | 0.15 (0) | 81.58 | 49.11 | 44.33 | 6.94 |
| 13 | 723 (0) | 0.1 (0) | 0.0659 (−1.682) | 67.68 | 46.44 | 49.51 | 4.05 |
| 14 | 723 (0) | 0.1 (0) | 0.2340 (1.682) | 83.83 | 45.17 | 45.93 | 8.9 |
| 15 | 723 (0) | 0.1 (0) | 0.15 (0) | 77.76 | 48.87 | 44.08 | 6.74 |
| 16 | 723 (0) | 0.1 (0) | 0.15 (0) | 77.97 | 49.18 | 43.95 | 6.92 |
| 17 | 723 (0) | 0.1 (0) | 0.15 (0) | 77.28 | 49.25 | 44.48 | 6.87 |
| 18 | 723 (0) | 0.1 (0) | 0.15 (0) | 78.12 | 48.97 | 44.29 | 6.84 |
| 19 | 723 (0) | 0.1 (0) | 0.15 (0) | 78.08 | 48.75 | 44.38 | 6.65 |
| 20 | 723 (0) | 0.1 (0) | 0.15 (0) | 77.98 | 48.65 | 43.61 | 7.14 |
The positive sign from the equation indicated the term had a synergetic effect, whereas the negative sign had an antagonistic effect on the responses.
Table 4 shows that all quadratic model responses were statistically significant, as indicated by the P-value at 95% confidence level was less than 0.05. It was revealed that the terms A, B, C, and B2 were significant in the response of conversion as well as coke yield. The terms A, B, C, AB, A2, B2, and C2 were considered significant in the response of oil yield, whereas in the gas yield model, the terms B, AB, A2, B2, and C2 were significant.
| Response | P-Value | Significant terms/F-value | Adequate precision | C.V% | Standard deviation |
|---|---|---|---|---|---|
| Conversion | <0.0001 | (A/<0.0001) | 21.9320 | 1.91 | 1.45 |
| (B/<0.0001) | |||||
| (C/<0.0001) | |||||
| (B2/0.0052) | |||||
| Oil yield | <0.0001 | (A/0.0048) | 14.5662 | 2.05 | 0.9567 |
| (B/<0.0001) | |||||
| (C/0.0264) | |||||
| (AB/0.0004) | |||||
| (A2/0.0004) | |||||
| (B2/0.0006) | |||||
| (C2/0.0114) | |||||
| Gas yield | <0.0001 | (B < 0.0001) | 15.2036 | 2.32 | 1.09 |
| (AB/0.0016) | |||||
| (A2/0.0005) | |||||
| (B2/0.0001) | |||||
| (C2/0.0092) | |||||
| Coke yield | <0.0001 | (A/<0.0001) | 17.1477 | 6.43 | 0.4104 |
| (B/0.0015) | |||||
| (C/<0.0001) | |||||
| (B2/0.0032) |
From Table 4, it can be seen that the adequate precision of all models was greater than 4 with a low standard deviation, which proved that the model could be used to navigate the desired design space.73 Moreover, the coefficient of variation (C.V) for all models, referred to as the overall mean experimental error, was lower than 15, which was suggested that the experiment was reliable.74
The diagnostic plots for all quadratic model are presented in Fig. 8. Fig. 8a shows that all the plots of the externally studied residuals were quite close to the normal probability diagonal, as revealed by the points falling close to the line adequately, which indicated that the developed quadratic model was normally distributed.75 Subsequently, as can be noticed in Fig. 8b, the points from variance plots of all models were randomly distributed. The points numbers presented in the upwards and bottom of the horizontal line were equal. Moreover, the residual values were located between ±3.00, which indicated that the proposed models had good precision and accuracy.76
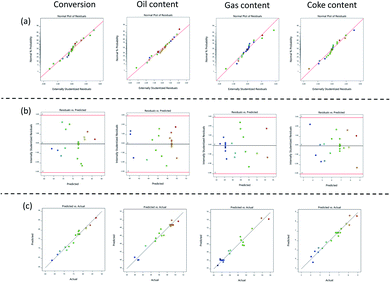 | ||
| Fig. 8 Diagnostic plots of (a) normal probability plot of residuals (b) variance plot (c) predicted vs. observed response value. | ||
Fig. 8c shows that the points, as a response value, generated by all models were on a line, which attributed to the fitness between the predicted and observed values.56 The R2 of the all models, namely 0.9675, 0.9547, 0.9525, and 0.9550 for conversion, oil yield, gas yield, and coke yield, respectively, revealed a high value of coefficient determination which closed to one. This condition indicated that the proposed models were nearly appropriate to the experimental data.77 Based on the model's diagnostic, it may be considered that the suggested model was statistically valid, which could accurately predict the response and assess the correlation of the variables studied.
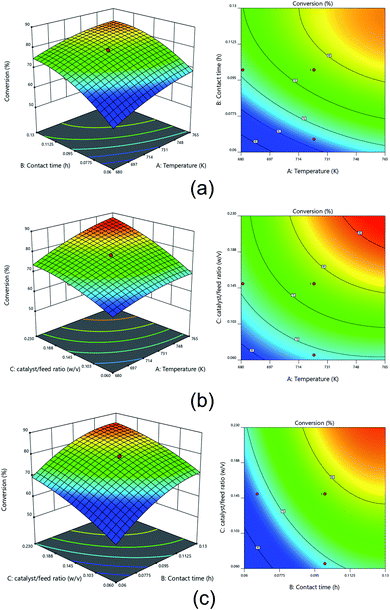
The 3D surface plots and 2D contour plots of the interaction between various process variables on the conversion of the hydrocracking process are depicted in Fig. 9. The interaction effect of contact time and temperature on conversion is shown in Fig. 9a. The catalyst to feed ratio variable was fixed at 0.15 w/v. It can be seen that the highest conversion more than 80% was achieved when the contact time was higher than 0.10 h and the temperature was higher than 173 K. The higher temperature in the hydrocracking process triggered the higher transfer of heat energy to the C–C bond accompanied by catalytic hydrogenation, thereby resulting in high conversion.78 Similarly, the longer the contact time, the more frequency collisions between the catalyst and palm oil occurred; therefore, the high temperature within a long contact time was favorable for resulting in the high conversion.79 The trends were also reported consistently by Lim et al.80 while investigating the effect of temperature and time on the hydrocracking of vacuum residues. Murachman et al.81 stated that the energy activation was more effectively achieved at a higher temperature, hence promoting high conversion of the hydrocracking process. The positive correlation between the temperature and conversion was also attributed to the incremented in molecules' reaction speed.
The interaction effect of temperature and catalyst to feed ratio on conversion at a fixed contact time of 0.1 h are shown in Fig. 9b. It was revealed that high catalyst to feed ratio with more than 0.20 w/v along with a reaction temperature more than 748 K was sufficient to generated conversion up to >85%. A high catalyst to feed ratio was attributed to a high total surface that efficiently promoted palm oil's hydrocracking. According to Alkhlel and de Lasa,82 the increase in the catalyst to feed ratio leads to the high density of the catalyst. Consequently, the interaction of the active site of catalysts with the adsorbed hydrocarbon species incremented. Simultaneously, the high temperature could increase the kinetic energy molecules, which inherently increases carbon bonds' cracking. According to Ahmad et al.83 a high hydrocracking temperature betrayed more triglycerides would be reacted, thus generating a high conversion of palm oil hydrocracking.
Fig. 9c shows the interaction effect of catalyst to feed ratio and contact time at a fixed temperature of 723 K on the conversion of palm oil hydrocracking. It was conspicuous that a high conversion was obtained up to more than 85% when the catalyst to feed ratio was more than 0.15 w/v with a minimum contact time of more than 0.10 h. A prolonged contact time indicated that the catalyst and the feed had sufficient time to diffuse and take place in the hydrocracking process.84 At the same time, a higher catalyst to feed ratio was directly attributed to the higher availability of the catalyst's active site. As a result, the hydrocracking process was more efficient and led to high conversion.
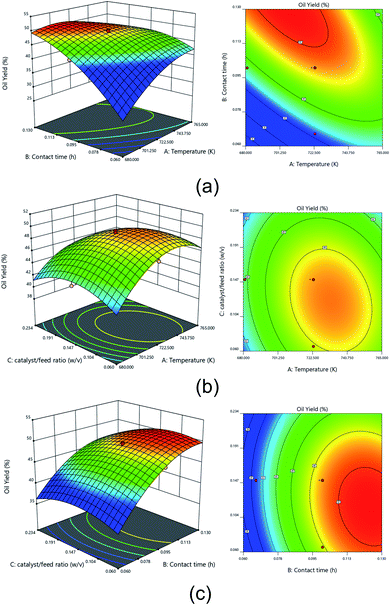
The 3D surface plots and 2D contour plots of the interaction between various process variables on the oil yield of the hydrocracking process are presented in Fig. 10. The interaction effect of contact time and temperature at a fixed catalyst to feed ratio of 0.15 w/v on oil yield is shown in Fig. 10a. It was found that oil yield reached a high value up to 45–50% at a temperature below 723 K and a contact time of 0.08–0.11 h. According to Dujjanutat and Kaewkannetra85 the decline of oil yield at higher temperatures was due to the cracking of liquid hydrocarbon into gaseous products. This trend was also consistent with other reports.86 Furthermore, when a contact time was higher than 0.11 h, the oil yield was gradually increased up to more than 50%. The chance of cracking as well as hydrogenation C–C bond into a prominent liquid phase such as oil was increased due to a long contact time, hence increasing the oil yield.
The dynamic interaction between temperature and catalyst to feed ratio at a fixed contact time of 0.10 h on oil yield is depicted in Fig. 10b as 3D surface plots and 2D contour plots. More than 48% of oil yield was achieved under a 710–758 K temperature and a 0.06–0.18 w/v catalyst weight to feed ratio. The carbenium ion required for catalytic cracking was longer available at high temperatures. Besides, the desired amount of catalyst that provides an active catalytic site was required to promote the hydrocracking of palm oil. At this condition, more hydrocarbon molecules were cracked into short-chain hydrocarbon molecules.81 As a result, oil yield also increased with incrementing temperature. Nevertheless, when the temperature was too high, it would cause the cracking of short-chain hydrocarbon to form a gaseous substance such as methane and so forth, thereby decreasing the oil yield. Furthermore, Fig. 10b also revealed that too high catalyst to feed ratio (>0.18 w/v) presumably exhibits high gas production since it would provide a high active catalyst site and potentially enhance further hydrocracking such as secondary cracking of oil to gas, which consequently generated a low oil yield.87
The interaction effect of contact time and catalyst to feed ratio at a fixed temperature of 723 K on oil yield is shown in Fig. 10c. It was apparent the most effective hydrocracking process was obtained at the catalyst to feed ratio below 0.15 w/v and contact time higher than 0.11 h. At this condition, the oil yield was achieved up to 50%. It can be seen that a long contact time with more than 0.10 h could increase the oil yield up to 50%. Furthermore, a high catalyst feed to ratio with a long contact time could incline the oil yield. The increase in the catalytic activity might be attributed to the increase in the catalyst to feed ratio. However, because the hydrogen pressure was kept constant during hydrocracking, the gas supply for hydrogenation was presumably inadequate at high catalyst to feed ratios, which exhibited catalyst deactivation via the formation of coke, consequently decreasing the oil yield.88
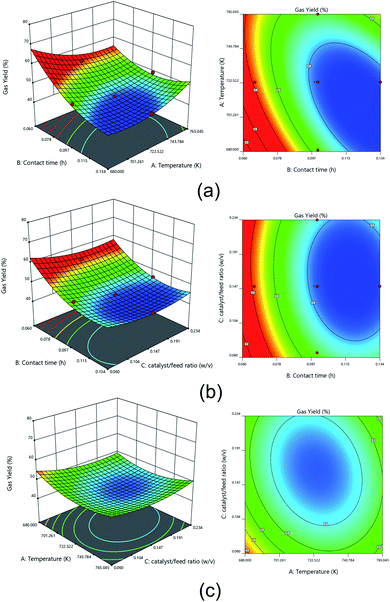
Fig. 11 presents the 3D surface plots and 2D contour plots of the interaction between various process variables on the gas yield of the hydrocracking process. The effect of temperature and contact time at a fixed catalyst to feed ratio of 0.15 w/v on gas yield is shown in Fig. 11a. It can be seen that a high temperature and a long contact time accommodated high gas yield due to the secondary cracking of oil into low molecular gas. Moreover, it seemed that the high gas yield was achieved at a short contact time, which was consistent with another previous report.20
The effect of temperature and catalyst to feed ratio at a constant contact time of 0.10 h on gas yield is presented in Fig. 11b. Similarly, as depicted in Fig. 11a, it can be seen that a prolonged contact time decreased the gas yield. When the hydrocracking was conducted at a short contact time, a catalyst to feed ratio significantly impacted the high gas yield. In this interaction, as the catalyst feed to ratio increased, the catalyst prominently promoted the cracking and hydrogenation reaction also increased, thus forming a dominant gaseous product. High active site catalyst availability accompanied high gaseous product.89
Fig. 11c shows a dynamic interaction between temperature and catalyst to feed ratio at a fixed contact time of 0.10 h. It can be seen that low catalyst to feed ratio and temperature led to low reaction rates and thus formed a dominant gaseous. Meanwhile, a higher catalyst to feed ratio and temperature promoted a high uncontrolled hydrocracking reaction, thus generating more gaseous products.
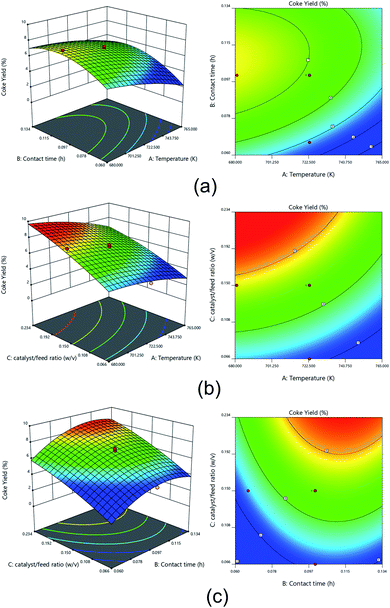
Fig. 12 shows the 3D surface plots and 2D contour plots of the interaction between various process variables on the coke yield of the hydrocracking process. The interaction effect of contact time and temperature on coke yield at a catalyst to feed ratio of 0.15 w/v is shown id Fig. 12a.
It can be seen that there was an increase in coke yield as the contact time increased. This condition was consistent according to previous reports.90 During a prolonged contact time of hydrocracking process, the polymerization reactions might readily occur between heavy molecules in the residual fraction. Under these conditions, heavy molecules turned into heavier molecules such as coke.91
Fig. 12b shows the interaction effect of temperature and catalyst to feed ratio at a constant contact time of 0.10 h on coke yield. It was observed that highest coke was produced under high catalyst to feed ratio and temperature range of 680.96–723.00 K. The high catalyst to feed ratio causes high catalytic activity at the beginning of the cracking reaction, and subsequently more coke was formed on the catalyst. Similar trend was also reported by other reports.92 The formation of coke was undesired since it could inhibit the hydrocracking process.71 Coke had the capability of covering the catalyst surface and clogging the acid sites of the catalyst. Therefore, coke formation could block the catalyst pores, resulting in deactivation.93 Thus, the accessibility of the reactants to the catalyst site was limited. Consequently, the catalytic activity decreased with increasing coke yield.
Fig. 12c represents the interaction effect of contact time and catalyst to feed ratio at constant temperature of 723 K on coke yield. It can be seen that a prolonged contact time and high catalyst to feed ratio increased the coke yield. As long as the catalyst reacts with the reactants, the C–H bonds tend to break to form an aromatics compound as a coke precursor. Therefore, the longer the contact time, the more coke formed.
Optimization using desirability function
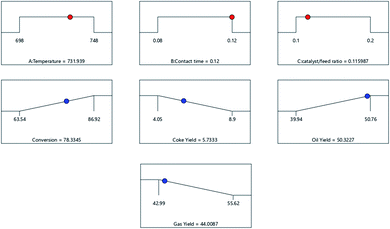
The optimum condition of each combination of factors that simultaneously the responses was determined using a desirability function through numerical optimization. The response, namely the conversion and oil yield, was maximized in this study. On the other hand, the gas and coke yields were minimized because gas and coke products were undesirable in the hydrocracking process. The optimum conditions solution generated by the desirability function with numerical optimization is shown in Fig. 13.As shown in Fig. 13, the optimum condition was achieved at a temperature of 731.94 K, contact time of 0.12 h, and a catalyst to feed ratio of 0.12 w/v with a conversion of 78.33%, oil yield of 50.32%, gas yield of 44% and coke yield of 5.73%. The desirability value was found to be 0.77. The results calculated by the experiment were compared with the predicted results to confirm the optimum conditions. It was observed that the experimental and the approximate prediction results indicated that the selected model was adequate to predict the optimal conditions for hydrocracking palm oil using MoM-bentonite. As a consequence, the study of variables related to experimental planning finally made hydrocracking of palm oil potentially more effective because it resulted in optimum responses.
Conclusions
Molybdenum nitride-bentonite was successfully used in the hydrocracking process for bio-gasoline and bio-aviation fuel from palm oil. XRD, FT-IR, and SEM-EDX showed that bentonite had been favorably modified by molybdenum nitride as well as increased the catalyst acidity. The highest conversion and product fraction of bio-gasoline and bio-aviation were obtained by MoN-bentonite 8 mEq g−1. Further study of MoN-bentonite 8 mEq g−1 was used in the optimization hydrocracking process by RSM-CCD. Statistical analysis showed that the quadratic models were statistically significant to explain the interaction between the process and responses variables with adequate precision. The optimum condition in the hydrocracking process was achieved at a temperature of 731.94 K, contact time of 0.12 h, and a catalyst to feed ratio of 0.12 w/v with a conversion of 78.33%, the oil yield of 50.32%, gas yield of 44%, and coke yield of 5.73%. The closeness in the optimal value of the anticipated yield and confirmation by the RSM-CCD was proved as its potential tool for estimating the hydrocracking process of palm oil using MoN-bentonite catalyst.Conflicts of interest
There are no conflicts of interest to declare.Acknowledgements
This work was supported by Universitas Sriwijaya through Hibah Kompetitif 2022 No. 0109/UN9.3.1/SK/2022.References
- E. P. Sari, K. Wijaya, W. Trisunaryanti, A. Syoufian, H. Hasanudin and W. D. Saputri, Int. J. Energy Environ. Eng., 2021, 1–12 Search PubMed.
- Z. X. Xu, P. Liu, G. S. Xu, Q. Liu, Z. X. He and Q. Wang, Energy, 2017, 133, 666–675 CrossRef CAS.
- H. Zhang, Y. Fang, M. Wang, L. Appels and Y. Deng, J. Environ. Manage., 2020, 274, 111214 CrossRef CAS PubMed.
- K. N. Papageridis, N. D. Charisiou, S. Douvartzides, V. Sebastian, S. J. Hinder, M. A. Baker, A. A. AlKhoori, S. I. AlKhoori, K. Polychronopoulou and M. A. Goula, RSC Adv., 2021, 11, 8569–8584 RSC.
- K. N. Papageridis, N. D. Charisiou, S. Douvartzides, V. Sebastian, S. J. Hinder, M. A. Baker, A. A. AlKhoori, S. I. AlKhoori, K. Polychronopoulou and M. A. Goula, RSC Adv., 2021, 11, 8569–8584 RSC.
- Y. Liu, K. Murata and M. Inaba, Catal. Today, 2019, 332, 115–121 CrossRef CAS.
- H. I. Mahdi, A. Bazargan, G. McKay, N. I. W. Azelee and L. Meili, Chem. Eng. Res. Des., 2021, 174, 158–187 CrossRef CAS.
- C. A. Scaldaferri and V. M. D. Pasa, Fuel, 2019, 245, 458–466 CrossRef CAS.
- J. L. Sihombing, A. N. Pulungan, H. Herlinawati, M. Yusuf, S. Gea, H. Agusnar, B. Wirjosentono and Y. A. Hutapea, Catalysts, 2020, 10, 1–14 CrossRef.
- S. Shin, J. H. Lee, Y. K. Jo, M. T. Nguyen, B. K. Park, S. Park, C. W. Lee, C. G. Kim and T. M. Chung, J. Ind. Eng. Chem., 2019, 72, 408–413 CrossRef CAS.
- M. Utami, K. Wijaya and W. Trisunaryanti, Mater. Chem. Phys., 2018, 213, 548–555 CrossRef CAS.
- Y. W. Mirzayanti, F. Kurniawansyah, D. H. Prajitno and A. Roesyadi, Bull. Chem. React. Eng. Catal., 2018, 13, 136–143 CrossRef CAS.
- Z. Eller, Z. Varga and J. Hancsók, Fuel, 2016, 182, 713–720 CrossRef CAS.
- A. Ishihara, N. Fukui, H. Nasu and T. Hashimoto, Fuel, 2014, 134, 611–617 CrossRef CAS.
- V. V. Kuss, A. V. Kuss, R. G. Da Rosa, D. A. G. Aranda and Y. R. Cruz, Renewable Sustainable Energy Rev., 2015, 50, 1013–1020 CrossRef.
- M. Nor Irham Nor Azan, P. N. S. M. M. Kamal, M. A. A. Rasmadi, M. H. Adzhar, M. A. Zakaria, A. S. A. Taufek, N. S. M. Nasir and A. S. Alikasturi, Mater. Today: Proc., 2020, 31, 292–299 CAS.
- H. Purnomo, B. Okarda, A. Dermawan, Q. P. Ilham, P. Pacheco, F. Nurfatriani and E. Suhendang, For. Pol. Econ., 2020, 111, 102089 CrossRef.
- K. Wijaya, A. Nadia, A. Dinana, A. F. Pratiwi, A. D. Tikoalu and A. C. Wibowo, Catalysts, 2021, 11, 1150 CrossRef CAS.
- A. E. Barrón C., J. A. Melo-Banda, J. M. Dominguez E., E. Hernández M., R. Silva R., A. I. Reyes T. and M. A. Meraz M., Catal. Today, 2011, 166, 102–110 CrossRef.
- C. H. Zandonai, P. H. Yassue-Cordeiro, S. B. Castellã-Pergher, M. H. N. O. Scaliante and N. R. C. Fernandes-Machado, Fuel, 2016, 172, 228–237 CrossRef CAS.
- J. Cheng, Z. Zhang, X. Zhang, J. Liu, J. Zhou and K. Cen, Int. J. Hydrogen Energy, 2019, 44, 1650–1658 CrossRef CAS.
- T. Li, J. Cheng, R. Huang, W. Yang, J. Zhou and K. Cen, Int. J. Hydrogen Energy, 2016, 41, 21883–21887 CrossRef CAS.
- G. Dou and J. L. Goldfarb, Fuel, 2017, 195, 273–283 CrossRef CAS.
- A. M. Elfadly, I. F. Zeid, F. Z. Yehia, M. M. Abouelela and A. M. Rabie, Fuel Process. Technol., 2017, 163, 1–7 CrossRef CAS.
- A. Veses, M. Aznar, J. M. López, M. S. Callén, R. Murillo and T. García, Fuel, 2015, 141, 17–22 CrossRef CAS.
- Y. Kar, Biomass Bioenergy, 2018, 119, 473–479 CrossRef CAS.
- B. Daroughegi Mofrad, M. Hayati-Ashtiani and M. Rezaei, Asia-Pac. J. Chem. Eng., 2018, 13, 1–11 CrossRef.
- W. Hamza, C. Chtara and M. Benzina, Res. Chem. Intermed., 2015, 41, 6117–6140 CrossRef CAS.
- S. Mnasri-Ghnimi and N. Frini-Srasra, Appl. Clay Sci., 2014, 88–89, 214–220 CrossRef CAS.
- A. Pérez, M. Montes, R. Molina and S. Moreno, Appl. Clay Sci., 2014, 95, 18–24 CrossRef.
- K. Wijaya, A. Syoufian, A. Fitroturokhmah, W. Trisunaryanti, D. Adi Saputra and H. Hasanudin, Nano Hybrids and Composites, 2019, 27, 31–37 Search PubMed.
- K. Wijaya, A. D. Ariyanti, I. Tahir, A. Syoufian, A. Rachmat and H. Hasanudin, Nano Hybrids and Composites, 2018, 19, 46–54 Search PubMed.
- F. M. T. Luna, J. A. Cecilia, R. M. A. Saboya, D. Barrera, K. Sapag, E. Rodríguez-Castellón and C. L. Cavalcante, Materials, 2018, 11, 6–9 CrossRef PubMed.
- A. Suseno, IOP Conf. Ser.: Mater. Sci. Eng., 2019, 509, 012005 CAS.
- K. Wijaya, M. A. Kurniawan, W. D. Saputri, W. Trisunaryanti, M. Mirzan, P. L. Hariani and A. D. Tikoalu, J. Environ. Chem. Eng., 2021, 9, 105399 CrossRef CAS.
- Y. C. Lin, C. L. Li, H. P. Wan, H. T. Lee and C. F. Liu, Energy Fuels, 2011, 25, 890–896 CrossRef CAS.
- T. Nimmanwudipong, R. C. Runnebaum, D. E. Block and B. C. Gates, Catal. Lett., 2011, 141, 779–783 CrossRef CAS.
- H. Y. Zhao, D. Li, P. Bui and S. T. Oyama, Appl. Catal., A, 2011, 391, 305–310 CrossRef CAS.
- A. Gutierrez, R. K. Kaila, M. L. Honkela, R. Slioor and A. O. I. Krause, Catal. Today, 2009, 147, 239–246 CrossRef CAS.
- M. Ruangudomsakul, N. Osakoo, J. Wittayakun, C. Keawkumay, T. Butburee, S. Youngjan, K. Faungnawakij, Y. Poo-arporn, P. Kidkhunthod and P. Khemthong, Mol. Catal., 2021, 111422 Search PubMed.
- S. Boullosa-Eiras, R. Lødeng, H. Bergem, M. Stöcker, L. Hannevold and E. A. Blekkan, Catal. Today, 2014, 223, 44–53 CrossRef CAS.
- V. Tagliazucca, M. Leoni and C. Weidenthaler, Phys. Chem. Chem. Phys., 2014, 16, 6182–6188 RSC.
- K. J. Smith, Curr. Opin. Green Sustainable Chem., 2020, 22, 47–53 CrossRef.
- I. T. Ghampson, C. Sepúlveda, R. Garcia, L. R. Radovic, J. L. G. Fierro, W. J. Desisto and N. Escalona, Appl. Catal., A, 2012, 439–440, 111–124 CrossRef CAS.
- U. Akhmetzyanova, Z. Tišler, N. Sharkov, L. Skuhrovcová, L. Pelíšková, O. Kikhtyanin, P. Mäki-Arvela, M. Opanasenko, M. Peurla and D. Y. Murzin, ChemistrySelect, 2019, 4, 8453–8459 CrossRef CAS.
- S. Podila, S. F. Zaman, H. Driss, Y. A. Alhamed, A. A. Al-Zahrani and L. A. Petrov, Catal. Sci. Technol., 2016, 6, 1496–1506 RSC.
- C. Shi, A. M. Zhu, X. F. Yang and C. T. Au, Appl. Catal., A, 2005, 293, 83–90 CrossRef CAS.
- M. Abou Hamdan, A. Nassereddine, R. Checa, M. Jahjah, C. Pinel, L. Piccolo and N. Perret, Front. Chem., 2020, 8, 1–12 CrossRef PubMed.
- S. Wang, H. Ge, S. Sun, J. Zhang, F. Liu, X. Wen, X. Yu, L. Wang, Y. Zhang, H. Xu, J. C. Neuefeind, Z. Qin, C. Chen, C. Jin, Y. Li, D. He and Y. Zhao, J. Am. Chem. Soc., 2015, 137, 4815–4822 CrossRef CAS PubMed.
- X. Fu, H. Su, W. Yin, Y. Huang and X. Gu, Catal. Sci. Technol., 2017, 7, 1671–1678 RSC.
- N. Abdel Karim Aramouni, J. Zeaiter, W. Kwapinski, J. J. Leahy and M. N. Ahmad, J. CO2 Util., 2021, 44, 101411 CrossRef CAS.
- H. Hasanudin, W. R. Asri, K. Tampubolon, F. Riyant, W. Purwaningrum and K. Wijaya, Pertanika Journal of Science and Technology, 2022, 30, 1739–1754 Search PubMed.
- A. Mara, K. Wijaya, W. Trisunaryati and M. Mudasir, AIP Conf. Proc., 2016, 1725, 020042 CrossRef.
- H. Hasanudin, A. Rachmat, M. Said and K. Wijaya, Period. Polytech., Chem. Eng., 2020, 64, 238–247 CrossRef CAS.
- Z. Chen, Y. Cao, Y. Ma, C. Au, L. Jiang and X. Bao, Ind. Eng. Chem. Res., 2019, 58, 2689–2696 CrossRef CAS.
- Z. Nasri and M. Mozafari, J. Pet. Sci. Eng., 2018, 161, 427–444 CrossRef CAS.
- A. Pugazhendhi, A. Alagumalai, T. Mathimani and A. E. Atabani, Fuel, 2020, 273, 117725 CrossRef CAS.
- A. Akkouche, A. Benmounah, A. Gueciouer and K. Chalah, Egypt. J. Pet., 2020, 29, 127–131 CrossRef.
- M. Benchikhi, R. El Ouatib, S. Guillemet-Fritsch, L. Er-Rakho and B. Durand, Int. J. Miner., Metall. Mater., 2016, 23, 1340–1345 CrossRef CAS.
- Z. Cheng, W. Qi, C. H. Pang, T. Thomas, T. Wu, S. Liu and M. Yang, Adv. Funct. Mater., 2021, 31, 1–22 Search PubMed.
- E. Fosso-Kankeu, F. Waanders and C. L. Fourie, Desalin. Water Treat., 2016, 57, 27663–27671 CAS.
- A. Kadeche, A. Ramdani, M. Adjdir, A. Guendouzi, S. Taleb, M. Kaid and A. Deratani, Res. Chem. Intermed., 2020, 46, 4985–5008 CrossRef CAS.
- L. G. Yan, L. L. Qin, H. Q. Yu, S. Li, R. R. Shan and B. Du, J. Mol. Liq., 2015, 211, 1074–1081 CrossRef CAS.
- M. Toor, B. Jin, S. Dai and V. Vimonses, J. Ind. Eng. Chem., 2015, 21, 653–661 CrossRef CAS.
- F. W. Harun, S. B. Mahamat Nor and S. S. Othman, Malaysian Journal of Science Health & Technology, 2018, 1, 21–24 Search PubMed.
- Z. Huang, Y. Li, W. Chen, J. Shi, N. Zhang, X. Wang, Z. Li, L. Gao and Y. Zhang, Mater. Chem. Phys., 2017, 202, 266–276 CrossRef CAS.
- H. Wu and L. Hu, Appl. Clay Sci., 2014, 101, 503–509 CrossRef CAS.
- S. J. Sekewael, R. A. Pratika, L. Hauli, A. K. Amin, M. Utami and K. Wijaya, Catalysts, 2022, 12, 1–24 CrossRef.
- K. Sharifi, R. Halladj and S. J. Royaee, Rev. Adv. Mater. Sci., 2020, 59, 188–206 CAS.
- R. Saab, K. Polychronopoulou, L. Zheng, S. Kumar and A. Schiffer, J. Ind. Eng. Chem., 2020, 89, 83–103 CrossRef CAS.
- R. Hamidi, R. Khoshbin and R. Karimzadeh, Adv. Powder Technol., 2021, 32, 524–534 CrossRef CAS.
- K. Wijaya, S. E. Purba, W. Trisunaryanti and R. A. Pratika, Mediterr. J. Chem., 2021, 11, 75 CrossRef.
- B. Morero, E. S. Groppelli and E. A. Campanella, J. Cleaner Prod., 2017, 141, 978–988 CrossRef CAS.
- Y. Wu, L. Yi, E. Li, Y. Li, Y. Lu, P. Wang, H. Zhou, J. Liu, Y. Hu and D. Wang, Int. J. Biol. Macromol., 2017, 102, 68–75 CrossRef CAS PubMed.
- D. B. Meza-Ramírez, C. Hernández-Benítez, A. Contreras-Arias, L. A. Godínez and F. J. Rodríguez-Valadez, Fuel, 2021, 288, 119645 CrossRef.
- Z. Hajamini, M. A. Sobati, S. Shahhosseini and B. Ghobadian, Appl. Therm. Eng., 2016, 94, 1–10 CrossRef.
- M. Said, M. M. Ba-Abbad, S. R. S. Abdullah and A. W. Mohammad, International Journal on Advanced Science, Engineering and Information Technology, 2017, 7, 1871–1878 CrossRef.
- M. Pan, J. Zheng, Y. Liu, W. Ning, H. Tian and R. Li, J. Catal., 2019, 369, 72–85 CrossRef CAS.
- Z. Fanani, H. Hasanudin, A. Rachmat and M. Said, Molekul, 2021, 16, 244–252 CrossRef.
- S. H. Lim, K. S. Go, N. S. Nho and J. G. Lee, Fuel, 2018, 234, 305–311 CrossRef CAS.
- B. Murachman, D. Deendarlianto, H. F. Nissaraly and W. Hasyim, ASEAN J. Chem. Eng., 2014, 14, 59–75 CrossRef.
- A. Alkhlel and H. De Lasa, Catalysts, 2019, 9, 542 CrossRef CAS.
- M. Ahmad, R. Farhana, A. A. A. Raman and S. K. Bhargava, Energy Convers. Manage., 2016, 119, 352–360 CrossRef CAS.
- M. Millan, C. Adell, C. Hinojosa, A. A. Herod, D. Dugwell and R. Kandiyoti, Energy Fuels, 2007, 21, 1370–1378 CrossRef CAS.
- P. Dujjanutat and P. Kaewkannetra, Renewable Energy, 2020, 147, 464–472 CrossRef CAS.
- J. Cheng, T. Li, R. Huang, J. Zhou and K. Cen, Bioresour. Technol., 2014, 158, 378–382 CrossRef CAS PubMed.
- M. B. Mampuru, D. B. Nkazi and H. E. Mukaya, Energy Sources, Part A, 2020, 42, 2564–2575 CrossRef CAS.
- M. B. Mampuru, D. B. Nkazi and H. E. Mukaya, Energy Sources, Part A, 2020, 42, 2564–2575 CrossRef CAS.
- T. A. Ngo, J. Kim, S. K. Kim and S. S. Kim, Energy, 2010, 35, 2723–2728 CrossRef CAS.
- H. Rezaei, S. J. Ardakani and K. J. Smith, Energy Fuels, 2012, 26, 2768–2778 CrossRef CAS.
- N. T. Nguyen, S. Park, J. Jung, J. Cho, C. W. Lee and Y. K. Park, J. Ind. Eng. Chem., 2018, 61, 32–38 CrossRef CAS.
- G. Y. Nazarova, E. N. Ivashkina, E. D. Ivanchina and M. Y. Mezhova, Catalysts, 2022, 12, 98 CrossRef CAS.
- N. Hosseinpour, A. A. Khodadadi, Y. Mortazavi and A. Bazyari, Appl. Catal., A, 2009, 353, 271–281 CrossRef CAS.
| This journal is © The Royal Society of Chemistry 2022 |

