 Open Access Article
Shape controllable MoS2 nanocrystals prepared by the single precursor route for electrocatalytic hydrogen evolution†
Fengyi Wu *,
Xiaoyong Xu,
Zhong Xie,
Yaqiong Kong,
Duojun Cao and
Jiliang Yang
School of Chemistry and Material Engineering, Institute of Novel Functional Materials, Chaohu University, Hefei 238000, P. R. China. E-mail: wfy@chu.edu.cn; Fax: +86-551-82362251
First published on 19th August 2022
Abstract
MoS2 has attracted great attention as a prospective electrocatalyst for generating hydrogen via water electrolysis due to its abundant and inexpensive sources. However, bulk MoS2 has weak electrocatalytic activity because of its low electrical conductivity and few edge-active sites. Controllable synthesis of MoS2 with ultrasmall size or complex morphology may be an available strategy to boost its conductivity and edge-active sites. Herein, a facile single-precursor strategy was developed to prepare nanoscale MoS2 with various morphologies, including quantum dots, nanorods, nanoribbons, and nanosheets. In-depth studies show that the formation of MoS2 with various shapes is determined by both kinetic and thermodynamic factors such as reaction time and temperature. Electrocatalytic tests reveal that MoS2 quantum dots have high electrocatalytic performance with a low overpotential of 255 mV and a small Tafel slope of 66 mV dec−1 due to the abundant exposed active edges and excellent intrinsic conductivity.
1. Introduction
Hydrogen, as a clean and efficient energy material, is one of the most encouraging substitutions for traditional petrochemical fuels.1 Electrocatalytic water splitting is predicted to be a significant source of hydrogen, which commonly involves the hydrogen evolution reaction (HER).2 Therefore, it is crucial for HER to design and fabricate high-efficiency and cost-effective electrocatalysts. Platinum-based catalysts are currently thought to be the most efficient catalysts for HER.3 However, the high cost and rareness of the noble metal catalysts limit their wide application.4To date, extensive efforts have been devoted to the development of economical and highly-efficient electrocatalysts such as transition metals-based catalysts.5 Abundant and cheap MoS2 has been considered a promising alternative for traditional platinum (Pt)-group catalyzers since it was discovered that the hydrogen-binding-energy of MoS2 was comparable to that of Pt metals.6 However, as for bulk MoS2, low conductivity and few effective active sites are the two main factors that limit the catalytic performance for HER. Studies show the conductivity and active sites of MoS2 increased with the decreasing of MoS2 layers.7 Hence, devising and synthesis MoS2 with a small size and complex morphology is believed as an effective strategy to improve the HER performance.8 So far, MoS2 with various shapes were synthesized, including mesopores,9 nanotubes,10 nanoflowers,11 nanoribbons,12 nanosheets,13 quantum dots,14 etc. Among them, zero-dimensional MoS2 quantum dots (QDs) are the most favorable candidates for HER due to the greater number of edge-active sites and higher carrier mobility.15
To date, there are several methods to fabricate MoS2 QDs, such as sonication-assisted liquid exfoliation,16 electrochemical synthesis,17 and electro-Fenton reaction.18 Although the approaches have their advantages, there still are some issues, such as time-consuming, high-energy consumption, and environmental unfriendliness. Recently, the preparation of MoS2 QDs mainly adopts a hydrothermal reaction with different Mo and S double precursors.19 However, due to the unobservable “black box” hydrothermal reaction process in a closed system, it is a paucity of in-depth research on the formation of MoS2 nanocrystalline nuclei and the regulating parameters for crystal growth. Furthermore, the hydrothermal reaction normally necessitates high-temperature and high-pressure circumstances, which can limit the application of the hydrothermal method to some extent.20 Very recently, pyrolysis of single-source precursor in solution is quickly becoming a popular method to obtain various semiconductor nanomaterials.21 The reactivity and stoichiometry matching does not need to be considered in single-precursor cleavage reactions.22 Moreover, single-precursor-cracking can be performed in glassware under atmospheric pressure, which improves the observability, convenience, and security of reactions.23 To our knowledge, few investigations have been dedicated to the single-source precursor strategy for the synthesis of MoS2 nanomaterials with particular shapes.
Herein, we first reported the synthesis of MoS2 QDs via thermolysis of molybdenum diethyldithiocarbamate (MoDTC) in 1-octadecene. Besides, other shapes of MoS2, including nanorods, nanobelts, and nanosheets, can also be obtained by simply varying experimental process conditions. A possible mechanism was tentatively suggested for the forming of the MoS2 with various morphologies based on the control experiment. The electrocatalytic activity of MoS2 with different shapes was investigated separately, among which the MoS2 QDs showed higher electrocatalytic performance.
2. Experimental section
2.1 Materials
Sodium diethyldithiocarbamate trihydrate (NaDDTC·3H2O, 99%), sodium molybdate dihydrate (Na2MoO4·2H2O), 1-octadecene (1-ODE, 90%), and 1-dodecanethiol (DDT, C12H25SH, 99.5%) were provided by Sinopharm Chemical Reagent Co., Ltd. Aldrich provided analytical solvents such as methanol, ethanol, acetone, and n-hexane. All solvents and reactants were employed without additional purification.2.2 Synthesis of precursor
The synthesis of molybdenum diethyldithiocarbamate (MoDTC) referred to previous literature with a simple modification.24 Typically, 0.05 mol (11.28 g) of NaDDTC·3H2O was firstly dissolved in 100 mL of deionized water. Next, 0.025 mol of Na2MoO4·2H2O (6.05 g) was added to 50 mL of deionized water, and pH was regulated to 3 with 0.1 M sulfuric acid. And then, Na2MoO4 solution was dripped slowly into NaDDTC solution with vigorous stirring. The mixed solution was heated to 95 °C and held the temperature for 4 hours. Following that, a yellow precipitate formed. The sediment was alternately washed with distilled water and anhydrous methanol three times. The final product in yellow powder form was obtained via vacuum drying at 60 °C for 12 h.2.3 Synthesis of MoS2 QDs
A typical preparation of MoS2 QDs was as follows. 0.25 mmol of MoDTC (216 mg) and 1 mL of 1-dodecanethiol (1-DDT) were respectively added to a 100 mL reaction vessel loaded with 20 mL of 1-ODE. With 30 minutes of nitrogen exposure, the flask was heated to 160 °C at a rate of 25 °C min−1. The reactants maintain the temperature for 90 min with strong agitation. Consequently, the glass reactor was cooled naturally to room temperature in a heating sleeve. Then, the solution in the above reactor was added to 30 mL of acetone and carefully heated to about 40 °C with vigorous stirring for 10 min. After that, the flask was removed from the heating sleeve and cooled in an ice-water bath. The supernatant was charily drawn and then was added 75 mL n-hexane. The mixture solution was swiftly centrifuged at 10![[thin space (1/6-em)]](https://www.rsc.org/images/entities/char_2009.gif) 000 rpm for 10 min. As-collected precipitation was alternately washed with n-hexane and acetone via the extraction-purification technique. Finally, after drying at 50 °C in a vacuum overnight, the target product was obtained.
000 rpm for 10 min. As-collected precipitation was alternately washed with n-hexane and acetone via the extraction-purification technique. Finally, after drying at 50 °C in a vacuum overnight, the target product was obtained.
2.4 Fabrication of MoS2 nanorods, nanoribbons, and bulks
The synthesis of MoS2 nanorods, nanoribbons, and bulks is similar to that of MoS2 QDs except for reaction temperature. The detailed preparation procedures were given in the ESI.†2.5 Electrical performance test
Electrochemical tests were implemented on a CHI 660D electrochemical workstation with a three-electrode cell in 0.5 mol L−1 H2SO4 solutions, using a Pt piece as a counter electrode, Ag/AgCl as a reference electrode, and modified conductive glass (ITO) as a working electrode. The electrode was synthesized as follows: 1 mg of MoS2 nanomaterials were dispersed in 2 mL of ethanol aqueous solution (water and ethanol volume ratio of 3![[thin space (1/6-em)]](https://www.rsc.org/images/entities/char_2009.gif) :
:![[thin space (1/6-em)]](https://www.rsc.org/images/entities/char_2009.gif) 1), and then 20 μL of 5 wt% Nafion solution was added into the suspension. With the 15 min of ultrasound, 150 μL of the suspension was dropped onto an ITO (2 × 2 cm) and dried to obtain the modified working electrode.
1), and then 20 μL of 5 wt% Nafion solution was added into the suspension. With the 15 min of ultrasound, 150 μL of the suspension was dropped onto an ITO (2 × 2 cm) and dried to obtain the modified working electrode.
2.6 Characterization
A JEOL JEM-2100F was used to take transmission electron microscope images (TEM) of samples with a 200 kV operating voltage. Elements of reactant products were analyzed using an ESCALAB250Xi X-ray photoelectron spectroscopy (XPS). A Nicolet 67 Fourier transform infrared (FTIR) spectrometer was used to detect groups attached to the surface of samples. The phase and structure of samples were indexed using a Bruker D8 Avance X-ray diffractometer (XRD) with the Cu Kα radiation (λ = 1.5418 Å). Raman spectroscopy data of simples was measured by a Horiba Lab RAM HR Evolution spectroscopy excited at 514 nm with a resolution limit of 1 cm−1. A potentiostat (CHI660D) was used to measure the electrochemical performance of MoS2 materials.3. Results and discussion
3.1 Characterization of the precursor
To prepare MoS2 nanocrystals, a pale-yellow powder precursor was initially synthesized as displayed in the inset of Fig. S1.† The XRD of the precursor is shown in Fig. S1.† The three largest diffraction peaks at 11.97°, 12.23° and 12.37° correspond to the (110),![[( with combining macron]](https://www.rsc.org/images/entities/char_0028_0304.gif) 111), and (200) of the MoDTC phase (JCPDS card No. 25-1978).24 According to the XPS survey spectrum (Fig. S2(a)†), the precursor is composed of molybdenum (Mo), sulfur (S), oxygen (O), and nitrogen (N) elements, besides carbon. In Fig. S2(b),† Mo 3d peak of MoDTC is 230.4, 231.8, 233.6 and 235.0 eV, attributed to the MoIV (3d5/2), MoVI (3d5/2), MoIV+ (3d3/2) and MoVI+ (3d3/2).25 Fig. S2(c)† reveals the two contributions, one around 162.3 eV and the other near 163.5 eV, corresponding to S 2p3/2, and S 2p1/2, respectively. The O 1s is 530.1 eV and 532.8 eV, which originate from the banding energy of Mo–O of MoDTC and oxygen from the environment, respectively (Fig. S2(d)†).26 The MoDTC precursor can be pyrolyzed in 1-ODE to synthesize MoS2 nanomaterials with controllable morphologies by using a simple and skillfully colloidal nanochemistry approach.
111), and (200) of the MoDTC phase (JCPDS card No. 25-1978).24 According to the XPS survey spectrum (Fig. S2(a)†), the precursor is composed of molybdenum (Mo), sulfur (S), oxygen (O), and nitrogen (N) elements, besides carbon. In Fig. S2(b),† Mo 3d peak of MoDTC is 230.4, 231.8, 233.6 and 235.0 eV, attributed to the MoIV (3d5/2), MoVI (3d5/2), MoIV+ (3d3/2) and MoVI+ (3d3/2).25 Fig. S2(c)† reveals the two contributions, one around 162.3 eV and the other near 163.5 eV, corresponding to S 2p3/2, and S 2p1/2, respectively. The O 1s is 530.1 eV and 532.8 eV, which originate from the banding energy of Mo–O of MoDTC and oxygen from the environment, respectively (Fig. S2(d)†).26 The MoDTC precursor can be pyrolyzed in 1-ODE to synthesize MoS2 nanomaterials with controllable morphologies by using a simple and skillfully colloidal nanochemistry approach.
3.2 Formation of different shapes of MoS2 nanocrystals with reaction time
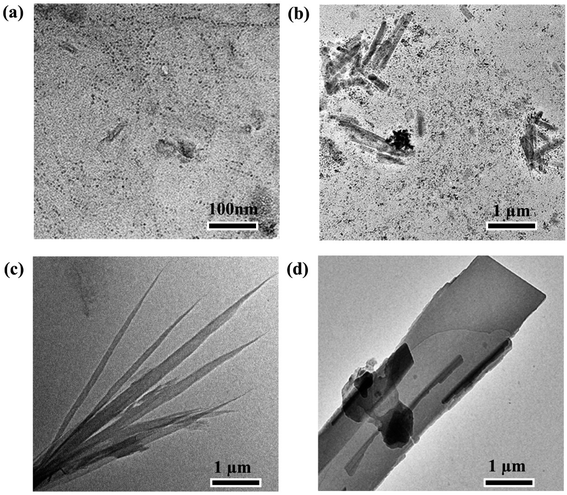
The morphology, crystal structure, and chemical composition of MoS2 nanomaterials depend on the chemical reaction conditions, i.e., reaction time and temperature.Fig. 1 shows TEM images of samples labeled R1, R2, R3, and R4 at different reaction stages (10, 60, 90, and 150 min), which reveal the morphology evolution of MoS2. After 10 min of the reaction, the sample R1 mainly presents quantum-dot-like with an average diameter of around 5 nm (Fig. 1(a)). When the reaction proceeds for 60 min, it can be observed that some rod-like nanoparticles with lengths of 50–100 nm and an average diameter of 8 nm in sample R2 (Fig. 1(b)). As reaction time is prolonged to 90 min, nanoribbons can be obtained with widths of about 60–200 nm, lengths up to 4–8 μm (Fig. 1(c)). When the reaction time is 150 min, it is found some nanoribbons gradually stack to nanosheets (Fig. 1(d)).
High-resolution transmission electron microscopy (HRTEM) was used to study the evolution of phase structure of R1–R4 in detail. Fig. S3(a)† shows the HRTEM image of sample R1, where the lattice spacing of 2.6 Å and 1.6 Å are assigned to the (220) plane of MoO3 and the (110) plane of MoS2, respectively. The HRTEM image of sample R2 shows that the lattice spacings are 2.6 Å and 2.7 Å, assigned to the (220) plane of MoO3 and the (100) plane of MoS2,27 respectively (see Fig. S3(b) in ESI†). This indicates that the two phases of MoS2 and MoO3 may coexist in the samples R1 and R2. Whereas the HRTEM image of the samples R3 and R4 show only clear lattice fringes with a spacing of 2.7 Å corresponding to the (100) plane of MoS2,28 this suggests that there is a pure MoS2 phase in the samples R3 and R4 (see Fig. S3(c) and (d)†).
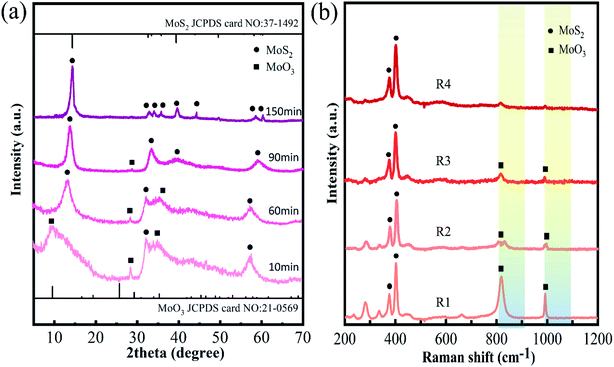
The crystal structure and phases of the products at the different reaction stages were further studied by XRD (see Fig. 2(a)). In the XRD of sample R1, peaks at 9.7°, 29.4°, and 35.4° can be attributed to the (100), (300), and (310) reflections of MoO3 (marked by “■”, JCPDS card No. 21-0569)29 and the 33.0° and 58.3° peaks can belong to the (100) and (110) planes of MoS2 (marked by “●” JCPDS card No. 37-1492).30 This suggests there are two MoO3 and MoS2 phases in sample R1, which is consistent with the results of the HRTEM image analysis. In addition, all the XRD peaks of sample R1 are broad and weak, indicating that sample R1 is amorphous. This is also evidenced by electron diffraction patterns (Fig. S4 in ESI†), which present diffusion rings. When the reaction time is 60 min, a new clear peak at 14.4° appears in the XRD spectrum, corresponding to the (002) reflection of MoS2. Whereas the features of other peaks remain broad, implying that the crystallinity of sample R2 is still weak. When the reaction time is 90 min, peaks at 9.7°, 29.4°, and 35.4° almost disappear in the XRD spectrum, indicating most of the MoO3 phase may be converted into the MoS2 phase. When the reaction time is prolonged to 150 min, the corresponding XRD of sample R4 shows that all peaks are well-matched with 2H–MoS2, and the intensity of these peaks increases further, revealing an enhancement of crystallinity.31
Fig. 2(b) shows the Raman spectra of samples R1, R2, R3, and R4. The 384 cm−1 and 403 cm−1 peaks are respectively attributed to E2g1 and A1g of MoS2, and the bands at 810 cm−1 and 994 cm−1 may be assigned to the Mo–O stretching frequency of MoO3.32 As the reaction process proceeds, the relative intensity of the Mo–O peak gradually weakens, implying that the relative content of MoO3 in molybdenum chalcogenide composites gradually decreases. When reaction time exceeds 90 min, a higher content of the aMoS2 phase can be obtained.
Fig. 3(a) shows the XPS data of sample R3, indicating that Mo and S elements are dominant in the chemical composition. The high-resolution XPS of Mo3d (Fig. 3(b)) with peaks at 232.7 eV and 229.4 eV corresponds to Mo4+ 3d3/2 and Mo4+ 3d5/2, respectively.33 The 236.0 eV and 232.0 eV peaks are attributed to MoVI 3d3/2 and MoVI 3d5/2.34 The two peaks are so weak that they are difficult to identify, suggesting a low content of hexavalent molybdenum in the sample. Fig. 3(c) shows the high-resolution XPS of S2p spectra, where the 163.5 eV and 162.2 eV peaks are attributed to the S2p1/2 and S2p3/2 components of MoS2.35 The 530.9 eV and 532.1 eV peaks of the O1s spectrum (Fig. 3(d)) may be associated with trance lattice oxygen in MoS2 and ambient oxygen, respectively. The two peaks are so weak that they cannot be observed, suggesting that the sample consists mainly of the MoS2 phase and only slightly of the MoO3 phase. This is in accordance with the XRD analysis.
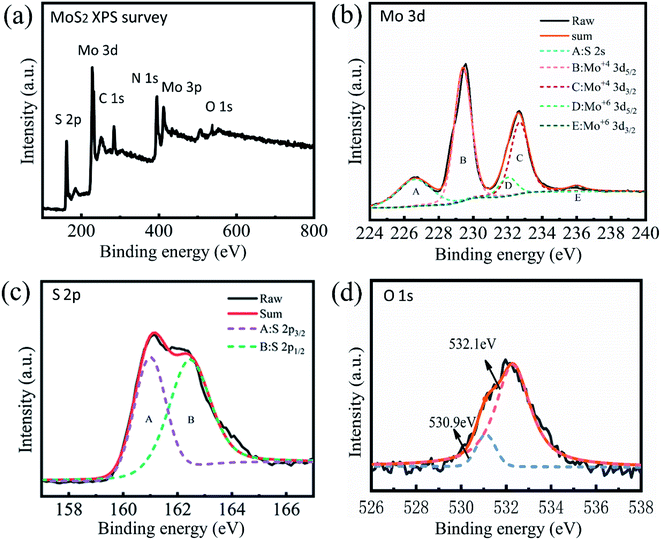 | ||
| Fig. 3 XPS overview spectrum of sample R3 (a) and high-resolution scans of Mo3d (b), S2p (c), and O1s electrons (d). | ||
To further study the formation of the MoS2 nanoparticles, the Fourier transform infrared spectra (FTIR) of MoDTC, samples R1 and R3 were measured as shown in Fig. S5.† After 10 minutes of reaction (sample R1), the stretching vibration (1509 cm−1) of the N![[double bond, length as m-dash]](https://www.rsc.org/images/entities/char_e001.gif) CS2 group, symmetrical and asymmetrical deformation vibrations (1454 and 1269 cm−1) of the C–CH3 group, and stretching vibration of the C–S group (995 cm−1) become noticeably weakened, while the intensity of the (C) C–N group stretching vibrations (1170 cm−1) of MoDTC does not decrease significantly.36 This suggests that partial organic groups of MoDTC can be pyrolyzed. While the reaction time is 90 min (sample R3), the asymmetric, symmetric stretching, and shearing vibrations peaks of the –CH2 group (2959 cm−1, 2837 cm−1, and 1431 cm−1) have also almost disappeared, suggesting that the MoDTC precursor might be nearly exhausted due to the pyrolysis reaction.37
CS2 group, symmetrical and asymmetrical deformation vibrations (1454 and 1269 cm−1) of the C–CH3 group, and stretching vibration of the C–S group (995 cm−1) become noticeably weakened, while the intensity of the (C) C–N group stretching vibrations (1170 cm−1) of MoDTC does not decrease significantly.36 This suggests that partial organic groups of MoDTC can be pyrolyzed. While the reaction time is 90 min (sample R3), the asymmetric, symmetric stretching, and shearing vibrations peaks of the –CH2 group (2959 cm−1, 2837 cm−1, and 1431 cm−1) have also almost disappeared, suggesting that the MoDTC precursor might be nearly exhausted due to the pyrolysis reaction.37
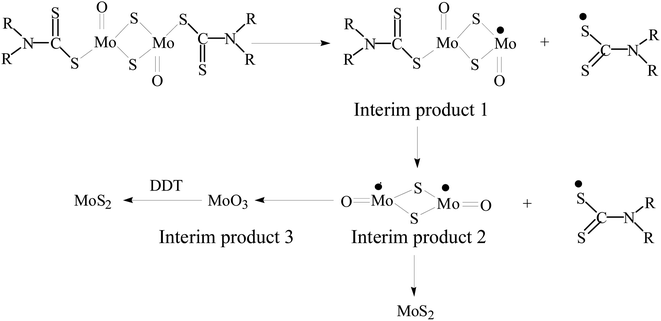
Based on the above results, the possible reaction process is presented in Scheme 1. At the initial stage of the reaction, the decomposition of MoDTC generates MoS2 and MoO3 interim products.38 With the prolongation of reaction time, MoO3 can be further reduced to MoS2 by 1-dodecanethiol (1-DDT) in the reaction system. Because pure 1-DDT gradually releases a few sulfur monomers due to the C–S bond pyrolysis at a higher temperature by previous literature.39 The highly-active sulfur monomers may serve as a reductant and further react with MoO3, thus resulting in the further consumption of content of the MoO3 and the formation of MoS2.40
3.3 Effects of temperature on the shape of MoS2 nanocrystals
The phase structures of the products prepared at different temperatures (160 °C, 190 °C, 220 °C, 250 °C) for 90 minutes were determined by XRD as shown in Fig. S6 of ESI.† At low temperature (160 °C), due to the low crystallinity of the sample, only an observable diffraction peak around 14.4° is identified as the (002) plane of 2H–MoS2. The XRD patterns of samples synthesized 190 °C, 220 °C, and 250 °C exhibit the clear (002), (101), (103), and (110) characteristic peaks of 2H–MoS2, indicating the high crystallinity and content of MoS2.Temperature plays a significant role in the formation of MoS2 nanocrystals with different morphologies. Fig. 4 depicts TEM images of MoS2 synthesized at various temperatures (160 °C, 190 °C, 220 °C, and 250 °C). When the temperature is around 160 °C, MoS2 QDs are obtained (Fig. 4(a)). At the temperature, almost {1![[0 with combining macron]](https://www.rsc.org/images/entities/char_0030_0304.gif) 10} and (0001) planes are covered with 1-DDT ligands, which prevent the deposition and growth of MoS2 monomer on the planes. Every crystal face grows at a very slow rate, which is close to the thermodynamic equilibrium state. In the thermodynamically dominated growth stage, spherical or dot-like MoS2 nanocrystals can be regarded as the first morphology. Because the sphere or dot shape has a low overall surface area, thus forming the crystal with the minimum surface energy.41 With the increase in temperature (up to 190 °C), the desorption rate of ligands from the crystal surface increases gradually. Moreover, the desorption probability of ligands from the (0001) basal plane could exceed that of the {1
10} and (0001) planes are covered with 1-DDT ligands, which prevent the deposition and growth of MoS2 monomer on the planes. Every crystal face grows at a very slow rate, which is close to the thermodynamic equilibrium state. In the thermodynamically dominated growth stage, spherical or dot-like MoS2 nanocrystals can be regarded as the first morphology. Because the sphere or dot shape has a low overall surface area, thus forming the crystal with the minimum surface energy.41 With the increase in temperature (up to 190 °C), the desorption rate of ligands from the crystal surface increases gradually. Moreover, the desorption probability of ligands from the (0001) basal plane could exceed that of the {1![[0 with combining macron]](https://www.rsc.org/images/entities/char_0030_0304.gif) 10} because of the lower surface energy of the (0001) in comparison with the {1
10} because of the lower surface energy of the (0001) in comparison with the {1![[0 with combining macron]](https://www.rsc.org/images/entities/char_0030_0304.gif) 10} plane. Thus, the (0001) facets are more easily exposed than the {1
10} plane. Thus, the (0001) facets are more easily exposed than the {1![[0 with combining macron]](https://www.rsc.org/images/entities/char_0030_0304.gif) 10} plane.42 As a result, MoS2 monomers preferentially deposit on the facet (0001), and the crystal grows along the [0001] axis direction, forming the one-dimensional nanorods and nanobelts (Fig. 4(b) and (c)).43 When the temperature rises to 250 °C, near the boiling point of DDT (about 266 °C), the DDT ligands become extremely dynamic, resembling a quasi-gas phase. The rate of ligand desorption from the crystal surface may be greater than that of adsorption, leading to more exposed crystal facets, including the (0001) and the {1
10} plane.42 As a result, MoS2 monomers preferentially deposit on the facet (0001), and the crystal grows along the [0001] axis direction, forming the one-dimensional nanorods and nanobelts (Fig. 4(b) and (c)).43 When the temperature rises to 250 °C, near the boiling point of DDT (about 266 °C), the DDT ligands become extremely dynamic, resembling a quasi-gas phase. The rate of ligand desorption from the crystal surface may be greater than that of adsorption, leading to more exposed crystal facets, including the (0001) and the {1![[0 with combining macron]](https://www.rsc.org/images/entities/char_0030_0304.gif) 10} planes. This can cause the non-selective and disordered accumulation of MoS2 monomers on the crystal planes and stack into a bulk (Fig. 4(d)).44 Through the single precursor method, not only MoS2 quantum dots but also nanorods and nanobelts are feasible to obtain by the precise adjustment of reaction temperature.
10} planes. This can cause the non-selective and disordered accumulation of MoS2 monomers on the crystal planes and stack into a bulk (Fig. 4(d)).44 Through the single precursor method, not only MoS2 quantum dots but also nanorods and nanobelts are feasible to obtain by the precise adjustment of reaction temperature.
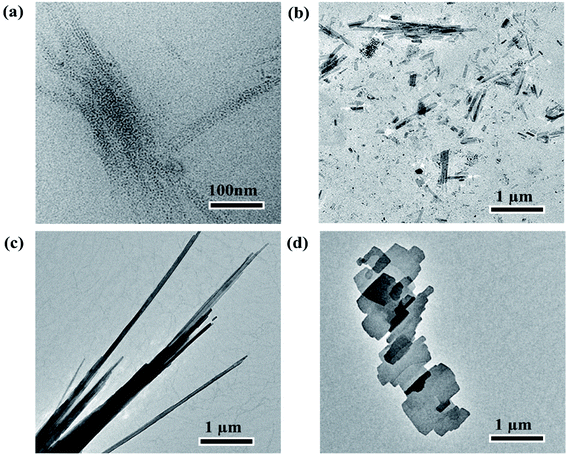 | ||
| Fig. 4 TEM images of samples synthesized at 160 °C (a), 190 °C (b), 220 °C (c) and 250 °C (d) for 90 minutes. | ||
3.4 MoS2 nanocrystal for HER
The HER of MoS2 with different morphologies was investigated by the standard three electrodes in a 0.5 M sulfuric acid solution.As shown in Fig. 5(a), bulk MoS2 exhibits weak HER catalytic performance. In contrast, MoS2 QDs show higher HER catalytic activity with a lower overpotential of 255 mV at 10 mA cm−2 current density, which is lower than that of MoS2 nanorods (267 mV), nanoribbons (288 mV), and nanosheets (312 mV). In addition, the Tafel slope is another important indicator for assessing HER performance, which depicts the kinetics and reaction process of HER. The smaller the Tafel value is, the more complete the electrocatalytic reaction becomes, indicating the catalyst has better catalytic performance. Fig. 5(b) reveals the Tafel slope of the MoS2 QDs is 66 mV dec−1, which is lower than that of MoS2 nanorods (70 mV dec−1), nanoribbons (75 mV dec−1), nanosheets (92 mV dec−1) and bulk MoS2 (138 mV dec−1). To further study the catalytic characteristics, the electrochemical impedance of MoS2 with different morphologies was measured as shown in Fig. 5(c). All samples show a similar Nyquist diagram shape. Among the five electrodes, the EIS Nyquist plot of MoS2 QDs shows the smallest circular radius, suggesting that MoS2 QDs have the highest charge transfer, i.e., excellent electrical conductivity. This could be a significant factor for the higher HER activity of MoS2 QDs.
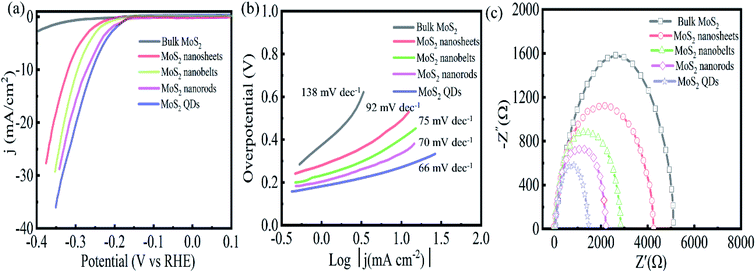 | ||
| Fig. 5 Polarization graphs (a), Tafel plots (b), and Nyquist curves (c) of MoS2 bulk, nanosheets, nanobelts, nanorods, and quantum dots. | ||
4. Conclusions
Summarily, a facile single-precursor strategy has been presented to synthesize MoS2 with various morphologies, including quantum dots, nanorods, and nanoribbons. In-depth studies show that the shape evolution of MoS2 is determined by both kinetic and thermodynamic factors, such as reaction time and temperature. The shape of MoS2 can be finely regulated by the adjustment of the reaction time and temperature. The electrocatalytic properties of the MoS2 samples were tested. Among them, MoS2 QDs exhibit higher electrocatalytic activity in HRE with a small Tafel slope of 66 mV dec−1 and a lower overpotential of 255 mV at 10 mA cm−2 (cathodic current density). Here, the strategy for the synthesis of MoS2 nanocrystals could provide a novel insight for the fabrication of other layered transition-metal sulfides nanomaterials with controllable morphology.Conflicts of interest
The authors declare no competing financial interest.Acknowledgements
This research was supported by the Program of the Higher Education institutions of Anhui Province (KJ2018A0460) and the Foundation for Young Talents at the University of Anhui Province (gxyq2020048).References
- I. Dincer and C. Acar, Int. J. Hydrogen Energy, 2015, 40, 11094–11111 CrossRef CAS
.
- X. Zhang, F. Jia and S. Song, Chem. Eng. J., 2021, 405, 127013–127029 CrossRef CAS
.
- J. Benson, M. Li, S. Wang, P. Wang and P. Papakonstantinou, ACS Appl. Mater. Interfaces, 2015, 7, 14113–14122 CrossRef CAS PubMed
.
- F. Kamatsos, M. Drosou and C. A. Mitsopoulou, Int. J. Hydrogen Energy, 2021, 46, 19705–19716 CrossRef CAS
.
- M. Ju, X. Wang, X. Long and S. Yang, CrystEngComm, 2020, 22, 1531–1540 RSC
.
- B. Hinnemann, P. G. Moses, J. Bonde, K. P. Jørgensen, J. H. Nielsen, S. Horch, I. Chorkendorff and J. K. Nørskov, J. Am. Chem. Soc., 2005, 127, 5308–5309 CrossRef CAS PubMed
.
- Y. Yu, S.-Y. Huang, Y. Li, S. N. Steinmann, W. Yang and L. Cao, Nano Lett., 2014, 14, 553–558 CrossRef CAS PubMed
.
- M. Shao, P. Wang, Y. Wang, B. Wang, Y. Wang and J. Xu, Green Energy Environ., 2021, 6, 858–865 CrossRef
.
- C. Tang, L. Zhong, B. Zhang, H. F. Wang and Q. Zhang, Adv. Mater., 2018, 30, 1705110–1705118 CrossRef PubMed
.
- W. Mengting, T. Yanase, F. Uehara, S. Watanabe, T. Miura, T. Nagahama and T. Shimada, CrystEngComm, 2017, 19, 3915–3920 RSC
.
- J. Kibsgaard, Z. Chen, B. N. Reinecke and T. F. Jaramillo, Nat. Mater., 2012, 11, 963–969 CrossRef CAS PubMed
.
- C. Wang, H. Wang, Z. Lin, W. Li, B. Lin, W. Qiu, Y. Quan, Z. Liu and S. Chen, CrystEngComm, 2019, 21, 1984–1991 RSC
.
- D. Voiry, R. Fullon, J. Yang, D. C. C. E. S. Cecilia, R. Kappera, I. Bozkurt, D. Kaplan, M. J. Lagos, P. E. Batson and G. Gupta, Nat. Mater., 2018, 15, 1003–1009 CrossRef PubMed
.
- X. Ren, L. Pang, Y. Zhang, X. Ren, H. Fan and S. Liu, J. Mater. Chem. A, 2015, 3, 10693–10697 RSC
.
- S. Xu, D. Li and P. Wu, Adv. Funct. Mater., 2015, 25, 1127–1136 CrossRef CAS
.
- D. Gopalakrishnan, D. Damien and M. M. Shaijumon, ACS Nano, 2014, 8, 5297–5303 CrossRef CAS PubMed
.
- M. Shrivastava, R. Kumari, M. R. Parra, P. Pandey, H. Siddiqui and F. Z. Haque, Opt. Mater., 2017, 73, 763–771 CrossRef CAS
.
- N. S. Arul and V. Nithya, RSC Adv., 2016, 6, 65670–65682 RSC
.
- X. Li, X. Lv, N. Li, J. Wu, Y. Z. Zheng and X. Tao, Appl. Catal., B, 2018, 243, 76–85 CrossRef
.
- R. A. Laudise and J. W. Nielsen, Phys. Rev. B: Solid State, 1961, 12, 149–222 CAS
.
- H. J. Zheng, X. C. Li, K. Zong, Y. X. Sun, J. B. Liu, H. Wang and H. Yan, Mater. Lett., 2013, 110, 1–3 CrossRef
.
- J. Akhtar, M. Akhtar, M. A. Malik, P. O'Brien and J. Raftery, J. Am. Chem. Soc., 2012, 134, 2485–2487 CrossRef CAS PubMed
.
- T. Mirkovic, M. A. Hines, P. S. Nair and G. D. Scholes, Chem. Mater., 2005, 17, 3451–3456 CrossRef CAS
.
- T. Wang, J. Li and G. Zhao, Powder Technol., 2014, 253, 347–351 CrossRef CAS
.
- H. Okubo, C. Tadokoro, T. Sumi, N. Tanaka and S. Sasaki, Tribol. Int., 2019, 133, 271–287 CrossRef CAS
.
- Y. Al-Jeboori, S. Kosarieh, A. Morina and A. Neville, Tribol. Int., 2018, 122, 23–37 CrossRef CAS
.
- S. H. Guo, X. H. Li, X. G. Ren, L. Yang, J. M. Zhu and B. Q. Wei, Adv. Funct. Mater., 2018, 28, 1802567–1802579 CrossRef
.
- X. S. Wang, H. B. Feng, Y. M. Wu and L. Y. Jiao, J. Am. Chem. Soc., 2013, 135, 5304–5307 CrossRef CAS PubMed
.
- H. Liu, X. Chen, L. Deng, M. Ding, J. Li and X. He, J. Mater. Chem. A, 2016, 4, 17764–17772 RSC
.
- P. Kumar, M. Singh, R. K. Sharma and G. Reddy, J. Alloys Compd., 2016, 671, 440–445 CrossRef CAS
.
- G. Li, C. Li, H. Tang, K. Cao, J. Chen, F. Wang and Y. Jin, J. Alloys Compd., 2010, 501, 275–281 CrossRef CAS
.
- C. Chang and S. Chan, J. Catal., 1981, 72, 139–148 CrossRef CAS
.
- F. Y. Wu, Y. S. Cheng, D. M. Wang, M. L. Li, W. S. Lu, X. Y. Xu, X. H. Zhou and X. W. Wei, Mater. Sci. Eng., C, 2020, 112, 110898–110906 CrossRef CAS PubMed
.
- C. L. Wu, P. C. Huang, S. Brahma, J. L. Huang and S. C. Wang, Ceram. Int., 2017, 43, S621–S627 CrossRef CAS
.
- L. Chen, L. Zang, L. Chen, J. Wu, C. Jiang and J. Song, CrystEngComm, 2021, 23, 5337–5344 RSC
.
- R. Jowitt and P. Mitchell, J. Chem. Soc. A, 1970, 1702–1708 RSC
.
- S. S. Chou, M. De, J. Kim, S. Byun, C. Dykstra, J. Yu, J. Huang and V. P. Dravid, J. Am. Chem. Soc., 2013, 135, 4584–4587 CrossRef CAS PubMed
.
- N. Hashizume, M. Murashima, N. Umehara, T. Tokoroyama and W. Y. Lee, Tribol. Int., 2021, 162, 107128–107138 CrossRef CAS
.
- M. B. Sigman, A. Ghezelbash, T. Hanrath, A. E. Saunders, F. Lee and B. A. Korgel, J. Am. Chem. Soc., 2003, 125, 16050–16057 CrossRef CAS PubMed
.
- B. Li, S. Yang, N. Huo, Y. Li, J. Yang, R. Li, C. Fan and F. Lu, RSC Adv., 2014, 4, 26407–26412 RSC
.
- L. Liu, Z. Zhuang, T. Xie, Y. G. Wang, J. Li, Q. Peng and Y. Li, J. Am. Chem. Soc., 2009, 131, 16423–16429 CrossRef CAS PubMed
.
- L. F. Fei, S. J. Lei, W. B. Zhang, W. Lu, Z. Y. Lin, C. H. Lam, Y. Chai and Y. Wang, Nat. Commun., 2016, 7, 12206–12213 CrossRef CAS PubMed
.
- X. Shang, W. H. Hu, X. Li, B. Dong, Y. R. Liu, G. Q. Han, Y. M. Chai and C.-G. Liu, Electrochim. Acta, 2017, 224, 25–31 CrossRef CAS
.
- S. Hu and X. Wang, J. Am. Chem. Soc., 2008, 130, 8126–8127 CrossRef CAS PubMed
.
Footnote |
| † Electronic supplementary information (ESI) available. See https://doi.org/10.1039/d2ra02834d |
| This journal is © The Royal Society of Chemistry 2022 |

