DOI:
10.1039/D2RA02970G
(Paper)
RSC Adv., 2022,
12, 20735-20745
Thermal activation significantly improves the organic pollutant removal rate of low-grade manganese ore in a peroxymonosulfate system†
Received
11th May 2022
, Accepted 13th July 2022
First published on 19th July 2022
Abstract
Low-cost, eco-friendly and effective catalysts are essential for activating peroxymonosulfate (PMS) to purify water. Hence, we investigated using thermal activation natural low-grade manganese ore (CNMO) as an effective catalyst to activate PMS for the removal of Acid Orange 7 (AO7), a harmful azo dye. CNMO exhibited a more effective activation ability than either the pure component substances alone or natural manganese ore (NMO), owing to its increased charge transfer, pore size and acidic sites. The activation mechanism of PMS was elucidated, and the degradation of AO7 was noted to have been caused by singlet oxygen (1O2), and increased electron transfer. Moreover, the outstanding degradation of AO7 in actual water indicated that the CNMO/PMS system was highly resistant to surrounding organic and inorganic compounds, and the CNMO exhibited extraordinarily high stability and recyclability. Thus, this study provides not only a new choice of PMS activator that offers low cost, and excellent and stable performance, but also a novel direction for the efficient utilization of low-grade manganese ore.
Introduction
Recently, advanced oxidation processes (AOPs) based on peroxymonosulfate (PMS, HSO5−) have attracted extensive attention due to their fast reaction speed, strong oxidation ability and effectiveness in the removal of organic matter from water. The AOP system based on PMS can produce reactive oxygen species (ROS) such as sulfate radicals (SO4˙−), hydroxyl radicals (˙OH) and even singlet oxygen (1O2).1–3 Among these, 1O2 has a mild oxidation capacity (2.2 V) and strong anti-interference performance in relation to some inorganic anions, and can effectively degrade or transform pollutants.2,4,5 Current PMS activation methods include transition metals, heat, and ultraviolet (UV) and ultrasonic activation.6–9 Due to the higher energy consumption of ultrasonic, UV and heat activation processes, however, transition metal activation, which is also more economical, has become the preferred activation method. Previous studies have shown cobalt to be the most effective transition metal catalyst for PMS activation,10–12 but it is expensive and potentially carcinogenic. Therefore, the development of low-cost, eco-friendly and effective non-cobalt-based catalysts is essential.
Among transition metals, iron and manganese have been extensively investigated and applied due to their low toxicity, low cost and environmental friendliness. However, the catalytic activity levels of mono-metallic iron and manganese are weaker than that of a cobalt-based catalyst. In order to enhance the catalytic activity of iron and manganese, numerous multicomponent recombination catalysts have been synthesized by researchers, such as MnFe2O4,13 Fe2O3/MnO2,2 Fe3O4/MnO2,6,14 β-FeOOH/MnO2,15 and MnFe2O4/δ-MnO2.16 The activation performance of these iron/manganese bimetallic catalysts for PMS have been shown to be significantly enhanced compared to mono-metallic catalysts. However, the synthesis of these catalysts is complicated, costly and not eco-friendly. Moreover, the properties of some catalysts are unstable, which limits their practical application. Solutions to the abovementioned problems are key to the achievement of large-scale industrial applications of iron and manganese bimetallic catalysts.
The study of low-grade manganese ore applications in industrial production is made even more significant by the steady depletion of high-grade manganese ore.17 The utilization of low-grade manganese ore is currently being improved in some countries via beneficiation,18,19 however, the beneficiation process is complicated, requiring the use of many reagents, and the enrichment rate is limited. Therefore, the development of a method to efficiently improve the utilization of low-grade manganese ore is also considered urgent.
Natural manganese ore (NMO) is generally accompanied by iron,1,17 and its properties are stable, making this combination a readily available catalyst for the activation of PMS to degrade organic matter, thereby not only improving the utilization of low-grade manganese ore, but also realizing the simultaneous, double-effect catalysis of iron and manganese bimetals. Therefore, natural low-grade manganese ore is considered a simple, environmentally friendly and low-cost catalyst, which is expected to achieve large-scale applications in the improvement of water pollution.
Herein, we proposed and developed a system of organic matter degradation using thermally activated NMO to activate PMS, which was shown to be highly efficient. The catalyst was systematically characterized and its high activity was analyzed. In addition, the effects of essential experimental parameters in the degradation of the azo dye Acid Orange 7 (AO7) via a catalyst based on the PMS system were discussed, and the pathway and action mechanism of AO7 degradation were examined via the study of both the products and ROS.
Experimental
Chemicals and reagents
Ethyl alcohol (EtOH), tert-butyl alcohol (TBA), dichloromethane (CH2Cl2), nitric acid (HNO3), sodium hydroxide (NaOH), hydrochloric acid (HCl, 37%), sulfuric acid (H2SO4) and methylene blue (MB) were purchased from Chengdu Kelong Chemicals Co., Ltd. Potassium iodide (IK), benzoquinone (BQ), direct turquoise blue (DTB) and malachite green (MG) were obtained from Shanghai Aladdin Bio-Chem Technology Co., Ltd. Metanil Yellow (MY), furfuryl alcohol (FFA), L-histamine (L-his), 5,5-dimethyl-1-pyrroline N-oxide (DMPO) and 2,2,6,6-tetramethyl-4-piperidone (TEMP) were purchased from Shanghai Macklin Biochemical Co., Ltd. Potassium peroxymonosulfate (PMS, KHSO5·0.5KHSO4·0.5K2SO4) and AO7 were obtained from Shanghai Yuanye Bio-Technology Co., Ltd.
Thermal activation of manganese ore catalysts
The NMO, obtained from Gabon, was calcined at a rate of 10 °C min−1 to 200–800 °C for 0.5–3 h under air. The NMO calcined at 500 °C for 0.5 h is denoted herein as CNMO.
Characterization
The NMO loss and the loss rate of the sample at temperature were analyzed using a thermogravimetric analyzer (HS-TGA-101, HESON, CN) at 10 °C min−1 in an air atmosphere. X-ray diffraction (XRD; Rigaku SmartLab) was used in the analysis of the catalysts' crystalline phases. The specific surface areas (SBET) of catalysts were measured at 77 K using a JW-BK122W gas sorption analyzer (Beijing JWGB Sci. & Tech. Co., Ltd). Field emission scanning electron microscopy (SEM; Inspect F50, FEI Company) was employed to estimate the morphology of the catalysts. Fourier transform infrared spectroscopy (FTIR; PerkinElmer Frontier) was used to examine the surface properties of samples with a scanning range of 4000–400 cm−1. NH3-temperature programmed desorption (NH3-TPD) and CO2-temperature programmed reduction (CO2-TPD) experiments were measured using a dynamic sorption analyzer (TP-5080, Xianquan Industrial and Trading Co., Ltd). Tafel scans were obtained using an electrochemical workstation (CHI 660E, CH Instruments Inc). X-ray photoelectron spectroscopy (XPS) was used to analyze the elemental composition of the catalysts' surface (Axis Ultra DLD, Kratos Analytical Ltd). The electron spin resonance (ESR) spectra of ROS were detected using an ESR spectrometer (EMXplus, Bruker).
Experiment procedure
Stock solutions (1 g L−1) of AO7 were prepared and then diluted to 100–20 mg L−1. Batch experiments were conducted in a thermostatic oscillator at 25 °C, with 0.1 M H2SO4 and 0.1 M NaOH used to adjust the initial pH of the solution. A specified dose of catalyst (0.5–2.5 g L−1) was then added to the target AO7 solution, after which physical adsorption was conducted via continuous shaking (200 rpm) for 60 min to achieve a dynamic equilibrium of AO7 on the catalyst surface. Immediately thereafter, the optimal amount of PMS (0.08–0.46 mM) was added to the reaction system. At 5 min intervals, 4 mL samples were removed from the solution, filtered through a PTFE syringe filter disc (0.22 μm), and then measured immediately using a UV spectrophotometer (λ = 484 nm, UV-2400).
Analytical method
The intermediates of AO7 were identified during the treatment process using a gas chromatograph mass spectrometer (GCMS-QP2020NX, Shimadzu) equipped with a DB-5MS (30 m × 0.25 mm, 0.25 μm) chromatographic column. The GC was run at 40 °C for 2 min in the programming mode of the initial set temperature. Thereafter, the temperature was increased to 100 °C (15 °C min−1), then increased to 200 °C (5 °C min−1), at which it was maintained for 2 min before being finally increased to 280 °C (20 °C min−1) for 10 min.
The degradation of AO7 followed pseudo-first-order kinetics. The kinetic rate constants (kobs, min−1) of the AO7 degradation were further analyzed, using the following kinetics equation:20
| |
 | (1) |
where
t is the reaction time (min), and
Ct and
C0 are the concentrations of AO7 at
t time and in the solution after 60 min physical adsorption treatment (mg L
−1), respectively.
The degradation activation energy (Ea) of AO7 in the system was calculated using the Arrhenius equation (eqn (2)):21
| |
 | (2) |
where
A is the prefactor, and
R is the universal gas constant (8.314 J mol
−1 K
−1).
Residual PMS was determined by iodimetry, in which 0.50 mL of the reacted AO7 solution was added to 4.00 mL KI (0.5 mM) solution and shaken well for 30 minutes to ensure a complete reaction (eqn (3) and (4)).22,23 Finally, the absorption value of the reaction solution was measured at λmax = 352 nm.
| | |
2I− + HSO5− + 2H+ → HSO4− + I2 + H2O
| (3) |
Density functional theory (DFT) calculation
All calculations were performed using the Vienna Ab initio Simulation Package (VASP Software GmbH), based on density functional theory (DFT).24–26 The Perdew–Burke–Ernzerhof (PBE) with generalized gradient approximation (GGA) was implemented for the electron exchange–correlation interactions.27 The cut-off energy of plane waves was set at 450 eV within the framework of the projector-augmented wave (PAW) method. The Brillouin zone was sampled with 3 × 3 × 1 k-points mesh via the Monkhorst–Pack method. The accuracy of geometry optimization convergence was 0.05 eV Å−1 and 1 × 10⁻⁵ eV. The vacuum layer was set as 15 Å. The spin polarized DFT with Hubbard U method (DFT + U) was employed to correct the strong on-site Coulomb repulsion among the localized 3d electrons of the Fe and Mn ([U − J]Fe = 4.0 eV, [U − J]Mn = 5.5 eV).28–30
The adsorption energies (Eads) of PMS on Fe3O4 and δ-MnO2 surfaces were calculated using the following formula:
| | |
Eads = Etotal − (Ecata + EPMS)
| (5) |
where
Etotal,
Ecata and
EPMS represent the total energy of the catalyst with the adsorbed PMS, the catalyst and isolated PMS molecule, respectively.
Results and discussion
Optimization of calcination temperature
Thermogravimetric analysis (TGA) was performed on the NMO to clarify the weight loss and loss speed of NMO with temperature in an air atmosphere (Fig. 1(a)). The first weight loss stage in the range of 50–100 °C was small, corresponding to the evaporation of adsorbed H2O on the surface of the NMO. The second weight loss stage started at 200 °C and ended at 300 °C, with the largest derivative thermogravimetric (DTG) peak at 240 °C, which could be attributed to the loss of interlayer water. The third stage, at 400–500 °C, was assigned to the removal of the structural hydroxyl.31 Weight loss at temperatures of 500–800 °C corresponded to the thermal decomposition of MnO2, which occurs when temperatures increase, as ascertained via eqn (6) (ref. 32 and 33) as follows:| |
 | (6) |
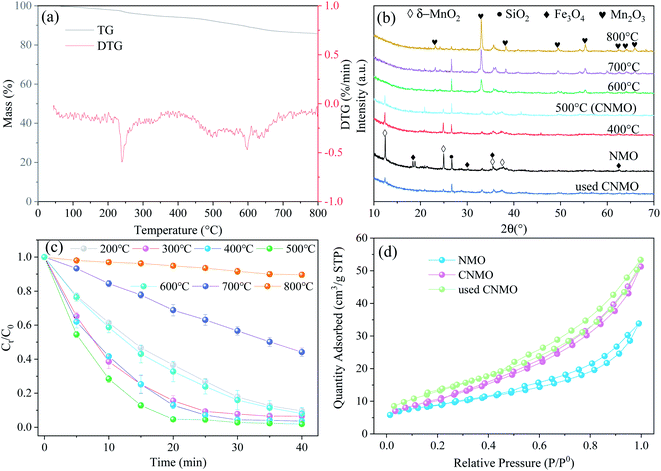 |
| | Fig. 1 (a) TG and DTG curves for NMO; (b) XRD patterns of NMO activated at different temperatures and using CNMO; (c) effect of catalyst calcination temperature on AO7 removal efficiency (conditions: C0 = 20 mg L−1, MCNMO = 0.9 g L−1, MPMS = 0.15 mM, pH = 6.6, T = 25 °C); and (d) N2 adsorption–desorption isotherms of NMO, CNMO and used CNMO. | |
To further study the effect of thermal activation temperature on the crystal structure of NMO, XRD was utilized to characterize the NMO calcined at different temperatures, the results of which are shown in Fig. 1(b). The crystal composition of NMO is comprised mainly of δ-MnO2 (JCPDS no. 80-1098), SiO2 (JCPDS no. 46-1045) and Fe3O4 (JCPDS no. 89-0688). In this study, with the increase of thermal activation temperature, the diffraction peaks of δ-MnO2 were found to weaken gradually. When the temperature reached 600 °C, the characteristic peaks of δ-MnO2 disappeared and new diffraction peaks were detected at 23.13°, 32.95°, 38.23°, 49.35°, 55.19° and 65.81°, all belonging to Mn2O3 (JCPDS no. 41-1442), while the characteristic peaks increased significantly with the increased temperature. At this stage, the δ-MnO2 decomposed (eqn (6)) and was converted to Mn2O3, thus validating the TG analysis.
The effects of the catalyst thermal activation temperature on PMS activation were subsequently investigated through the degradation of AO7. As observed in Fig. 1(c), the AO7 removal efficiency increased when thermal activation temperatures were in the range of 200–500 °C. At 500 °C, AO7 removal efficiency and kobs attained the maximum values of 98.11% and 0.1227 min−1 (Fig. S1(a)†) in 40 min, respectively. This may have been due to the temperature at that stage, which triggered the activities of the manganese dioxide or ferric oxide. However, when the thermal activation temperature rose higher than 500 °C, the AO7 removal efficiency began to decrease accordingly. This could be attributed to the reduction of catalytic activity due to the gradual disappearance of δ-MnO2, or to the amorphous state SiO2 evolved from the crystal structure at high temperature, which may cover some of the active components. Furthermore, the effect of thermal activation time on PMS catalytic activation were also examined, with the results indicating that thermal activation time exerted no significant difference (Fig. S1(b)†).
Characteristics of CNMO
Morphology and structure. The morphologies of NMO (Fig. S2(a–d)†), CNMO and used CNMO were observed via SEM (Fig. 2(a–d)). The NMO and CNMO displayed equally polymerized δ-MnO2 lamellar structures, however, it was found that the structure of CNMO after thermal activation was comparatively looser than that of NMO. This was attributed to the conversion of δ-MnO2 in the NMO into Mn2O3 and the subsequent release of O2, which resulted in porosity. Element mapping of CNMO (Fig. 2(e)) revealed that CNMO surface elements were evenly distributed and its manganese content was 24%, the highest metal component, while the content of iron was approximately 12%. Moreover, the morphology of the CNMO after the catalytic reaction was not obviously changed, indicating that the structure of CNMO is stable.
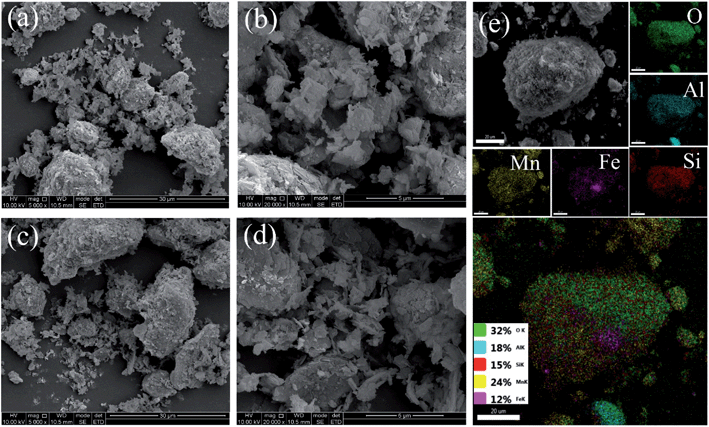 |
| | Fig. 2 (a and b) SEM images for CNMO; (c and d) used CNMO; and (e) element mapping of CNMO. | |
The SBET and total pores volume (Vtot) of the CNMO increased to 6.08 m2 g−1 and 0.027 cm3 g−1 (Table 1), respectively, after thermal activation due to the release of O2 by the NMO. This is beneficial because the AO7 will more easily enter the CNMO pore and enables full contact with the surface active site. At the thermal activation temperature of 500 °C, the SBET reached its maximum (Fig. S2(e) and Table S1†). The N2 adsorption–desorption isotherm of the used CNMO after catalytic reaction was similar to that of the CNMO, indicating that the catalytic reaction exerted little effect on pore size or structure.
Table 1 Textural properties of NMO and used CNMOa
| Samples |
SBET m2 g−1 |
Vtot cm3 g−1 |
Dp nm |
| SBET: BET surface area; Vtot: total pores volume; Dp: average pore size. |
| NMO |
31.04 |
0.052 |
6.646 |
| CNMO |
37.12 |
0.079 |
7.962 |
| Used CNMO |
45.48 |
0.082 |
6.868 |
FTIR of CNMO. The surface characteristics of the catalysts were examined via FTIR, the results of which are presented in Fig. 3(a).
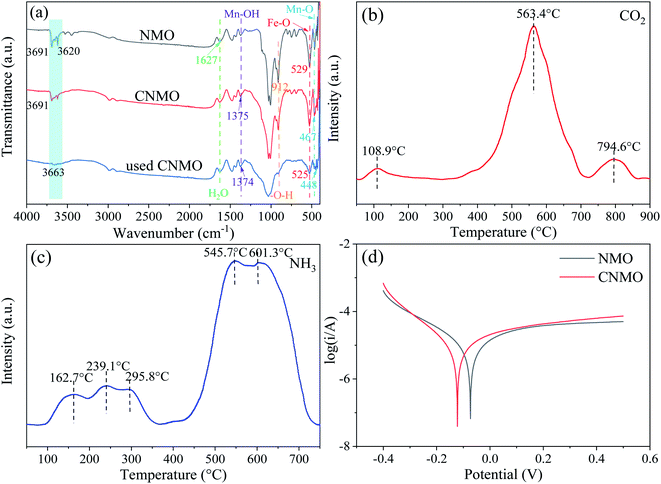 |
| | Fig. 3 (a) FTIR spectra of NMO, CNMO and used CNMO; (b) CO2-TPD, (c) NH3-TPD and (d) Tafel polarization profiles of CNMO. | |
The absorption peak of the FTIR spectra between 3700 cm−1 and 3200 cm−1 were assigned to the stretching vibration of O–H, attributed to inner surface hydroxyl groups.34–36 The band at 1627 cm−1 arose from the bending vibrations of H2O,36 the bands around 465–467 cm−1 were ascribed to Mn–O stretching vibration,36,37 while the peaks at 1373–1375 cm−1 were attributed to the bending vibrations of hydroxyl groups attached with the Mn atoms (Mn–OH),38,39 which is consistent with the peaks of pure δ-MnO2 (Fig. S3†). After the catalytic reaction, the peak of CNMO at 467 cm−1 migrated to 448 cm−1, indicating the involvement of Mn–O. The characteristic absorption band of pure Fe3O4 (Fig. S3†) at 530 cm−1 was assigned to Fe–O bending vibrations,40–42 while the band at 907 cm−1 was due to the O–H stretching vibrations.36,43 Both bands were observed in both the NMO and the CNMO, while the band of the used CNMO, at around 530 cm−1, shifted to 525 cm−1 and both the bands in the used CNMO became significantly weaker, indicating that both Fe–O and O–H had participated in the reaction.
Temperature programmed desorption (TPD) of CNMO. CO2-TPD and NH3-TPD were performed to further investigate the surface acidity and alkalinity of the CNMO. The CO2-TPD (Fig. 3(b)) showed three desorption peaks appearing at 108.9 °C, 563.4 °C and 794.6 °C, indicating three types of basic sites on the surface of CNMO, namely weak basic sites (100–250 °C), medium basic sites (250–470 °C) and strong basic sites (>470 °C).44 Of these, the desorption peak at 563.4 °C was found to be the strongest, indicating that the surface of the CNMO was peaks at 162.7–239.1 °C, 295.8 °C and 545.7–601.3 °C (Fig. 3(c)) corresponded to the weak acidic, medium acidic and strong acidic sites on the surface, respectively. The desorption peak signal was strongest at the strong acidic sites, and its peak area was significantly larger than that of the CNMO at 563.4 °C during CO2-TPD. In addition, the proportion of strong acidic sites was significantly higher than that of strong basic sites. Compared with the NH3-TPD of CNMO (Fig. 3(c)) and NMO (Fig. S4(b)†), the weak/medium/strong acid content increased, with the total acid amounts increasing by 0.074 mmol g−1 (Table S2†). It has been previously reported that acidic sites have electrophilic properties and can bind easily with nucleophilic substances such as HSO5−, thereby providing better adsorption and activation sites for PMS.45 In this study, the acid content on the surface of the CNMO was significantly higher than both its basic content and that of the NMO, making it conducive to the decomposition of PMS.
Tafel profiles of CNMO. The free corrosion potential of NMO and CNMO were investigated via Tafel polarization profiles to characterize their electron transfer activity, which exerts a considerable influence on the activation of PMS. As shown in Fig. 3(d), the corrosion potential of the CNMO increased from −0.073 V to −0.122 V after calcination, suggesting that the electron transfer rate of CNMO was more effectively enhanced than that of the NMO.23,46
XPS of CNMO. XPS wide-scan spectra of the CNMO and the used CNMO (Fig. 4(a)) showed that CNMO consists mainly of O, Mn, Fe, Si and Al. Significant peaks of these elements could still be detected in the used CNMO, indicating that the loss of these elements during the catalytic process was very small. To better understand the state changes of the elements (especially Fe and Mn) in CNMO both before and after the reaction, high-resolution XPS scanning of these two specific elements was performed. As presented in Fig. 4(b), the Mn 2p3/2 spectra peaks located at 641.1 eV, 642.6 eV and 644.5 eV corresponded to Mn2+, Mn3+ and Mn4+, respectively.47 After the catalytic reaction, Mn4+ content increased 15.40%, while Mn2+ and Mn3+ decreased by 1.52% and 13.89%, respectively. The Fe 2p spectra (Fig. 4(c)) show peaks located at 710.9 eV and 712.6 eV, attributed to Fe 2+ and Fe3+, respectively.48–50 After catalyzation, 2.78% of Fe3+ was converted to Fe2+. The above changes in the Mn and Fe species on the CNMO surface indicate the involvement of Mn2+/Mn3+/Mn4+ and Fe2+/Fe3+ in the redox cycle of the PMS activation process.
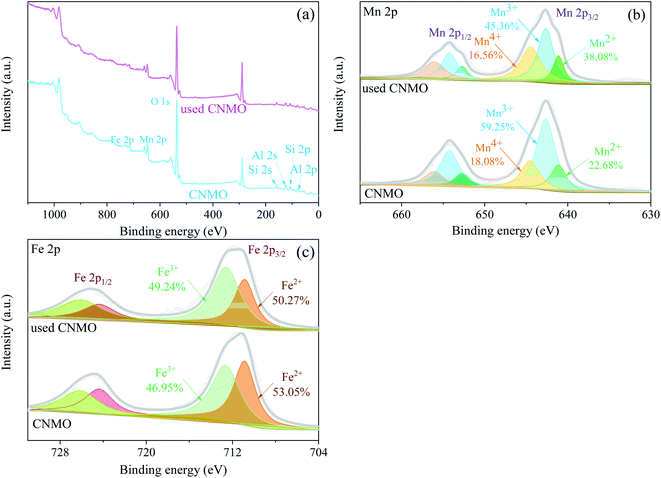 |
| | Fig. 4 (a) XPS wide-scan spectra of the CNMO and the used CNMO; high-resolution XPS spectra and fitting peaks of (b) Mn 2p and (c) Fe 2p. | |
Control experiments
To further demonstrate the excellent activation ability of the CNMO on PMS and to explore its activation mechanism, a series of control experiments were conducted using NMO, Mn2O3 and the pure substances contained in CNMO. As illustrated in Fig. 5(a and b) and S5,† the rate of AO7 removal by CNMO/PMS (98.11%) was significantly higher than that by NMO/PMS (78.27%). Moreover, the PMS residues in the CNMO/PMS system were obviously lower than those in the NMO/PMS system, indicating that the activation ability of CNMO after calcining to PMS was significantly improved. These changes are not only dependent on the increased pore volume (or specific surface area) of CNMO, but also on the enhanced surface acid content and electron transfer rate. XRD analysis showed that the CNMO contained mainly δ-MnO2, SiO2 and Fe3O4. Hence, the corresponding pure substances were used to activate PMS and degrade AO7. The results showed that δ-MnO2 had a strong activation effect on the PMS, while Fe3O4, and SiO2 had no active effect on the PMS, suggesting that δ-MnO2 and Fe3O4 were the main active components in the CNMO. Interestingly, as shown in Fig. 5(b), the activation effect of δ-MnO2 on PMS was stronger than that of CNMO. However, the removal rate of AO7 by CNMO/PMS (98.11%) was much higher (2.28 times) than that of the δ-MnO2/PMS (34.28%). This may be due to the charge transfer between Fe and Mn in CNMO, which facilitated the generation of other effective ROS.
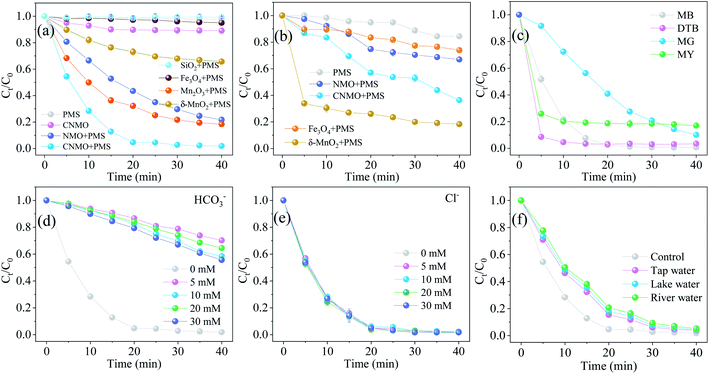 |
| | Fig. 5 Degradation of (a) AO7 and (b) PMS residues in various systems; (c) degradation of different pollutants in the CNMO/PMS system; the influence of (d) inorganic anions HCO3− and (e) Cl− on the degradation of AO7 in the CNMO/PMS system; (f) AO7 removal in actual water (conditions: C0 = 20 mg L−1, MCNMO = 0.9 g L−1, MPMS = 0.15 mM, pH = 6.6, T = 25 °C). | |
Practical application
The degradation of different contaminants in the CNMO/PMS system was also explored in this work, and the results are shown in Fig. 5(c). In addition to AO7 (C.I. 15510, azo dye), CNMO/PMS was also shown to effectively eliminate other azo dyes, including MB (C.I. 52015), DTB (C.I. 24400), MG (C.I. 42000) and MY (C.I. 13065). The rate of DTB degradation reached 91.37% at 5 minutes, and almost all of the MB could be removed in 40 minutes. These results indicate the excellent degradation performance of the CNMO/PMS system on azo dye contaminants.
As shown in Fig. S6,† the pHzpc of the CNMO was 9.28, indicating that the CNMO surface was positively charged at pH < 9.28 and negatively charged at pH > 9.28. The dissociation coefficient of the AO7 was pKa = 10.68,51 indicating that AO7 dissociates and has a negative charge at pH > 10.68. Consequently, the negatively charged catalyst was not able to effectively adsorb the dissociated AO7 at pH > 10.68 due to electrostatic repulsion. This is also the reason why the AO7 adsorption capacity on the CNMO surface decreases under strong alkaline conditions (Fig. S7†).
Since the presence of various inorganic anions in water could affect the degradation of AO7, it was necessary to study the effects of typical inorganic anions (HCO3− and Cl−) on AO7 degradation (Fig. 5(d and e)). The catalytic activity of CNMO was seen to decline significantly in the presence of 5–30 mM of HCO3−. According to the Arrhenius equation, during the degradation process, CO3− could react with free radicals (˙OH and SO4˙−) to generate HCO3˙ and CO3˙−, which are weaker oxidants than ˙OH and SO4˙−.52 In addition, the HCO3− reacted with HSO5− (eqn (7))53,54 and partly consumed it. The reaction rates remained almost unchanged in the presence of Cl−, indicating that 5–30 mM of Cl− had a negligible inhibitory effect.
| | |
HSO5− + HCO3− → HSO4− + HCO4−
| (7) |
Furthermore, AO7 degradation in actual water (tap water, lake water and river water) was explored. The tap water and lake water were collected from Xihua University, Chengdu, China, while river water was drawn from the Tuojiang River in Chengdu, which is the Sichuan branch of the upper reaches of the Yangtze River. As shown in Fig. 5(f) and S7(e),† the kobs of AO7 in the three kinds of background waters all decreased, but the removal rate could still reach more than 94% after 40 minutes of reaction. AO7 was found to degrade most rapidly in tap water, but more slowly in lake and river water, due to the relatively high total organic carbon (TOC, Table S3†) in river and lake water. This suggests the existence of greater quantities of organic matter, which would compete with AO7 for ROS and reduce the rate of AO7 removal. Overall, this effect was found to have only a negligible effect on the complete removal of AO7, showing the good practical application prospect of the CNMO/PMS system.
Catalyst stability
In practical application, the stability and recyclability of a catalyst must be considered. The XRD pattern (Fig. 1(b)) showed that the same typical diffraction peaks as CNMO could still be observed on the used CNMO, indicating that its crystal structure was stable. SEM, BET and FTIR results also confirmed the stability of CNMO, with the change in the CNMO skeleton structure after catalytic reaction almost negligible.
The catalytic activity evolution of CNMO was detected via a continuous recycling operation. As shown in Fig. 6(b) and S8(a)†, the removal rate and kobs value of AO7 by CNMO gradually decreased with the increase in recycling times, however, the removal rate was still 89.5% after four cycles. Mn and Fe leaching concentrations in each recycling process were detected (Fig. S9†), and the results showed only a small amount of manganese leaching (<0.25 mg L−1) and almost no iron leaching. The leaching of a small number of active metals may have been the main reason for the reduction of CNMO catalytic rate. In general, the CNMO exhibited strong stability.
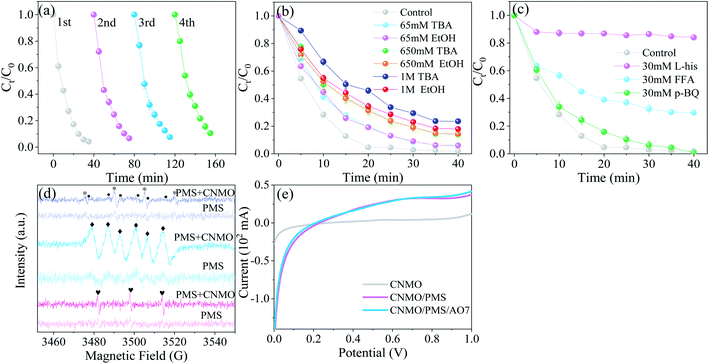 |
| | Fig. 6 (a) Consecutive runs to probe the evolution of catalytic activity for the CNMO; (b and c) degradation efficiency of AO7 in the CNMO/PMS system under different quenching conditions; (d) EPR spectra of various catalytic processes using DMPO (* DMPO–OH, • DMPO–SO4−, ◆ DMPO–O2−) and TEMP ( TEMP–1O2) as the trapping agents; (e) LSV curves of different systems (conditions: C0 = 100 mg L−1, MCNMO = 1.5 g L−1, MPMS = 0.31 mM, pH = 6.6, T = 25 °C). TEMP–1O2) as the trapping agents; (e) LSV curves of different systems (conditions: C0 = 100 mg L−1, MCNMO = 1.5 g L−1, MPMS = 0.31 mM, pH = 6.6, T = 25 °C). | |
CNMP mechanism discussion
Discussion of DFT calculations. To gain further insight into the catalytic mechanism of the CNMO/PMS system, the main catalytic components δ-MnO2 and Fe3O4 in the CNMO were selected for DFT calculation. When PMS was adsorbed on the catalyst surface, different orientations and adsorption sites may have generated various products and energy transduction. Hence, various adsorption possibilities were calculated and considered, with the adsorption model with a relatively stable structure and lowest adsorption energy selected for analysis (Fig. 7). The optimal adsorption model of PMS + δ-MnO2 was denoted as PMO, while PMS + Fe3O4 was denoted as PFO. According to the calculation results, the value of ΔEads between crystal δ-MnO2 (0 0 1) and PMS (−0.232 eV), Fe3O4 (1 1 1) and PMS (−9.491 eV) was negative, indicating that the adsorption process was a stable exothermic chemical process.55
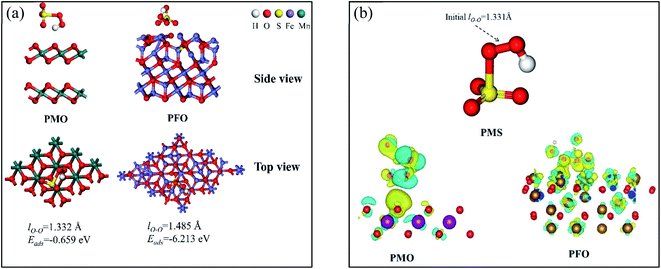 |
| | Fig. 7 (a) A series of results for DFT calculations, including adsorption models (top view, side view) and adsorption energy (Eads); (b) the charge difference distribution (CDD) of different PMS adsorption models blue region represents charge consumption and yellow region represents charge accumulation. | |
The obtained charge difference distribution (CDD) further confirmed the electron transfer between catalyst and PMS. The PMS and catalyst surface atoms in PMO and PFO were wrapped in blue and yellow electron clouds, indicating that charge transfer had occurred between the catalyst and PMS. This was also observed in the O surface of the δ-MnO2 in the PMO, in which it was found that the O atom close to the PMS was covered with yellow electron clouds, indicating that the O atom had obtained electrons. Elsewhere on the surface of δ-MnO2, more O and Mn atoms covered in blue electron clouds were observed, indicating the consumption of electrons. In addition, there were more blue and yellow electron clouds on the surface of the O and Fe atoms near the PMS on the surface of Fe3O4, indicating more charge transfers.
Based on the above DFT calculations and analysis results, it was evident that there were charge transfers between the main components of CNMO (δ-MnO2 and Fe3O4) and the PMS.
Radical scavenging. Radical quenching experiments were conducted to clarify the reactive mechanism in the CNMO/PMS system. EtOH was used as an effective quenching agent for both ˙OH (1.2–2.8 × 10⁹ mol−1 s−1) and SO4˙− (1.6–7.7 × 10⁷ mol−1 s−1),52 while TBA was considered to be the scavenger of ˙OH only, due to significant differences in the reaction rates with ˙OH (k (TBA, ˙OH) = (3.8–7.6) × 108 M−1 s−1) and SO4˙− (k (TBA, SO4˙−) = (4.0–9.1) × 105 M−1 s−1).23,56 As shown in Fig. 6(b), the EtOH and TBA in which the concentration was under 1 M exerted similar effects on AO7 degradation with CNMO as the PMS-activation catalyst.While the EtOH and TBA inhibitory effect on AO7 degradation with the increase of quencher concentration became more obvious, the overall inhibitory effect was small, suggesting that ˙OH and SO4˙− play a certain role in the catalytic process, but are not the main factors involved therein. In addition, the TBA inhibitory effect was more significant than EtOH at the concentration of 1 M, thus excluding the direct effect of SO4˙− on the AO7 removal process.
The BQ were selected to detect the existence of O2˙− (k2 (BQ, O2˙−) = 0.9–1.0 × 10⁹ M−1 s−1), while L-His and FFA were selected as scavengers for 1O2 ((k2 (FFA, 1O2) = 1.2 × 10⁸ M−1 s−1), (k2 (L-his, 1O2) = 3.2 × 10⁷ M−1 s−1)).57–59 Fig. 6(c) shows that L-his and FFA could significantly inhibit AO7 degradation, especially L-his, in which the inhibition rate reached 82.1%. These results indicate that 1O2 was the main reactive species in the AO7 degradation. The BQ inhibition on AO7 degradation was not obvious, suggesting either that the effect of O2˙− was negligible, or that BQ activated PMS and accelerated its decomposition, resulting in the production of the main reactive species 1O2.60
ESR experiments were conducted to further confirm the exist of ROS in the catalytic system. As shown in Fig. 6(d), the signals of DMPO–OH, DMPO–SO4−, DMPO–O2− and TEMP–1O2 were detected in the CNMO/PMS system, however, the signals in the PMS-only system were not clear. In other words, the ROS produced by PMS self-decomposition was far less than that of the PMS activated with the CNMO, suggesting that CNMO is a key factor in promoting the ROS generation of PMS. By comparison, it was found that the signal intensity of DMPO-SO4− was extremely faint, indicating that the existing quantity of SO4˙− in the CNMO/PMS system was very small, which may be attributed to the transformation of SO4˙− into other substances (eqn (8)–(11)).61 This also shows that SO4˙− is not the reactive species to decompose AO7, which is consistent with the results presented in Fig. 6(b). The DMPO–OH, DMPO–O2− and, particularly, TEMP–1O2 showed high signal intensity. According to previous studies, O2˙− can be converted to 1O2 (eqn (15)–(17)),2,15,23 which could improve the rate of AO7 degradation.
The results of the quenching experiments and EPR showed that 1O2 was the main reactive species for AO7 degradation in the CNMO/PMS system, followed by ˙OH.
| | |
[CNMO]0 + HSO5− → [CNMO]I + OH− + SO4˙−
| (8) |
| | |
[CNMO]0 + HSO5− → [CNMO]I + ˙OH + SO42−
| (9) |
| | |
SO4˙− + H2O → H+ + ˙OH + SO42−
| (10) |
| | |
SO4˙− + HSO5− → HSO4− + SO5˙−
| (11) |
| | |
H2O2 + ˙OH → H2O + HO2˙
| (13) |
| | |
O2˙− + ˙OH → 1O2 + OH−
| (15) |
| | |
O2˙− + 2H2O → 1O2 + H2O2 +2OH−
| (16) |
| | |
2O2˙− + 2H+ → 1O2 + H2O2
| (17) |
Catalytic mechanism. Further to the abovementioned findings, it was proposed that the degradation mechanism of AO7 in CNMO/PMS system is related to 1O2 and electron transfer. The low valence metals reacted with PMS to produce high valence metals to form SO4˙− (eqn (18)), and the high valence metals could also activate PMS to produce low valence metals and SO5˙− (eqn (19)).1 The electron transfer between CNMO and PMS in this process was also verified via the DFT study. Thus, low and high valence metals were activated by PMS and converted to each other to form a cyclic system. The SO4˙− could be converted into ˙OH and SO5˙− through the reactions of eqn (10) and (11), thus increasing the content of ˙OH and SO5˙− in the system. Simultaneously, ˙OH and SO5˙− could generate 1O2 (eqn (20) and (21)),11,58 which is the main active species for AO7 degradation, via the quenching experiment and EPR verification.It can be seen from the above analysis that the rate of AO7 degradation is dependent on the cycle efficiency of Mn ↔ Mn+1. Therefore, electron transfer is the key factor affecting 1O2 generation and AO7 degradation. In fact, electron transfer also occurs between different valence states of iron and manganese (eqn (22) and (23)),1,6,21,62 as confirmed by the linear sweep voltammetry (LSV) results presented in Fig. 6(e). Current change was detected in the system in which only CNMO was present. Moreover, the current intensity of the CNMO/PMS system was significantly increased after the addition of PMS in comparison to the pure CNMO, thus demonstrating the electron transfer between PMS and CNMO. When AO7 was introduced into the CNMO/PMS system, the current further increased, implying a rapid transfer of electrons in the CNMO/PMS/BPA system.
Thus, a nonradical catalytic mechanism for the oxidative degradation of AO7 in the CNMO/PMS system is inferred, as shown in Scheme 1. The PMS adsorbed on the surface of the CNMO and was activated by the transition metal, the AO7 molecules as the electron donor and the activated PMS as the electron acceptor, and a direct oxidation–reduction reaction took place under the action of CNMO to realize the degradation of AO7. The results show that CNMO has excellent catalytic performance and could, therefore, serve as an electron medium to promote the electron transfer of AO7 to PMS, thereby achieving the oxidation–reduction reaction of AO7.
| | |
Mn + HSO5− → Mn+1 + OH− + SO4˙−
| (18) |
| | |
Mn+1 + HSO5− → Mn + H+ + SO5˙−
| (19) |
| | |
2SO5˙− + H2O → 2HSO4− + 1/21O2
| (21) |
| | |
Fe2+ + Mn3+ → Fe3+ + Mn2+
| (22) |
| | |
2Fe2+ + Mn4+ → 2Fe3+ + Mn2+
| (23) |
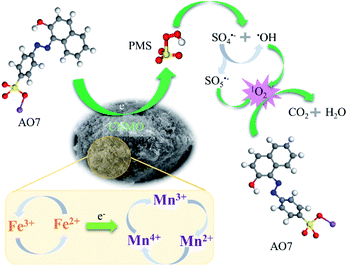 |
| | Scheme 1 Schematic illustration of PMS activation mechanism for AO7 degradation in CNMO/PMS system. | |
Conclusions
This study demonstrated that the AO7 removal rate of CNMO based on the PMS system was significantly improved by thermal activation, which increased the pore size, acid site and electron transfer rate of CNMO. It was proposed that 1O2 is the main reaction species for AO7 degradation in the CNMO/PMS system. The activation of PMS was achieved through electron transfer from AO7 and CNMO to surface-adsorbed PMS. The excellent stability, recyclability and adaptability of the CNMO suggest that CNMO/PMS could be a promising system for practical application. Furthermore, the strategy of converting iron-bearing manganese ore into an efficient catalyst through this straightforward process shows great potential for the simplification of technology preparation, while also mitigating environmental pollution.
Author contributions
Yi Chen: writing-original draft, resources, methodology, funding acquisition. Ping Yin: investigation, methodology. Shuai Dong: validation. Shiyue Wei: validation. Jinchuan Gu: resources, methodology, supervision. Wanglai Cen: resources, methodology.
Conflicts of interest
There are no conflicts to declare.
Acknowledgements
The authors acknowledge the funding support from Talent Introduction Program of Xihua University (Z202117). The authors would like to thank Shiyanjia Lab (https://www.shiyanjia.com) for the ESR analysis.
References
- X. Wang, Y. Xie, K. Chen, L. Yi, Y. Wang and Y. Zhang, Chem. Eng. J., 2022, 427, 130804 CrossRef CAS.
- J. Wang, T. Xie, G. Han, Q. Zhu, Y. Wang, Y. Peng, S. Liu and Z. Yao, Appl. Surf. Sci., 2021, 560, 149984 CrossRef CAS.
- Z. Yang, Z. Wang, G. Liang, X. Zhang and X. Xie, Chem. Eng. J., 2021, 426, 131777 CrossRef CAS.
- L. Kong, G. Fang, X. Xi, Y. Wen, Y. Chen, M. Xie, F. Zhu, D. Zhou and J. Zhan, Chem. Eng. J., 2021, 403, 126445 CrossRef CAS.
- R. Luo, M. Li, C. Wang, M. Zhang, M. A. Nasir Khan, X. Sun, J. Shen, W. Han, L. Wang and J. Li, Water Res., 2019, 148, 416–424 CrossRef CAS PubMed.
- Q. Shi, S. Pu, X. Yang, P. Wang, B. Tang and B. Lai, Chin. Chem. Lett., 2022, 33(4), 2129–2133 CrossRef CAS.
- H. Zhu, R. Jia, S. Sun, G. Feng, M. Wang, L. Sun and L. Hou, Ecotoxicol. Environ. Saf., 2020, 205, 111343 CrossRef CAS PubMed.
- H. Cai, J. Zou, J. Lin, J. Li, Y. Huang, S. Zhang, B. Yuan and J. Ma, Chem. Eng. J., 2022, 429, 132438 CrossRef CAS.
- F. Moradian, B. Ramavandi, N. Jaafarzadeh and E. Kouhgardi, Waste Manag., 2020, 118, 591–599 CrossRef CAS PubMed.
- J. Zhu, S. Wang, H. Li, J. Qian, L. Lv and B. Pan, Water Res., 2021, 202, 117397 CrossRef CAS PubMed.
- Z. Wang, Z. Wang, W. Li, Y. Lan and C. Chen, Chem. Eng. J., 2022, 427, 130888 CrossRef CAS.
- M. Kohantorabi, G. Moussavi and S. Giannakis, Chem. Eng. J., 2021, 411, 127957 CrossRef CAS.
- J. Deng, S. Feng, X. Ma, C. Tan, H. Wang, S. Zhou, T. Zhang and J. Li, Sep. Purif. Technol., 2016, 167, 181–189 CrossRef CAS.
- L. Jin, S. You, X. Duan, Y. Yao, J. Yang and Y. Liu, J. Hazard. Mater., 2022, 423, 127111 CrossRef CAS PubMed.
- C. Lyu, D. He, Z. Mou and X. Yang, Sci. Total Environ., 2019, 693, 133589 CrossRef PubMed.
- L. Zhu, Z. Shi, L. Deng and Y. Duan, Colloids Surf., A, 2021, 609, 125637 CrossRef CAS.
- A. Cheraghi, H. Becker, H. Eftekhari, H. Yoozbashizadeh and J. Safarian, Mater. Today Commun., 2020, 25, 101382 CrossRef CAS.
- M. Lei, B. Ma, D. Lv, C. Wang, E. Asselin and Y. Chen, Hydrometallurgy, 2021, 199, 105533 CrossRef CAS.
- S. Keshavarz, F. Faraji, F. Rashchi and M. Mokmeli, J. Environ. Manage., 2021, 285, 112153 CrossRef CAS PubMed.
- X. Liu, L. Wang, F. Qian, Z. Qing, X. Xie and Y. Song, Sep. Purif. Technol., 2022, 281, 119844 CrossRef CAS.
- M. Huang, S. Peng, W. Xiang, C. Wang, X. Wu, J. Mao and T. Zhou, Chem. Eng. J., 2022, 429, 132372 CrossRef CAS.
- N. Wahba, M. F. El Asmar and M. M. El Sadr, Anal. Chem., 1959, 31, 1870–1871 CrossRef CAS.
- J. You, C. Zhang, Z. Wu, Z. Ao, W. Sun, Z. Xiong, S. Su, G. Yao and B. Lai, Chem. Eng. J., 2021, 415, 128890 CrossRef CAS.
- G. Kresse and J. Furthmüller, Phys. Rev. B, 1996, 54, 11169–11186 CrossRef CAS PubMed.
- G. Kresse and J. Hafner, Phys. Rev. B, 1993, 47, 558–561 CrossRef CAS PubMed.
- G. Kresse and J. Furthmüller, Comput. Mater. Sci., 1996, 6, 15–50 CrossRef CAS.
- J. P. Perdew, K. Burke and M. Ernzerhof, Phys. Rev. Lett., 1996, 77, 3865–3868 CrossRef CAS PubMed.
- D. A. Tompsett, D. S. Middlemiss and M. S. Islam, Phys. Rev. B, 2012, 86, 205126 CrossRef.
- X. Ye, X. Jiang, L. Chen, W. Jiang, H. Wang, W. Cen and S. Ma, Appl. Surf. Sci., 2020, 521, 146477 CrossRef CAS.
- O. Yalcin, I. E. Wachs and I. Onal, Int. J. Hydrogen Energy, 2021, 46, 17154–17162 CrossRef CAS.
- Z. Han, C. Wang, X. Zou, T. Chen, S. Dong, Y. Zhao, J. Xie and H. Liu, Appl. Surf. Sci., 2020, 502, 144201 CrossRef.
- B. Liu, Y. Zhang, J. Wang, M. Lu, Z. Peng, G. Li and T. Jiang, Adv. Powder Technol., 2017, 28, 2167–2176 CrossRef CAS.
- M. Boyrazlı and E. Arancı Öztürk, J. Mol. Struct., 2019, 1198, 126875 CrossRef.
- F. Zhou, C. Yan, H. Wang, Q. Sun, Q. Wang and A. Alshameri, Miner. Eng., 2015, 78, 15–20 CrossRef CAS.
- Y. Feng and X. Li, RSC Adv., 2020, 10, 36192–36200 RSC.
- L. Ma, D. Cai and S. Tu, Chem. Eng. J., 2020, 382, 123040 CrossRef CAS.
- Z. Bakhtiarzadeh, S. Rouhani, Z. Karimi, S. Rostamnia, T. A. M. Msagati, D. Kim, H. W. Jang, S. Ramakrishna, R. S. Varma and M. Shokouhimehr, Mol. Catal., 2021, 509, 111603 CrossRef CAS.
- U. Asim, S. M. Husnain, N. Abbas, F. Shahzad, A. R. Khan and T. Ali, J. Ind. Eng. Chem., 2021, 98, 375–382 CrossRef CAS.
- M. Gayathri, M. Shanthi, E. Satheeshkumar, N. Jayaprakash and E. Sundaravadivel, Mater. Today: Proc., 2021, 42, 1506–1512 CAS.
- R. Yang, Q. Peng, B. Yu, Y. Shen and H. Cong, Sep. Purif. Technol., 2021, 267, 118620 CrossRef CAS.
- B. Goswami and D. Mahanta, J. Environ. Chem. Eng., 2020, 8, 103919 CrossRef CAS.
- F. Ghourchian, N. Motakef-Kazemi, E. Ghasemi and H. Ziyadi, J. Environ. Chem. Eng., 2021, 9, 106388 CrossRef CAS.
- N. Rani and B. S. Dehiya, Ceram. Int., 2020, 46, 23516–23525 CrossRef CAS.
- R. K. Singha, A. Yadav, A. Agrawal, A. Shukla, S. Adak, T. Sasaki and R. Bal, Appl. Catal., B, 2016, 191, 165–178 CrossRef CAS.
- F. Liu, H. Zhou, Z. Pan, Y. Liu, G. Yao, Y. Guo and B. Lai, J. Hazard. Mater., 2020, 400, 123322 CrossRef CAS PubMed.
- Y. Mu, Z. Ai and L. Zhang, Environ. Sci. Technol., 2017, 51, 8101–8109 CrossRef CAS PubMed.
- M. M. Mian, G. Liu, B. Fu and Y. Song, Appl. Catal., B, 2019, 255, 117765 CrossRef CAS.
- H. Fu, P. Zhao, S. Xu, G. Cheng, Z. Li, Y. Li, K. Li and S. Ma, Chem. Eng. J., 2019, 375, 121980 CrossRef CAS.
- J. Du, J. Bao, Y. Liu, S. H. Kim and D. D. Dionysiou, Chem. Eng. J., 2019, 376, 119193 CrossRef CAS.
- T. Yamashita and P. Hayes, Appl. Surf. Sci., 2008, 254, 2441–2449 CrossRef CAS.
- M. Pérez-Urquiza and J. L. Beltrán, J. Chromatogr. A, 2001, 917, 331–336 CrossRef.
- S. Feng, B. Xiao, M. Wu, Y. Wang, R. Chen and H. Liu, Sep. Purif. Technol., 2020, 248, 117004 CrossRef CAS.
- L. Hou, X. Li, Q. Yang, F. Chen, S. Wang, Y. Ma, Y. Wu, X. Zhu, X. Huang and D. Wang, Sci. Total Environ., 2019, 663, 453–464 CrossRef CAS PubMed.
- M. Ahmadi and F. Ghanbari, Mater. Res. Bull., 2019, 111, 43–52 CrossRef CAS.
- J. Yu, T. Zeng, H. Wang, H. Zhang, Y. Sun, L. Chen, S. Song, L. Li and H. Shi, Chem. Eng. J., 2020, 394, 124458 CrossRef CAS.
- Z. Wu, Y. Wang, Z. Xiong, Z. Ao, S. Pu, G. Yao and B. Lai, Appl. Catal., B, 2020, 277, 119136 CrossRef CAS.
- A. Cruz-Alcalde, N. López-Vinent, R. S. Ribeiro, J. Giménez, C. Sans and A. M. T. Silva, Chem. Eng. J., 2022, 427, 130994 CrossRef CAS.
- L. Chen, T. Maqbool, C. Hou, W. Fu and X. Zhang, Sep. Purif. Technol., 2022, 281, 119882 CrossRef CAS.
- G. Zhao, W. Li, H. Zhang, W. Wang and Y. Ren, Chem. Eng. J., 2022, 430, 132937 CrossRef CAS.
- J. Wang and S. Wang, Chem. Eng. J., 2018, 334, 1502–1517 CrossRef CAS.
- R. Yuan, Z. Jiang, Z. Wang, S. Gao, Z. Liu, M. Li and G. Boczkaj, J. Colloid Interface Sci., 2020, 571, 142–154 CrossRef CAS PubMed.
- Z. Huang, P. Wu, J. Liu, S. Yang, M. Chen, Y. Li, W. Niu and Q. Ye, Chem. Eng. J., 2020, 395, 124936 CrossRef CAS.
|
| This journal is © The Royal Society of Chemistry 2022 |
Click here to see how this site uses Cookies. View our privacy policy here.  Open Access Article
 *a and
Wanglai Cen
 c
c


