 Open Access Article
Conversion of coal into N-doped porous carbon for high-performance SO2 adsorption
Qi Wang†
*a,
Liang Han†b,
Yutong Wanga,
Zhong Hea,
Qingtong Mengb,
Shiqing Wangc,
Ping Xiaoa and
Xilai Jia *b
*b
aHuaneng Clean Energy Research Institute, Beijing 102209, PR China. E-mail: q_wang@qny.chng.com.cn
bSchool of Materials Science and Engineering, University of Science and Technology Beijing, Beijing 100083, PR China. E-mail: jiaxl@ustb.edu.cn
cBeijing Key Laboratory of CO2 Capture and Treatment, Beijing 102209, PR China
First published on 18th July 2022
Abstract
The large-scale burning of coal has led to increasingly serious SO2 environmental pollution problems. The SO2 adsorption and removal technology based on porous carbons has the advantages of less water consumption, no secondary pollution, recycling of pollutants, and renewable utilization of adsorbents, in contrast to the wet desulfurization process. In this work, we developed a series of N-doped coal-based porous carbons (NCPCs) by calcining a mixture of anthracite, MgO, KOH and carbamide at 800 °C. Among them, the NCPC-2 sample achieves a high N-doped amount of 1.29 at%, and suitable pores with a specific surface area of 1370 m2 g−1 and pore volume of 0.62 cm3 g−1. This N-doped porous carbon exhibits excellent SO2 adsorption capacity as high as 115 mg g−1, which is 3.47 times that of commercial coal-based activated carbon, and 2 times that of NCPC-0 without N-doping. Theoretical calculations show that the active adsorption sites of SO2 are located at the edges and gaps of carbon materials, and surface N doping enhances the adsorption affinity of carbon materials for SO2. In addition, the NCPCs prepared in this work are rich in raw materials and cheap, which meets the needs of industrial production, having excellent SO2 adsorption capacity.
Introduction
Due to the massive combustion of coal, the enormous SO2 emissions were bound to cause environmental pollution, and harm human health, which is seriously contrary to the concept of sustainable development.1,2 At present, the mainstream industrial desulfurization technology is the wet desulfurization process for excellent desulfurization efficiency and economic benefits.3 Unfortunately, it generates a lot of wastewater and industrial by-products (e.g. low-quality CaSO4 and greenhouse gas CO2 emission), resulting in secondary environmental pollution.4–7 Therefore, it is necessary to select a new desulfurization technology which is green, economical, highly efficient, and sulfur-recyclable.The adsorption and removal of SO2 by porous nanocarbon, such as active coke,8 activated carbon fiber,9–11 activated carbon,12–15 carbon nanotubes,16 and composite nanocarbon materials,17,18 has become one of the most promising methods, due to the advantages of low water consumption, recycling and sulfur recovery.19–21 However, the adsorption capacity of pure nanocarbon for SO2 is unsatisfactory. Considering the active adsorption sites and acidic nature of SO2, design and synthesis of porous nitrogen-inducted carbon materials has become a research hotspot for improving the adsorption capacity of SO2. When the carbon materials surface contains nitrogenous basic functional groups, SO2 molecules are adsorbed due to acid–base interactions. More importantly, N-doping changes the surface electrostatic potential of N-adjacent carbon atoms, and increases its local electronic density, the polarity of the carbon atoms and the surface charge distribution by conjugation effect, enhancing the interactions between SO2 molecules and carbon surface.7,22 In previous studies, many researchers have paying close attention to improving the SO2 adsorption capacity by adjusting the pore structure of the activated carbon materials (e.g. activated coke, activated carbon and activated carbon fiber) with high specific surface area. Some researchers introduced nitrogen heteroatoms on the surface of activated carbon by post-treatment to increase the chemical adsorption of SO2, which is complicated and cumbersome, and low nitrogen doping amount. Although some researchers have prepared in situ functional N-doped carbon materials with controllable structures using nitrogen-containing metal organic frameworks,23–26 or biomass27–30 for removal of SO2, the preparation cost of the carbon materials is high, and not suitable for industrial application. Some researchers17,31 have prepared N-doped porous carbon in situ using nitrogen sources such as melamine, however, the adsorption performance of SO2 is not ideal.
In this work, the purpose is to illustrate the effect mechanism of N-doping contents and pore configuration of N-doped coal-based porous carbon (NCPCs) on SO2 removal process by automatic chemical adsorption apparatus. The N-rich NCPCs with typical pore structure is prepared by a one-step method from anthracite in a facile, low-cost and controllable preparation process. The results show that N-doping increases the single-point adsorption energy of carbon materials for SO2, but destroys the micropores of carbon materials. Therefore, a suitable N-doping content coal-based porous carbon (the NCPC-2 sample) exhibits an excellent SO2 adsorption capacity as high as 115 mg g−1, which is 3.47 times that of commercial coal-based activated carbon, and 2 times that of NCPC-0 without N-doping.
Experimental section
Material
Carbamide (A.R.), KOH (A.R.), light MgO (A.R.) and hydrochloric acid (A.R.) were provided by Sinopharm Chemical Reagent Company. Anthracite was purchased from Shanxi Jincheng Anthracite Coal Mining Group. Commercial coal-based activated carbon (CAC, 200 mesh) was purchased from Henan Jingchuan Environmental Protection Technology Company. All the gases were purchased from Air Liquide Tianjin.Preparation of NCPC
Anthracite, light MgO, KOH and carbamide were used as carbon sources, templates/catalysts, activators/alkali fluxes and nitrogen sources, respectively. In a typical preparation, powdered anthracite (50–200 mesh, 8 g), light MgO (8 g), KOH (40 g) and carbamide (16 g) are stirred for 1 min through a high-speed pulverizer. After that, a viscous black slurry was obtained. Next, the slurry was heated at 800 °C for 4 h in a N2 atmosphere (50 mL min−1) using a tube furnace. Black chips were obtained after the tube furnace cooled to room temperature naturally. The chips were washed by hydrochloric acid (3 mol L−1) and water until neutral, and then dried at 70 °C overnight. The NCPC samples were obtained, as shown in Fig. 1a. The NCPC samples with different carbamide contents (0 g, 8 g, 16 g, and 24 g) were named as NCPC-0, NCPC-1, NCPC-2, and NCPC-3, respectively. The specific parameters are shown in Table 1.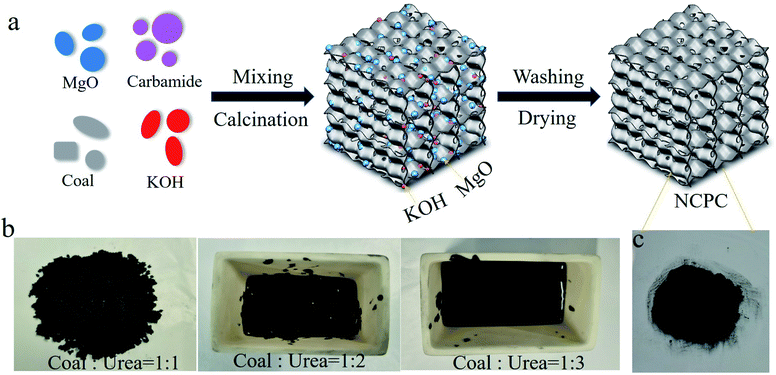 | ||
| Fig. 1 (a) Schematic diagram of prepared N-doped coal-based porous carbon with various N-doped contents through carbamide, Optical photos of the (b) mixture and (c) NCPC-2. | ||
| Samples | Anthracite (g) | MgO (g) | KOH (g) | Carbamide (g) |
|---|---|---|---|---|
| NCPC-0 | 8.0 | 8.0 | 40.0 | 0 |
| NCPC-1 | 8.0 | 8.0 | 40.0 | 8.0 |
| NCPC-2 | 8.0 | 8.0 | 40.0 | 16.0 |
| NCPC-3 | 8.0 | 8.0 | 40.0 | 24.0 |
Characterization
The microscopic morphologies and crystal structure of the NCPCs samples were characterized through scanning electron microscopy (SEM, JSM-6700), transmission electron microscopy (TEM, JEM-2010) and X-ray powder diffraction (PXRD, Bruker D8) between 10° and 70°, respectively. The structure effect of N-doping on the NCPC samples were characterized by the Raman spectrophotometer (Horiba JobinYvon Lab RAMHR800) at 633 nm. The pore structure of NCPC samples were analyzed by argon adsorption–desorption (BET, Micromeritics ASAP 2460, 87.28 K) experiments and the non-local density functional theory (NLDFT). The surface information for NCPCs samples were carried out by X-ray photoelectron spectroscopy (XPS, PHI 3057). The impurity contents for NCPCs samples were recorded by Thermogravimetric analysis (TGA, NETZSCH STA449F3 analyser).SO2 removal experiments
The SO2 removal experiments were performed by Automatic Chemical Adsorption Apparatus (BELCAT II) at 25 °C. The total flow rate of the simulated flue gas (1200 ppm SO2, He balance gas) was 30 mL min−1. Specifically, 50 mg of a NCPC or CAC sample were put into a quartz tube, and He purged for 5 min. After the adsorption zone reached to 25 °C, the simulated flue gas was introduced into the adsorption tube. The concentration of SO2 was recorded by a thermal conductivity cell detector (TCD).SO2 removal capacity (QSO2, mg g−1) of samples was calculated by the equation:
 | (1) |
Density functional theory calculation
The density functional theory (DFT) calculations were carried out in Gaussian 09 software to explore surface SO2 adsorption energy of coal-based porous carbon with or without N-doped. The single point SO2 adsorption energy (Ead) is obtained through single point energy calculations of the coal-based porous carbon graphitic layer at the B3LYP/6-31G (d, p) level. Ead is as follows,| Ead = Ecomplex − Esurface − ESO2 | (2) |
Results and discussion
With the addition of carbamide, the uniform mixture formed gradually to a black liquid viscous slurry (Fig. 1b) due to the melting of carbamide under the high-speed shearing. In previous studies, anthracite powder was catalytically cracked to porous nano-carbon in the presence of light MgO.32,33 As an alkali flux and chemical activator, KOH may react with the silicon–aluminum compound in the anthracite powder, contributing to the development of micropores and reducing the ash content of the nano-carbon.34 The N atoms from the crack of carbamide at high temperature can be doped into the nano-carbon framework. Therefore, coal-based N-doped porous carbon were achieved by carbonizing the mixture and etching MgO and KOH with hydrochloric acid and water. Changing the feeding ratio of carbamide contributes to NCPC samples with different nitrogen doping levels. Fig. 1c shows that the as-prepared NCPC-2 was loose fine powder.The morphology and structure of the NCPCs (NCPC-0, NCPC-1, NCPC-2, and NCPC-3) were investigated. As shown in Fig. 2a–d, the SEM images of the NCPCs presented a porous irregular block structure with many macropores. The low-magnification TEM images (Fig. 2e–h) of the NCPCs showed a three-dimensional interconnected open pore-like network. Under high magnification electron microscope (Fig. 2i–l), carbon skeleton for N-free and N-rich NCPCs contain abundant nanopores, which are favorable for the adsorption and storage of SO2. Meanwhile, N-rich NCPCs contain obvious graphite layers, indicating high mechanical strength of the carbon frameworks.
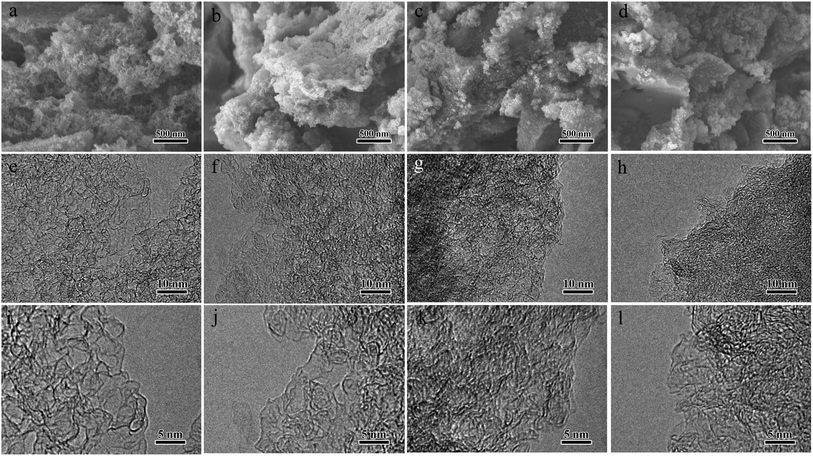 | ||
| Fig. 2 (a–d) SEM images, (e–h) low-magnification TEM, and (i–l) high-magnification TEM images of prepared NCPC-0, NCPC-1, NCPC-2 and NCPC-3, respectively. | ||
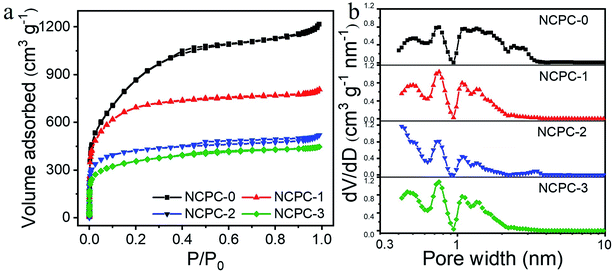
Further, the detailed pore structures for the NCPCs were obtained through the argon adsorption–desorption experiments (Fig. 3). As shown in Fig. 3a, the argon adsorption–desorption isotherms of NCPC-0 present composite type of type-I and type-IV models, while NCPC-1, NCPC-2 and NCPC-3 are the type-I physical adsorption curves. When the relative pressure (P/P0) is close to 0, the liquid argon adsorption–desorption curves for the NCPCs are vertically upward, indicating that there are a large number of micropores. The higher the curve, the higher the micropore content. For the NCPC-0 and NCPC-1, when the P/P0 is ranging from 0.4 to 0.9, there are obvious hysteresis loop in the adsorption and desorption curves, suggestion the presence of the mesoporous. When the P/P0 is close to 1, the curve has a steep protrusion, indicating that the material contains certain macropores. Comprehensive analysis shows that these two materials have a porous structure, which is conducive to the physical adsorption of SO2, the transfer and storage of sulfuric acid molecules formed after chemical oxidation.5 With the carbamide contents increasing, the proportion of micropores gradually decreases, and the specific surface area of the prepared NCPCs decreases from 2714 to 2197, 1380 and 1123 m2 g−1, respectively (Table 2). For the N-free NCPC-0, the specific surface area is as high as 2714 m2 g−1, indicating that the coal-based porous carbon exhibits a nanoporous carbon with a thickness of one atom.35,36 Nitrogen doping on the carbon surface reduces the micropores and mesopores of coal-based porous carbon, reducing the specific surface area. The total pore volume is 1.42, 0.95, 0.62, and 0.52 cm3 g−1, respectively, according to the NLDFT model, which is related to the micropores and mesopores of the materials.
| Samples | SBET (m2 g−1) | Vt (cm3 g−1) | Pore diameter (nm) | ID/IG |
|---|---|---|---|---|
| NCPC-0 | 2714 | 1.42 | <3 | 2.63 |
| NCPC-1 | 2197 | 0.95 | <3 | 3.24 |
| NCPC-2 | 1380 | 0.62 | <3 | 2.28 |
| NCPC-3 | 1123 | 0.52 | <3 | 2.39 |
The pore size distribution curves (Fig. 3b) of NCPCs are obtained through differentiating the pore volume-pore size curves. It can be seen that the pore sizes of both N-free and N-rich NCPCs are ranging from 0.4 to 3 nm, and the possible pore sizes are 0.75 nm and 1.07 nm, respectively. However, the pore size distribution of NCPCs is more concentrated after adding carbamide. In previous studies, it was found that micropores with a pore size of 0.7 nm are active adsorption sites for physical adsorption and oxidation of SO2 molecules to SO3.16,37,38 N-free NCPC-0 has continuous pores, and the proportions of different pore sizes are equivalent, which is consistent with the typical activated carbon pore size distribution. In comparison, the pore size distribution range of N-rich NCPCs is relatively concentrated. In short, the N-doped coal-based porous carbon has a controllable pore structure, specific surface area and pore volume, by simply changing the carbamide additions.
The PXRD patterns of the N-free and N-rich NCPCs (NCPC-0, NCPC-1, NCPC-2 and NCPC-3) samples are shown in Fig. 4a. For NCPC-0 and NCPC-1, a weak peak located at 2θ = 45° correspond to the (100) planes of the nanocarbon, absence of (002) planes, suggesting a typical activated carbon structure. Contrast with NCPC-0 and NCPC-1, the two typical peaks located at near 2θ = 26° and 45° were observed for N-rich NCPCs (NCPC-2 and NCPC-3), corresponding to the (002) and (100) planes of the nanocarbon,39,40 respectively. This is indicated that N-rich NCPCs possess a certain degree of graphitization, which is consistent with the TEM images. The full width at half maximum of the (002) and (100) crystal plane of N-rich CHNPCs samples gradually decreased with the increasing of carbamide feed ratio. Besides, the (100) plane peaks of N-rich NCPCs are gradually enhanced, further illustrating that N atoms are doped into the carbon crystal lattice. Besides, the weak diffraction peaks observed in 20–30° for NCPC-3 belong to the peaks of MgO (PDF#27-0759), which may be the residues encapsulated inside the NPC materials.
Furthermore, the effect of N-doping on the structure of NCPC is characterized by Raman spectroscopy (Fig. 4b). The typical D peak (∼1350 cm−1), G peak (∼1600 cm−1), weak I peak and D′′ peak correspond to disordered graphite structure, ordered carbon stacking structure of sp2-C, vibration of sp2–sp3 bonded carbon, and vibration of amorphous carbon, respectively.33,41–43 Compared with N-free NCPC-0, the D peak locations for N-rich NCPCs shift to high wavenumber, due to the different C–C and C–N bond distances leading to structural deformation, illustrating the doping of N atoms into the carbon lattice.32 Based on the Gaussian law of fitting, the intensity ratio of D and G peak (ID/IG) is 2.63, 3.24, 2.28 and 2.39, respectively (Table 2). With the increase of carbamide addition, the specific surface area gradually decreases, and its outer surface boundary decreased, resulting in a significant reduction in the defect degree of its notch. At the same time, the defects degree caused by the destruction of the stacking structure by heteroatom doping gradually increased with the increase of the amount of urea addition. Therefore, the resulting intensity ratio of D and G peak of the coal-based carbon material first increases, then decreases greatly, and then increases in a small range.
The thermogravimetric analysis (TGA) curves under air atmosphere of N-free and N-rich NCPCs are shown in Fig. 4c. The weight loss onset temperatures of NCPCs (NCPC-0, NCPC-1, NCPC-2 and NCPC-3) were 510 °C, 397 °C, 394 °C and 495 °C, respectively. Generally, the introduction of heteroatoms on the carbon materials surface increases defect sites and reduces their stability, being more susceptible to oxidation.31 However, the starting temperature of the weight loss of NCPC-3 is much higher than that of NCPC-0 and NCPC-2. This may be due to that with the increase of carbamide addition, the specific surface area and outer surface boundary decrease, resulting in a more ordered C–C stacking structure. After calculation, the ash ratio of NCPCs (NCPC-0, NCPC-1, NCPC-2 and NCPC-3) is only 7.2%, 2.3%, 0.6% and 4.1%, respectively, where the residue was a small amount of insoluble matter for coal.
In order to determine the effect of N-doping level and type on SO2 adsorption, a batch of NCPCs materials with different N-doped contents were prepared by adjusting the carbamide additions. Further, the N-doped contents and doping form were obtained by XPS. XPS full spectrum of NCPCs was shown in Fig. 5a. Since the N-doped content of the four materials is generally low, the XPS full spectrum only contains the peaks of C and O elements, absence of the peak of N element. The contents of C, N and O elements of NCPCs are shown in Table 3. The sample NCPC-0 contains a very small amount of N due to the raw coal containing amino acids.44 With the increase of carbamide feed ratio, the relationship between N-doped contents and O-doped contents of NCPCs is shown in Fig. 5b. Among them, the N-doped contents gradually increases from 0.47 at% to 1.52 at%, with the increase of carbamide addition. While the O-doped contents decreased significantly and then increased slightly with the increase of carbamide feed ratio. Taking the sample NCPC-2 as an example, the high-resolution N1s spectra (Fig. 5c) can be deconvoluted into three representative peaks of pyridinic-N (N-6), graphitic-N (N-G) and N-oxide (N![[double bond, length as m-dash]](https://www.rsc.org/images/entities/char_e001.gif) O), respectively.45 The high-resolution O1s spectra (Fig. 5d) can be deconvoluted into three representative peaks of carbonyl oxygen (C
O), respectively.45 The high-resolution O1s spectra (Fig. 5d) can be deconvoluted into three representative peaks of carbonyl oxygen (C![[double bond, length as m-dash]](https://www.rsc.org/images/entities/char_e001.gif) O), carboxyl oxygen (O
O), carboxyl oxygen (O![[double bond, length as m-dash]](https://www.rsc.org/images/entities/char_e001.gif) C–O) and N-oxide (N
C–O) and N-oxide (N![[double bond, length as m-dash]](https://www.rsc.org/images/entities/char_e001.gif) O), respectively. Some researchers found that pyridine nitrogen and graphitic nitrogen promote the adsorption of SO2 by enhancing the electrostatic interaction of adjacent carbon atoms and the van der Waals force between the surface of carbon materials and SO2, respectively.22 Studies have shown that C–O complexes may occupy the adsorption carbon sites of SO2.46 Therefore, it is favorable to enhancing the adsorption of SO2 that high pyridinic nitrogen and graphitic nitrogen doping levels.
O), respectively. Some researchers found that pyridine nitrogen and graphitic nitrogen promote the adsorption of SO2 by enhancing the electrostatic interaction of adjacent carbon atoms and the van der Waals force between the surface of carbon materials and SO2, respectively.22 Studies have shown that C–O complexes may occupy the adsorption carbon sites of SO2.46 Therefore, it is favorable to enhancing the adsorption of SO2 that high pyridinic nitrogen and graphitic nitrogen doping levels.
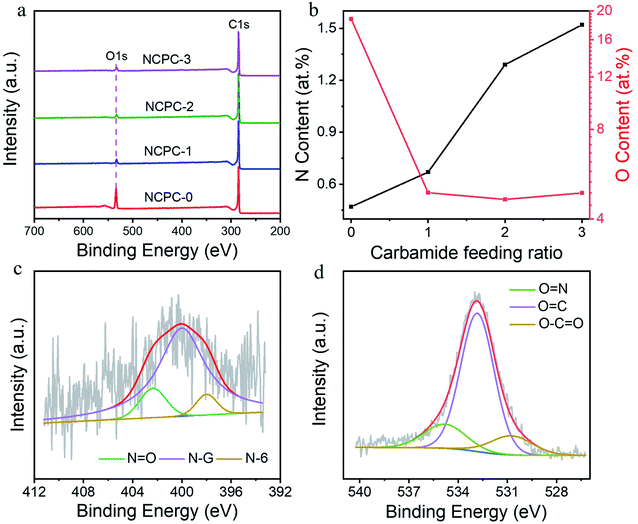 | ||
| Fig. 5 (a) XPS survey spectra, (b) dependence of N content and O content on carbamide feeding ratio, (c) high-resolution N1s spectra and (d) high-resolution O1s spectra of NCPC-2. | ||
| Samples | XPS (at%) | ||
|---|---|---|---|
| C | N | O | |
| NCPC-0 | 80.74 | 0.47 | 18.79 |
| NCPC-1 | 94.44 | 0.67 | 4.90 |
| NCPC-2 | 94.06 | 1.29 | 4.65 |
| NCPC-3 | 93.59 | 1.52 | 4.89 |
SO2 molecules are adsorbed on the micropores of porous carbon surface through capillary force, and are oxidized into H2SO4 in the presence of O2 and H2O, which are transferred to and stored in mesopores or macropores of carbon materials.5 In addition, the SO2 adsorption would be enhanced by chemical action, as N-containing basic functional groups are introduced into the carbon surface. A series of N-doped coal-based carbon materials with similar pore structure and various N-doping contents were used as SO2 adsorbents, aiming to explore the influence of N-doped contents on SO2 adsorption.
The SO2 adsorption kinetics of N-free and N-rich NCPCs were researched through the SO2 breakthrough curve (Fig. 6a) at 25 °C and normal pressure. As shown in Fig. 6a, the breakthrough time of N-free and N-rich NCPCs is different, following the order of NCPC-2 > NCPC-3 > NCPC-1 > NCPC-0. After calculation, the SO2 adsorption capacity of CAC is only 33.25 mg g−1 (Table 4). However, the SO2 adsorption capacity (QSO2) by N-free and N-rich NCPCs is 53.18, 91.30, 115.65 and 111.99 mg g−1, respectively, Much higher SC than CAC. The SO2 adsorption capacity is inversely proportional to the amount of C–O complexes.46 Although the specific surface area for NCPC-0 is largest, the desulfurization ability is lowest, indicating that N-doping carbon surfaces contributes to the SO2 adsorption. In order to further prove that N-doping is beneficial to the SO2 adsorption, the curve of SO2 adsorption and nitrogen doping levels of N-rich NCPCs were plotted (Fig. 6b). With the increase of carbamide addition, even though the N-doped amount of NCPCs gradually increased, the specific surface area decreased, the microporous structure was destroyed, and the adsorption force of SO2 decreased, resulting in the QSO2 of the NCPCs first increased and then decreased.
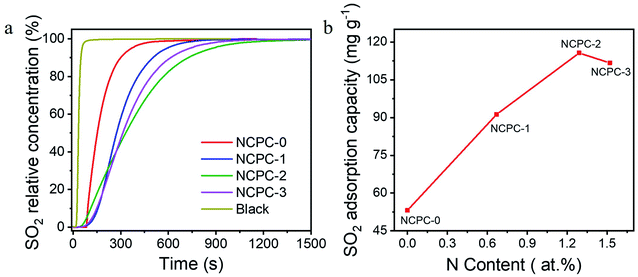 | ||
| Fig. 6 (a) SO2 breakthrough curves, and (b) dependence of SO2 adsorption capacity on N contents of prepared NCPCs. | ||
| Samples | QSO2 (mg g−1) |
|---|---|
| NCPC-0 | 53.18 |
| NCPC-1 | 91.30 |
| NCPC-2 | 115.65 |
| NCPC-3 | 111.69 |
| CAC | 33.25 |
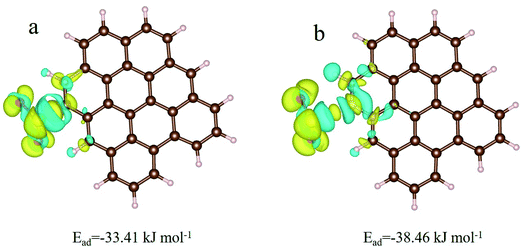
To further determine the active adsorption sites (i.e. plane and edge) and the effect of pyridinic-N on the SO2 adsorption, density functional theory (DFT) calculations were carried out to exploring surface single Ead of SO2 for different models of with or without N-doped coal-based porous carbon. During the calculation, an interesting phenomenon is that when we place SO2 molecules at the edge positions or near the basal plane of carbon, the geometry-optimized SO2 molecule was adsorbed at the carbon edge positions, not the surface, and not interacted directly with N atoms. That is, the adsorption of SO2 on with or without N-doped coal-based porous carbon tends to be at the edge and gap, which further supports the proof that the micropores are the active adsorption sites of SO2 molecule.
Fig. 7a and b is the charge-density differences of the coal-based porous carbon at the edge with one SO2 molecule absorbed. After calculation, one SO2 molecule acquires 0.161 and 0.164 charges from the edge carbon for the samples without and with N-doping, respectively, which indicates that N-doping increases the local electronic density of adjacent carbon atoms in N-doped carbon. In addition, the Ead of with or without N-doped coal-based porous carbon at the edge positions are 38.46 and 33.41 kJ mol−1, respectively, indicating that the surface of N-doped carbon can enhance the adsorption affinity of SO2. Combined with the data analysis of the structure of coal-based porous carbon and the adsorption capacity of SO2, N-doping improves the single-point adsorption energy of carbon materials for SO2, but destroys the micropores of carbon materials and reduces the number of active adsorption sites of SO2. Therefore, in this work, a suitable N-doping ratio is required for coal-based porous carbon with high SO2 saturated adsorption capacity.
Conclusion
In summary, we have achieved the precise preparation of N-doped coal-based porous carbon (NCPC) for the adsorption and removal of SO2 by a one-step method. By adjusting the feeding ratio of carbamide, the specific surface area, pore volume and N-doping amount of NCPCs can be precisely regulated. Theoretical calculations show that the active adsorption sites of SO2 are located at the edges and gaps of carbon materials, rather than the N atoms themselves. However, N-doping increases the single-point adsorption energy of carbon materials for SO2, enhancing the adsorption affinity of carbon materials for SO2. The experimental results show that with the increase of the urea addition amount, the specific surface area gradually decreases, and the micropores are gradually destroyed, reduced the number of active adsorption sites of SO2, while the N-doping amount increased gradually. The results support that porous carbon materials need to find a balance between specific surface area and nitrogen doping content for SO2 absorption. In addition, NCPCs can also be used for SO2 adsorption and removal in aerobic and water environments. Theoretically, the SO2 adsorption capacity is higher than that in anaerobic environment. However, the corresponding relationship between the SO2 adsorption capacity and the structure of NCPCs needs to be further studied. Meanwhile, it is necessary to explore the effects of pore structure and functional group types for carbon materials on SO2 adsorption through a single factor, and further to reveal the relationship between the structure of carbon materials and the SO2 adsorption, so as to provide theoretical guidance for the preparation of high-performance carbon materials with suitable functional units.Conflicts of interest
The authors declare that they have no financial or other personal interests that could have appeared to influence the work reported in this paper.Acknowledgements
This study was supported by the China Huaneng Group key R&D program (Grant No. TY-21-HJK07) and China National key R&D program (2019YFE0100100-02).References
- Z. Qie, F. Sun, J. Gao, X. Pi, L. Wang, M. Liu, Z. Qu and G. Zhao, Enhanced SO2 fluidized adsorption dynamic by hierarchically porous activated coke, J. Energy Inst., 2020, 93, 802–810 CrossRef CAS.
- K. Rabiei, N. Sarrafzadegan, A. Ghanbari, M. Shamsipour, M. S. Hassanvand, H. Amini, M. Yunesian and F. Farzadfar, The burden of cardiovascular and respiratory diseases attributed to ambient sulfur dioxide over 26 years, J. Environ. Health Sci. Eng., 2020, 18, 267–278 CrossRef CAS PubMed.
- X. Pi, F. Sun, J. Gao, Y. Zhu, L. Wang, Z. Qu, H. Liu and G. Zhao, Microwave Irradiation Induced High-Efficiency Regeneration for Desulfurized Activated Coke: A Comparative Study with Conventional Thermal Regeneration, Energy Fuels, 2017, 31, 9693–9702 CrossRef CAS.
- Z. Yan, L. Liu, Y. Zhang, J. Liang, J. Wang, Z. Zhang and X. Wang, Activated Semi-coke in SO2 Removal from Flue Gas: Selection of Activation Methodology and Desulfurization Mechanism Study, Energy Fuels, 2013, 27, 3080–3089 CrossRef CAS.
- F. Sun, J. Gao, X. Liu, X. Tang and S. Wu, A systematic investigation of SO2 removal dynamics by coal-based activated cokes: The synergic enhancement effect of hierarchical pore configuration and gas components, Appl. Surf. Sci., 2015, 357, 1895–1901 CrossRef CAS.
- T. Feng, X. Zhao, T. Wang, X. Xia, M. Zhang, Q. Huan and C. Ma, Reduction of SO2 with CO to Elemental Sulfur in Activated Carbon Bed, Energy Fuels, 2016, 30, 6578–6584 CrossRef CAS.
- F. Sun, J. Gao, X. Liu, Y. Yang and S. Wu, Controllable nitrogen introduction into porous carbon with porosity retaining for investigating nitrogen doping effect on SO2 adsorption, Chem. Eng. J., 2016, 290, 116–124 CrossRef CAS.
- Q. Liu, J. S. Guan, J. Li and C. Li, SO2 removal from flue gas by activated semi-cokes, Carbon, 2003, 41, 2225–2230 CrossRef CAS.
- X. Zhou, H. Yi, X. Tang, H. Deng and H. Liu, Thermodynamics for the adsorption of SO2, NO and CO2 from flue gas on activated carbon fiber, Chem. Eng. J., 2012, 200–202, 399–404 CrossRef CAS.
- C. L. Mangun, J. A. DeBarr and J. Economy, Adsorption of sulfur dioxide on ammonia-treated activated carbon fibers, Carbon, 2001, 39, 1689–1696 CrossRef CAS.
- K. Li, L. Ling, C. Lu, W. Qiao, Z. Liu, L. Liu and I. Mochida, Catalytic removal of SO2 over ammonia-activated carbon fibers, Carbon, 2001, 39, 1803–1808 CrossRef CAS.
- Y. Guo, Y. Li, T. Zhu and M. Ye, Effects of Concentration and Adsorption Product on the Adsorption of SO2 and NO on Activated Carbon, Energy Fuels, 2012, 27, 360–366 CrossRef.
- J.-x. Guo, J. Liang, Y.-H. Chu, M.-C. Sun, H.-Q. Yin and J.-J. Li, Desulfurization activity of nickel supported on acid-treated activated carbons, Appl. Catal., A, 2012, 421–422, 142–147 CrossRef CAS.
- T. Qiang, Z. Zhigang, Z. Wenpei and C. Zidong, SO2 and NO selective adsorption properties of coal-based activated carbons, Fuel, 2005, 84, 461–465 CrossRef.
- S. Wang, S. Xu, S. Gao, P. Xiao, M. Jiang, H. Zhao, B. Huang, L. Liu, H. Niu, J. Wang and D. Guo, Simultaneous removal of SO2 and NOx from flue gas by low-temperature adsorption over activated carbon, Sci. Rep., 2021, 11, 11003 CrossRef CAS PubMed.
- F. Sun, J. Gao, Y. Zhu, G. Chen, S. Wu and Y. Qin, Adsorption of SO2 by typical carbonaceous material: a comparative study of carbon nanotubes and activated carbons, Adsorption, 2013, 19, 959–966 CrossRef CAS.
- X. Song, G. Ning, X. Ma, Z. Yu and G. Wang, N-Doped Carbon Nanotube-Reinforced N-Doped Mesoporous Carbon for Flue Gas Desulfurization, Ind. Eng. Chem. Res., 2018, 57, 4245–4252 CrossRef CAS.
- B. Huang, Y. He, Z. Wang, Y. Zhu, Y. Zhang and K. Cen, High-Performance Pt Catalyst with Graphene/Carbon Black as a Hybrid Support for SO2 Electrocatalytic Oxidation, Langmuir, 2019, 36, 20–27 CrossRef PubMed.
- D. Y. C. Leung, G. Caramanna and M. M. Maroto-Valer, An overview of current status of carbon dioxide capture and storage technologies, Renewable Sustainable Energy Rev., 2014, 39, 426–443 CrossRef CAS.
- A. A. Abdulrasheed, A. A. Jalil, S. Triwahyono, M. A. A. Zaini, Y. Gambo and M. Ibrahim, Surface modification of activated carbon for adsorption of SO2 and NOX: A review of existing and emerging technologies, Renewable Sustainable Energy Rev., 2018, 94, 1067–1085 CrossRef CAS.
- J. M. Rosas, R. Ruiz-Rosas, J. Rodríguez-Mirasol and T. Cordero, Kinetic study of SO2 removal over lignin-based activated carbon, Chem. Eng. J., 2017, 307, 707–721 CrossRef CAS.
- Z. Qu, F. Sun, X. Liu, J. Gao, Z. Qie and G. Zhao, The effect of nitrogen-containing functional groups on SO2 adsorption on carbon surface: Enhanced physical adsorption interactions, Surf. Sci., 2018, 677, 78–82 CrossRef CAS.
- A. Wang, R. Fan, X. Pi, S. Hao, X. Zheng and Y. Yang, N-Doped Porous Carbon Derived by Direct Carbonization of Metal-Organic Complexes Crystal Materials for SO2 Adsorption, Cryst. Growth Des., 2019, 19, 1973–1984 CrossRef CAS.
- I. Ahmed and S. H. Jhung, Adsorptive desulfurization and denitrogenation using metal-organic frameworks, J. Hazard. Mater., 2016, 301, 259–276 CrossRef CAS PubMed.
- L. Chai, Z. Hu, X. Wang, L. Zhang, T.-T. Li, Y. Hu, J. Pan, J. Qian and S. Huang, Fe7C3 nanoparticles with in situ grown CNT on nitrogen doped hollow carbon cube with greatly enhanced conductivity and ORR performance for alkaline fuel cell, Carbon, 2021, 174, 531–539 CrossRef CAS.
- X. Wang, A. Dong, Y. Hu, J. Qian and S. Huang, A review of recent work on using metal-organic frameworks to grow carbon nanotubes, Chem. Commun., 2020, 56, 10809–10823 RSC.
- J. Zhang, P. Zhang, M. Li, Z. Shan, J. Wang, Q. Deng, Z. Zeng and S. Deng, Facile Preparation of Biomass-Derived Mesoporous Carbons for Highly Efficient and Selective SO2 Capture, Ind. Eng. Chem. Res., 2019, 58, 14929–14937 CrossRef CAS.
- F. L. Braghiroli, H. Bouafif and A. Koubaa, Enhanced SO2 adsorption and desorption on chemically and physically activated biochar made from wood residues, Ind. Crops Prod., 2019, 138 Search PubMed.
- A. C. Lua and T. Yang, Theoretical and experimental SO2 adsorption onto pistachio-nut-shell activated carbon for a fixed-bed column, Chem. Eng. J., 2009, 155, 175–183 CrossRef CAS.
- J. Zhang, J. Shao, D. Huang, Y. Feng, X. Zhang, S. Zhang and H. Chen, Influence of different precursors on the characteristic of nitrogen-enriched biochar and SO2 adsorption properties, Chem. Eng. J., 2020, 385 CAS.
- X. Song, X. Ma, G. Ning and J. Gao, Pitch-Based Nitrogen-Doped Mesoporous Carbon for Flue Gas Desulfurization, Ind. Eng. Chem. Res., 2017, 56, 4743–4749 CrossRef CAS.
- L. Han, Z. Li, F. Yang, Z. Xiao, Y. Yu, G. Ning and X. Jia, Enhancing capacitive storage of carbonaceous anode by surface doping and structural modulation for high-performance sodium-ion battery, Powder Technol., 2021, 382, 541–549 CrossRef CAS.
- X. Zhu, L. Han, F. Yang, J. Jiang and X. Jia, Lightweight mesoporous carbon fibers with interconnected graphitic walls for supports of form-stable phase change materials with enhanced thermal conductivity, Sol. Energy Mater. Sol. Cells, 2020, 208, 110361 CrossRef CAS.
- B. Y. Jibril, R. S. Al-Maamari, G. Hegde, N. Al-Mandhary and O. Houache, Effects of feedstock pre-drying on carbonization of KOH-mixed bituminous coal in preparation of activated carbon, J. Anal. Appl. Pyrolysis, 2007, 80, 277–282 CrossRef CAS.
- Y. Zhu, S. Murali, D. Stoller Meryl, K. J. Ganesh, W. Cai, J. Ferreira Paulo, A. Pirkle, M. Wallace Robert, A. Cychosz Katie, M. Thommes, D. Su, A. Stach Eric and S. Ruoff Rodney, Carbon-Based Supercapacitors Produced by Activation of Graphene, Sci, 2011, 332, 1537–1541 CrossRef CAS PubMed.
- L. Han, S. Kang, X. Zhu, J. Li, Q. Wang and X. Jia, High-Performance Lithium-Ion Capacitors Produced by Atom-Thick Carbon Cathode and Nitrogen-Doped Porous Carbon Anode, Energy Fuels, 2021, 35, 16894–16902 CrossRef CAS.
- Z.-M. Wang and K. Kaneko, Effect of Pore Width on Micropore Filling Mechanism of SO2 in Carbon Micropores, J. Phys. Chem. B, 1998, 102, 2863–2868 CrossRef CAS.
- E. Raymundo-Piñero, D. Cazorla-Amorós, C. Salinas-Martinez de Lecea and A. Linares-Solano, Factors controling the SO2 removal by porous carbons: relevance of the SO2 oxidation step, Carbon, 2000, 38, 335–344 CrossRef.
- X. Zhu, T. K. A. Hoang, G. Tan, X. Jia, R. Tao, F. Wu and P. Chen, Tuning Microstructures of Graphene to Improve Power Capability of Rechargeable Hybrid Aqueous Batteries, ACS Appl. Mater. Interfaces, 2018, 10, 37110–37118 CrossRef CAS PubMed.
- L. Han, X. Zhu, F. Yang, Q. Liu and X. Jia, Eco-conversion of coal into a nonporous graphite for high-performance anodes of lithium-ion batteries, Powder Technol., 2021, 382, 40–47 CrossRef CAS.
- X. Zhu, Q. Wang, S. Kang, J. Li and X. Jia, Coal-based ultrathin-wall graphitic porous carbon for high-performance form-stable phase change materials with enhanced thermal conductivity, Chem. Eng. J., 2020, 395, 125112 CrossRef CAS.
- Y. Liu, Z. Sun, X. Sun, Y. Lin, K. Tan, J. Sun, L. Liang, L. Hou and C. Yuan, Construction of Hierarchical Nanotubes Assembled from Ultrathin V3S4@C Nanosheets towards Alkali-Ion Batteries with Ion-Dependent Electrochemical Mechanisms, Angew. Chem., Int. Ed., 2020, 59, 2473–2482 CrossRef CAS PubMed.
- X. Tian, X. Li, T. Yang, K. Wang, H. Wang, Y. Song, Z. Liu, Q. Guo and C. Chen, Flexible carbon nanofiber mats with improved graphitic structure as scaffolds for efficient all-solid-state supercapacitor, Electrochim. Acta, 2017, 247, 1060–1071 CrossRef CAS.
- R. Moliner and J. M. Gavilan, Amino-acids in humic, nitrohumic and nitrofuvic acids from coal, Fuel, 1981, 60, 64–66 CrossRef CAS.
- S. A. Nicolae, J. Louis-Therese, S. Gaspard, P. Á. Szilágyi and M. M. Titirici, Biomass derived carbon materials: Synthesis and application towards CO2 and H2S adsorption, Nano Sel., 2022, 3, 165–177 CrossRef CAS.
- M. A. Daley, C. L. Mangun, J. A. DeBarrb, S. Riha, A. A. Lizzio, G. L. Donnals and J. Economy, Adsorption of SO2 onto oxidized and heat-treated activated carbon fibers (ACFs), Carbon, 1997, 35, 411–417 CrossRef CAS.
Footnote |
| † The two authors contributed equally. |
| This journal is © The Royal Society of Chemistry 2022 |

