 Open Access Article
Highly efficient green up-conversion emission from fluoroindate glass nanoparticles functionalized with a biocompatible polymer†
G. Lesly Jimenez *a,
Binita Shresthab,
Tyron Porterb,
Bartlomiej Starzyka,
Magdalena Lesniaka,
Marta Kuwik
 c,
Marcin Kochanowiczd,
Magdalena Szumeraa,
R. Lisieckie and
D. Dorosz
 a
a
aFaculty of Materials Science and Ceramics, AGH University of Science and Technology, A. Mickiewicza 30, 30-059 Krakow, Poland. E-mail: glesly@agh.edu.pl
bThe University of Texas at Austin, Austin, 78-712 Texas, USA
cInstitute of Chemistry, University of Silesia, Szkolna 9, 40-007 Katowice, Poland
dFaculty of Electrical Engineering, Bialystok University of Technology, Wiejska 45D Street, 15-351 Bialystok, Poland
eOptical Spectroscopy Division, University of Wrocław, plac Uniwersytecki 1, 50-137 Wrocław, Poland
First published on 11th July 2022
Abstract
Up-conversion nanoparticles have garnered lots of attention due to their ability to transform low energy light (near-infrared) into high-energy (visible) light, enabling their potential use as remote visible light nano-transducers. However, their low efficiency restricts their full potential. To overcome this disadvantage, fluoroindate glasses (InF3) doped at different molar concentrations of Yb3+ and Er3+ were obtained using the melting–quenching technique, reaching the highest green emission at 1.4Yb and 1.75Er (mol%), which corresponds to the 4S3/2 → 4I15/2 (540–552 nm) transition. The particles possess the amorphous nature of the glass and have a high thermostability, as corroborated by thermogravimetric assay. Furthermore, the spectral decay curve analysis showed efficient energy transfer as the rare-earth ions varied. This was corroborated with the absolute quantum yield (QY) obtained (85%) upon excitation at 385 nm with QYEr = 17% and QYYb = 68%. Additionally, InF3–1.4Yb–1.75Er was milled and functionalized using poly(ethylene glycol) to impart biocompatibility, which is essential for biomedical applications. Such functionalization was verified using FTIR, TG/DSC, and XRD.
Introduction
Interest in photo-switchable molecules in biotechnology has increased drastically in the last two decades due to their high spatiotemporal resolution as observed in a wide range of disciplines, such as photodynamic therapy,1 bioimaging,2 drug release,3 and neural modulation.4–6 However, most of them utilize Stokes-shifted emissions, whose excitation wavelength is located in the UV-vis range, where biological tissue has low penetration depth and high scattering, limiting their use in live organisms.2,7 To overcome such limitations, up-conversion nanoparticles (UCNPs) represent an attractive alternative owing to their ability to transform near-infrared light (NIR) into visible light, because NIR light possesses high tissue penetration, low autofluorescence, and low scattering, facilitating their application in remote control of numerous physiological functions in living organisms without invasive procedures or significant phototoxicity.8–10 However, their low up-conversion emission efficiency (<9%) restricts their full potential.2,7,9,11To overcome this disadvantage, great efforts have been made, including the use of different host matrices, such as single crystals, glasses, and glass–ceramic materials. Host matrices with low phonon energy (e.g., NaYF4 – 350 cm−1, ZBLAN – 330 cm−1, chalcogenide glasses – 300 cm−1, fluoroindate glasses – 510 cm−1) have been found to enhance the up-conversion emission process because of the suppression of non-radiative losses.12–15 Among the host matrices explored, NaYF4 is considered one of the most efficient systems; however, the high levels of OH− defects on it accelerate the quenching effect while high dopant concentrations (lanthanide ions) trigger the depletion of the excitation energy levels owing to the migration of the ions to the surface.16,17 However, the advantage of fluoroindate glasses over other low phonon energy materials is their better thermal stability, superior mechanical properties, excellent chemical resistance, and high rare-earth ion solubility.18,19
On the other hand, the most common techniques to obtain these particles are wet chemical reactions because of their high morphological control. However, the resultant particles are intrinsically porous, which increases the presence of impurities like OH groups, diminishing their intensity and quantum efficiency.17,18,20 Conversely, using the melting–quenching technique, the surface of the particles is non-porous, avoiding the presence of undesirable components that could trigger non-radiative decays, and, in addition, their reaction efficiency is better.18
The concentration of dopants (which can work as activators or sensitizers), the host matrix, and the reaction technique play key roles in an efficient energy transfer that can enhance the quantum efficiency of the up-converted emission process.21,22 For that reason, in this work, we optimized up-converted green light emission through the melting–quenching technique, using a fluoroindate glass (InF3) as a host matrix, leveraging its low phonon energy and high rare-earth elements solubility. Moreover, the dopants, Yb3+ and Er3+ were used at various concentrations to optimize receiving of the up-converted light. Then, the InF3 glass with the highest emission was milled and functionalized with poly(ethylene glycol) (PEG) to determine its cell viability. The primary up-converted emission was obtained in the range of 540–552 nm with an excitation of 808 and 980 nm, which is well-matched with the desirable wavelength (550 nm) for the inhibition of proteins commonly used in optogenetics and whose success is still limited. Furthermore, the obtained quantum efficiency (85%) potentiates their use as a wireless optogenetic inhibitor.
Results and discussion
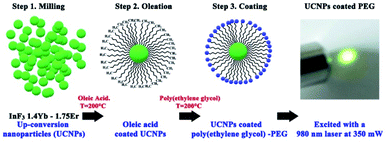
Hydrophobicity is one of the major limitations of up-conversion nanoparticles, which hinders their biomedical applications. This influences their stability and fate in the physiological environment. Therefore, it is essential to modify the surface of up-conversion nanoparticles (UCNPs) to exhibit desired hydrophilic properties to achieve water or serum dispersion to prevent aggregation or precipitation while maintaining their functional characteristics. Fig. 1 presents the scheme for the surface modification process of the InF3–1.4Yb–1.75Er glass (the sample with the highest up-conversion efficiency in this work) obtained by the melting–quenching technique, from milling to coating with a biocompatible polymer. Here the hydrophobic particles were covered with an organic solvent (oleic acid) using an inert atmosphere to facilitate a ligand exchange procedure between the modified surface (CH2) and PEG .23The size distribution of the InF3–1.4Yb–1.75Er nanoparticles (UCNPs) before and after their functionalization with PEG was determined using dynamic light scattering (DLS), obtaining a Z-average size of 992.8 and 1402 nm, respectively, while their polydispersity was 0.57 and 0.33, respectively (Fig. 2a). The morphology of the UCNPs after their functionalization is amorphous but uniform with a statistical size distribution of 38.4 ± 2.2 nm (Fig. 2b and c). The difference in the particle size between DLS and SEM micrographs is due to the use of dispersants that can enlarge the size distribution.
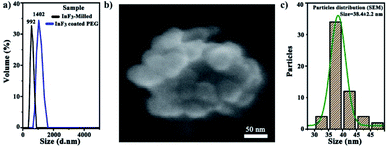 | ||
| Fig. 2 (a) DLS of InF3–1.4Yb–1.75 Er powder (milled and functionalized), (b) SEM micrograph of InF3 coated with PEG, and (c) particle size distribution of InF3 coated with PEG. | ||
EDS was employed for further analysis of the elemental composition of InF3–1.4Yb–1.75Er before and after its functionalization (Table 1), which corroborates the presence of Yb, Er, O, etc. Here, it is important to point out that oxygen in is present in the powdered InF3–1.4Yb–1.75Er at just 0.5 wt%; however, this increases during surface modification, because of the nature of the organic materials employed.
| Sample | Yb | Er | La | O | F | In | Sr |
|---|---|---|---|---|---|---|---|
| InF3–1.4Yb–1.75Er | 3.4 | 2.6 | 2.3 | 0.5 | 21.7 | 26.2 | 17.0 |
| Coated with OA | 3.5 | 2.3 | 1.7 | 0.8 | 22.2 | 24.8 | 17.7 |
| Coated with PEG | 3.3 | 2.6 | 2.1 | 1.8 | 18.6 | 22.3 | 16.2 |
The XRD diffraction patterns of InF3–1.4Yb–1.75Er with and without oleation (Fig. 3a(i) and (ii)) exhibit a typical amorphous glass system without any diffraction peaks, which reveals that the parameters employed for oleation did not modify the structural arrangement of the particles because of the temperature employed. However, the diffraction pattern of InF3–1.4Yb–1.75Er coated with PEG (Fig. 3a(iii)) showed the presence of some peaks at 18.5, 24, and 28.2°, which were ascribed to the stereocrystals observed in PEG of low molecular weight.24,25 These bands cannot be attributed to changes in the crystal structure of InF3–1.4Yb–1.75Er because the surface modification was performed at 200 °C and the crystallization process occurs up to 300 °C (Fig. S1†).
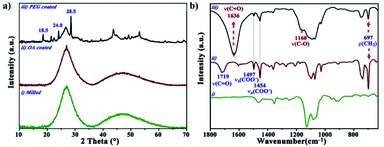 | ||
| Fig. 3 (a) X-ray diffraction patterns and (b) FTIR spectra of InF3–1.4Yb–1.75Er. (i) milled, (ii) OA-coated, and (iii) PEG-coated. | ||
To validate the effective functionalization of PEG and InF3–1.4Yb–1.75Er glass, the samples were characterized by FTIR spectroscopy, where it is possible to observe two prominent peaks at 1082 and 1128 cm−1 in InF3–1.4Yb–1.75Er glass powder (Fig. 3b(i)) that can be ascribed to the 2F5/2 → 2F7/2 (L2 and L3 splitting) energy transition of Er3+.26 On the other hand, the particles treated with OA (Fig. 3b(ii)) exhibit new bands at 697, 1454, 1497, and 1719 cm−1, which correspond to ρ(CH2), νa(COO−), νs(COO−), and ν(C![[double bond, length as m-dash]](https://www.rsc.org/images/entities/char_e001.gif) O) respectively.27,28 In the case of the functionalization with PEG, the FTIR spectrum shows a successful complexation process between the oleated particles and the polymer, which is confirmed by the presence of ν(C
O) respectively.27,28 In the case of the functionalization with PEG, the FTIR spectrum shows a successful complexation process between the oleated particles and the polymer, which is confirmed by the presence of ν(C![[double bond, length as m-dash]](https://www.rsc.org/images/entities/char_e001.gif) O) and the shift of ν(C–O) from 1110 to 1160 cm−1 (Fig. 3b(iii) and S2†).24,29
O) and the shift of ν(C–O) from 1110 to 1160 cm−1 (Fig. 3b(iii) and S2†).24,29
Fig. 4 presents the thermogravimetry and differential scanning calorimetry of InF3–1.4Yb–1.75Er before and after functionalization, where it is possible to observe that the crystallization process of the milled and oleated UCPs (Fig. 4a and b) occurred up to 378.6 °C while in the case of PEG-coated InF3 crystallization occurred at 347.7 °C (Fig. 4c), which indicates a change in the physical properties of the particles because of the polymer's presence. However, the crystalline changes happened above 340 °C, confirming that the functionalization process does not modify their crystallinity since the temperature employed for the phase transfer was 140 °C lower. These results confirm that the peaks observed by XRD in the PEG-coated InF3 are due to the presence of the polymer and not because of the devitrification of the glass.
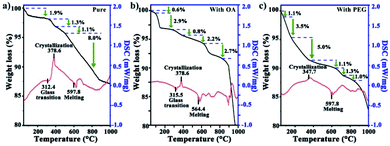 | ||
| Fig. 4 Thermogravimetry and differential scanning calorimetry (TG-DSC) curves of InF3–1.4Yb–1.75Er after (a) milling, (b) OA coating, and (c) PEG functionalization. | ||
On the other hand, the weight loss curves show that the diminishment of mass varied because of the presence of the organic compounds in OA- and PEG-coated InF3. It is important to point out that the amount of PEG in the sample corresponds to 10%, which explains the enhancement in the polydispersity observed in DLS measurements (from 0.57 to 0.33), validating the success of the functionalization. These results suggest that it is possible to modify the surface hydrophobicity of InF3 glasses obtained by the melting–quenching technique after grinding using a proper functionalization process. The success of the surface modification of the particles should allow their incorporation into a biological system with negligible effects.
Photophysical characteristics of InF3–xYb–yEr samples
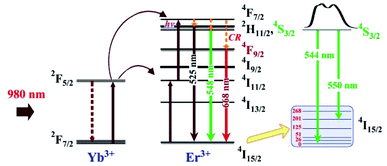
A common up-conversion emission spectrum of Er3+ ions was obtained in all the samples (Fig. 5a) with a predominant green up-converted light as a result of the 4S3/2 → 4I15/2 transition, which exhibits two peaks at 544 and 550 nm due to a split in the 4I15/2 energy level (Fig. 6) accompanied with a less intense red emission in the 650–670 nm range associated with the 4F9/2 → 4I15/2 transition. The split observed in 4I15/2 is associated with the low phonon energy of the InF3 avoiding non-radiative emission, which should increase the quantum efficiency. On the other hand, the dependence of the up-conversion emission intensity on the pump power confirms a two-photon process as the dominant mechanism to populate the emitting state.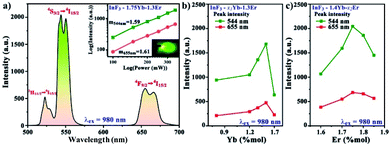 | ||
| Fig. 5 (a) Up-conversion emission spectrum of InF3–1.4Yb–1.75Er. Optimization of the molar concentrations of (b) Yb3+ and (c) Er3+. | ||
Fig. 5b and c present the optimization of the up-converted green light emission of InF3 glasses doped with different concentrations of sensitizer and activator, obtaining the highest emission at 1.4 and 1.75 mol% of Yb and Er, respectively. The increase in the intensity as a function of the mol% is associated with the distance between the ions that reduces as the concentration increase up to a maximum amount allowed, then the probability of back transfer or non-radiative decay increases.30,31
The up-conversion emission process can be explained with the help of the energy level shown in Fig. 6 as follows: the excitation of the sensitizer (Yb) allows the population of the 4F7/2 level, which decays as non-radiative emission to 2H11/2 with a subsequent relaxation process that populates 4S3/2 (green), 4F9/2 (red), and 4I11/2 (NIR emission). This process should be highly efficient if the host matrix employed avoids other cross-relaxation processes, as in the case of InF3 glass due to its low phonon energy and high non-linear optical values.19,32
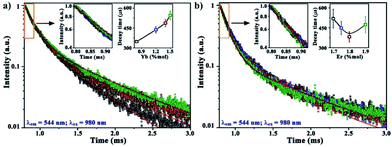
Lifetime measurements of InF3–xYb–yEr glasses (Fig. 7) were carried out to determine the energy transfer from Yb3+ to Er3+ ions. All decay curves are well-fitted with a double exponential function, which indicates a contribution from the lifetimes of other intermediate states due to the energy migration between different sensitizer ions.31,33 Such contribution can be corroborated with the average decay time obtained using eqn (1). The increase from 347 to 545 μs as the Yb concentration increases (Fig. 7a) suggests an increase in the non-radiative pathways. However, when the optimal concentration of Yb is fixed (1.4 mol%) and the amount of Er boost (Fig. 7b) the decay time due to the absorbed energy is transferred successfully to Er up to 1.8 mol%, then the concentration quenching and maybe back transfer diminishes the efficiency.30,34
 | (1) |
To corroborate the efficiency of the energy transfer process, the quantum yield of InF3–1.4Yb–1.75Er glass was evaluated, obtaining an absolute value of 85% when 4G11/2 is populated. This is attributed to the use of InF3 glass as a matrix because its low phonon energy (∼500 cm−1) diminishes the multiphoton relaxation decay and boosts the energy transfer efficiency, besides the low concentration of OH groups that cause non-radiative lost (Table 1).35,36 This value is one of the highest observed in other glasses to the authors' knowledge, where the efficiency ranges between 18 and 70% according to the transition evaluated.37,38
The cell viability of InF3–1.4Yb–1.75Er, functionalized with PEG, at different concentrations was examined using an MTS assay, where HEK-293T cells exhibited high (∼97%) survival after 24 and 48 hours when incubated with 0.1 mg mL−1 (20 μg per well) (Fig. 8). This concentration is relatively high compared to the typical concentration of 0.05 mg mL−1 for UCNPs covered with a biocompatible polymer used for bioimaging and photothermal therapy,39,40 which indicates that InF3–1.4Yb–1.75Er coated with PEG could be used in biomedical applications; however, a deeper toxicological assessment should be performed.
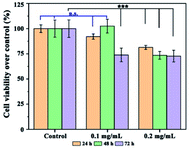 | ||
| Fig. 8 Cell viability of InF3–1.4Yb–1.75Er at different concentrations after 24, 48 and 72 h. n.s. means non-significant difference and *** means p ≤ 0.001. | ||
It is essential to point out that the superior up-converted efficiency obtained in this material avoids the necessity of high particle concentrations or high pump power, which allows us to predict the imminent success of these particles in new biomedical technology.
In a further approach, the thickness of the PEG coating or the use of different biocompatible polymers could maximize the possibilities for bioengineering because of the conjugation of up-converted light emission, biocompatibility, and tissue penetration.
Conclusions
The modulation and optimization of up-converted green light using fluoroindate glass as a host matrix were possible. This low phonon energy host matrix avoided the presence of undesirable vibrations, allowing high up-conversion emission and high quantum efficiency (85%). In addition, these particles possess excellent thermal stability, making them suitable for biomedical applications. Furthermore, these particles were functionalized with PEG to render them hydrophilic and biocompatible. The PEG-coated up-conversion nanoparticles demonstrated minimal cytotoxicity up to a concentration of 0.1 mg mL−1, which is high in comparison to the concentrations that have been reported in the literature.Experimental
Materials
Fluoride material with a purity of 99.99% was purchased from ALB Materials. Ammonium bifluoride and poly(ethylene glycol) of low molecular weight were supplied by Sigma Aldrich, while benzyl ether, cyclohexane, ether, isopropanol, and acetone were acquired from Acros Organics Co. Diethylene glycol was from Fluorochem.Up-conversion nanoparticles
Fluoroindate glasses (InF3) were obtained by platinum melting–quenching technique in a glove box with a constant argon flow (O2 < 0.5 ppm). The molar composition of such glasses is as follows: 30.8InF3–20ZnF3–20SrF3–16BaF3–4BaF3–2LaF3–xYbF3–yErF3, where x = 0.8, 1.2, 1.3, 1.4, and 1.5, and y = 1.6, 1.7, 1.75, 1.8, and 1.85. Furthermore, ammonium bifluoride was added as a fluorinating agent. All the precursors were well mixed in an agate mortar and then poured into a platinum crucible. Then, the crucible was placed in a furnace pre-heated at 200 °C, where the sample was heated up to 900 °C, quenched, and annealed for 30 min at 250 °C. The samples are identified as InF3–xYbF3–yErF3.Milling
InF3–1.4Yb–1.75Er glass was hand-powdered in a mortar before milling it in a high-energy ball mill Retsch model Emax. The obtained powder (10 g) was deposited in a steel jar and mixed with zirconium balls (ɸ 3 mm) in a solution of 8 mM of PEG (1 mL) dispersed in 30 mL of isopropanol. The experiment was performed at 600 rpm for 30 min, then the resultant solution was dried at 60 °C for one h. Finally, the material was sieved using a 65 μm Retsch sieve and stored for further functionalization.Functionalization
The first step was to cover the particles with oleic acid. To achieve that, the particles were dispersed in a solution of 20 mL of dibenzyl ether (DE) and 1 mL of oleic acid (OA) in a three-neck round bottom flask, heated and stirred at 200 °C for 30 min, and then cooled to room temperature. The particles were precipitated using cyclohexane and washed several times utilizing an ultrasonic bath and centrifuge. Then the particles were dried at 70 °C in a furnace for 12 h.The second step was adapted from our previous work,41 which consists in dispersing 2.5 g of PEG in 30 mL of diethylene glycol (DEG) at 100 °C under reflux and magnetic stirring for 30 min, then the particles, previously dispersed in hexane, were injected into the solution. Once injected, the solution was heated to 200 °C and maintained for 3 hours, and then cooled to room temperature. Functionalized particles were mixed with 5 mL of HCl solution (1 mM) and 15 mL of deionized water (DI water) to remove the polymer that was not complexed, and then washed three more times. Next, 1 mL of NaOH was added and the mixture was sonicated for 30 min, washed three more times, and dried under the same conditions as step one.
Biocompatibility
The HEK-293T cells were cultured in Dulbecco's modified Eagle medium (DMEM) supplemented with 10% (v/v) fetal bovine serum and 1% penicillin-streptomycin at 37 °C with 5% CO2 in a humidified atmosphere. The cells were seeded at a density of 5000 cells per well in 96-well plates. The samples at different concentrations in the range of 0–1 mg mL−1 (200 μl) were added to the cells and incubated for 24 hours, 48 hours, and 72 hours. At the specified time points, the media was replaced by 100 μl of fresh media followed by the addition of 20 μL of a mixture of [3-(4,5-dimethylthiazol-2-yl)-5-(3-carboxymethoxyphenyl)-2-(4-sulfophenyl)-2H-tetrazolium] (MTS) and phenazine ethosulfate (PES). The plates were further incubated for 4 hours at 37 °C. The absorbance at 490 nm was recorded using a BioTek bio plate reader.Measurements and characterization
Scanning electron microscope (SEM) images were obtained using a NOVA NANO SEM 200, while the EDS was performed using a Phenom Scanning Desktop Microscope adapted with a BSD full detector for elemental analysis. The particle size distribution was established based on Brownian motion employing the dynamic light scattering technique (DLS) utilizing a Nanosizer-ZS from Malvern Instruments. X-ray diffraction patterns were acquired using a PANalytical X'Pert Pro diffractometer equipped with a copper anode and CuKα1 radiation (λ = 1.544056 Å, 40 kV, 40 mA) positioned in Bragg–Brentano geometry. The structural analysis was performed using a Bruker Optics-Vertex 70 V FTIR spectrometer. TG/DSC curves of the compounds were recorded with a NETZSCH STA 449 F3 Jupiter device at a heating rate of 10 °C min−1 from 40 to 1000 °C. Up-converted emissions were performed using a Stellarnet Green-Wave monochromator with λexc = 976 nm and laser power of 350 mW. Luminescence decay measurements were performed on a Photon Technology International (PTI) QuantaMaster 40 (QM40) UV/VIS Steady State Spectrofluorometer coupled with a tuneable pulsed optical parametric oscillator (OPO), pumped by the third harmonic of a Nd:YAG laser (Opotek Opolette 355 LD). The system was equipped with multimode UVVIS PMT (R928) (PTI Model 914) detector. Luminescence decay curves were recorded and stored by a PTI ASOC-10 [USB-2500] oscilloscope with an accuracy of ±1 μs. The luminescence quantum yield (QY) was measured at RT using a Hamamatsu Absolute PL quantum yields measurement system (model C9920-02 G). Note: The photophysical characteristics of the samples were determined before milling (wafers with D = 1.7 mm and T = 2 mm).Author contributions
G. L. J. conceived the idea, carried out the experiments, wrote the original draft, and analysed the results. B. S. and T. P. performed and provided the resources for the MTT assay and evaluated the results. B. J. acquired quantum efficiency. B. S. and M. L. helped with the melting–quenching technique. Marta K. obtained the decay time measurements. M. K. performed some PL measurements. M. S. obtained and analysed the thermogravimetric measurements. M. L., B. J., and M. K. validated the photophysical results. D. D. conceived the idea, provided the resources, supervised, and validated the data obtained. All authors reviewed and edited the final version of the manuscript.Conflicts of interest
There are no conflicts to declare.Acknowledgements
This project was supported by the National Science Centre (Poland) granted based on the decision No. 2017/25/B/ST8/02530 and partly supported by the program Excellence initiative – research university for the AGH University of Science and Technology. The authors thank Patryk Bezkosty, Piotr Jelen, Magdalena Ziąbka, and Anna Kusior for their technical support.References
- H. Wang, D. Xue, B. Kong, X. Tu, L. Liu, X. Zhang, Y. Chang, Y. Luo, Y. Zhao and H. Zhang, Nanoscale, 2015, 7, 190–197 RSC.
- G. Chen, H. Qiu, P. N. Prasad and X. Chen, Chem. Rev., 2014, 114, 5161–5214 CrossRef CAS PubMed.
- Y. Zhang, Z. Yu, J. Li, Y. Ao, J. Xue, Z. Zeng, X. Yang and T. T. Y. Tan, ACS Nano, 2017, 11, 2846–2857 CrossRef CAS PubMed.
- R. Chen, A. Canales and P. Anikeeva, Nat. Rev., 2017, 2, 1–16 Search PubMed.
- M. R. Warden, J. A. Cardin and K. Deisseroth, Annu. Rev. Biomed. Eng., 2014, 16, 10`3–129 CrossRef CAS PubMed.
- O. Yizhar, L. E. Fenno, T. J. Davidson, M. Mogri and K. Deisseroth, Neuron, 2011, 71, 9–34 CrossRef CAS PubMed.
- A. Pliss, T. Y. Ohulchanskyy, G. Chen, J. Damasco, C. E. Bass and P. N. Prasad, ACS Photonics, 2017, 4, 806–814 CrossRef CAS.
- Y. Zhang, L. M. Wiesholler, H. Rabie, P. Jiang, J. Lai, T. Hirsch and K. B. Lee, ACS Appl. Mater. Interfaces, 2020, 12, 40031–40041 CrossRef CAS PubMed.
- I. Rostami, H. R. Alanagh, Z. Hu and S. H. Shahmoradian, Int. J. Nanomed., 2019, 14, 7759–7780 CrossRef CAS PubMed.
- X. Lin, X. Chen, W. Zhang, T. Sun, P. Fang, Q. Liao, X. Chen, J. He, M. Liu, F. Wang and P. Shi, Nano Lett., 2018, 18, 948–956 CrossRef CAS PubMed.
- X. Li, H. Xiong, N. Rommelfanger, X. Xu, J. Youn, P. A. Slesinger, G. Hong and Z. Qin, Matter, 2021, 4, 1484–1510 CrossRef CAS PubMed.
- J. F. Rolindes Balda Ei Ei Nyein and U. Hömmerich, Opt. Express, 2006, 14, 3993 CrossRef PubMed.
- H. Yang, Z. Dai, J. Li and Y. Tian, J. Non-Cryst. Solids, 2006, 352, 5469–5474 CrossRef CAS.
- Y. Liu, Z. Zhou, S. Zhang, E. Zhao, J. Ren, L. Liu and J. Zhang, Nanomaterials, 2021, 11, 2767 CrossRef CAS PubMed.
- D. L. Sidebottom, M. A. Hruschka, B. G. Potter and R. K. Brow, J. Non-Cryst. Solids, 1997, 222, 282–289 CrossRef CAS.
- S. Y. Li, H. Cheng, W. X. Qiu, L. Zhang, S. S. Wan, J. Y. Zeng and X. Z. Zhang, Biomaterials, 2017, 142, 149–161 CrossRef CAS PubMed.
- Y. Feng, Z. Li, Q. Li, J. Yuan, L. Tu, L. Ning and H. Zhang, Light Sci. Appl., 2021, 10, 105 CrossRef CAS PubMed.
- V. Klinkov, V. Aseev, A. Semencha and E. Tsimerman, Sensor Actuator Phys., 2018, 277, 157–162 CrossRef CAS.
- M. Kochanowicz, J. Zmojda, A. Baranowska, M. Kuwik, B. Starzyk, M. Lesniak, P. Miluski, W. A. Pisarski, J. Pisarska, J. Dorosz, M. Ferrari and D. Dorosz, Sensors, 2021, 21, 2155 CrossRef CAS PubMed.
- S. Wen, J. Zhou, K. Zheng, A. Bednarkiewicz, X. Liu and D. Jin, Nat. Commun., 2018, 9, 2415 CrossRef PubMed.
- L. Fu, H. Xia, Y. Dong, S. Li, X. Gu, J. Zhang, D. Wang, H. Jiang and B. Chen, J. Alloys Compd., 2014, 617, 584–587 CrossRef CAS.
- Y. Yang, Y. Chu, Z. Chen, Y. Ma, L. Liao, H. Li, J. Peng, N. Dai, J. Li and L. Yang, J. Lumin., 2018, 195, 247–251 CrossRef CAS.
- T. Zhang, J. Ge, Y. Hu and Y. Yin, Nano Lett., 2007, 7, 3203–3207 CrossRef CAS PubMed.
- K. Shameli, M. Bin Ahmad, S. D. Jazayeri, S. Sedaghat, P. Shabanzadeh, H. Jahangirian, M. Mahdavi and Y. Abdollahi, Int. J. Mol. Sci., 2012, 13, 6639–6650 CrossRef CAS PubMed.
- R. Li, Y. Wu, Z. Bai, J. Guo and X. Chen, RSC Adv., 2020, 10, 42120–42127 RSC.
- T. A. Sheikh, M. M. Rahman, A. M. Asiri and H. M. Marwani, New J. Chem., 2018, 42, 3936–3946 RSC.
- K. Yang, H. Peng, Y. Wen and N. Li, Appl. Surf. Sci., 2010, 256, 3093–3097 CrossRef CAS.
- Y. Y. Shi, B. Sun, Z. Zhou, Y. T. Wu and M. F. Zhu, Prog. Nat. Sci.: Mater. Int., 2011, 21, 447–454 CrossRef.
- A. Sedlmeier and H. H. Gorris, Chem. Soc. Rev., 2015, 44, 1526–1560 RSC.
- F. T. Rabouw, P. T. Prins, P. Villanueva-Delgado, M. Castelijns, R. G. Geitenbeek and A. Meijerink, ACS Nano, 2018, 12, 4812–4823 CrossRef CAS PubMed.
- J. Bergstrand, Q. Liu, B. Huang, X. Peng, C. Würth, U. Resch-Genger, Q. Zhan, J. Widengren, H. Ågren and H. Liu, Nanoscale, 2019, 11, 4959–4969 RSC.
- J. Qiu, K. Maeda, R. Terai and H. Wakabayashi, J. Non-Cryst. Solids, 1997, 213–214, 363–368 CrossRef.
- K. Halubek-Gluchowska, D. Szymański, T. N. L. Tran, M. Ferrari and A. Lukowiak, Materials, 2021, 14, 1–19 CrossRef PubMed.
- H. Qin, D. Wu, J. Sathian, X. Xie, M. Ryan and F. Xie, Sci. Rep., 2018, 8, 2–9 CrossRef PubMed.
- M. E. Alvarez-Ramos, F. Félix-Domínguez, G. Saavedra-Rodríguez and R. C. Carrillo-Torres, Opt. Mater., 2021, 120, 111413 CrossRef CAS.
- D. Sola, A. Miguel, E. Arias-egido and J. I. Peña, Appl. Sci., 2021, 11, 1–10 Search PubMed.
- M. Azam and V. K. Rai, Methods Appl. Fluoresc., 2018, 6, 025002 CrossRef PubMed.
- K. Siva Rama Krishna Reddy, K. Swapna, M. Venkateswarlu, S. Mahamuda and A. S. Rao, Solid State Sci., 2019, 97, 106016 CrossRef CAS.
- Y. Wang, J. Low, Y. Bi, Y. Bai, Y. Jiang, H. Wang, W. Liu, Y. Ma, Y. Chen, R. Long and Y. Xiong, Chin. Chem. Lett., 2021, 33, 1087–1090 CrossRef.
- P. Li, Y. Yan, B. Chen, P. Zhang, S. Wang, J. Zhou, H. Fan, Y. Wang and X. Huang, Biomater. Sci., 2018, 6, 877–884 RSC.
- G. L. Jiménez, R. Thevi Guntnur, J. Guiliani and G. Romero, AIChE J., 2021, 67, e17437 CrossRef.
Footnote |
| † Electronic supplementary information (ESI) available. See https://doi.org/10.1039/d2ra03171j |
| This journal is © The Royal Society of Chemistry 2022 |

